Analyze data in lists with help from Copilot (preview)
[This article is prerelease documentation and is subject to change.]
This article explains how to use the analysis assist to help you analyze data on list pages.
Important
- This is a Production Ready Preview feature.
- Production Ready Previews are subject to supplemental terms of use. More information: Supplemental terms of use for Dynamics 365 preview
About analysis assist
Analysis assist is a Copilot for the analysis mode on list pages in Business Central. The analysis mode provides an interactive and versatile way to calculate, summarize, and examine data. To analyze data in the analysis mode, you create an analysis tab where you transform the data to display the desired aggregations and summarizations. For example, you arrange fields in rows and columns, specify filters, sort columns, and pivot on fields. With analysis assist, instead of doing this task manually, you achieve much of the same—or least as a start—by using words. By expressing the structure you want in natural language, like "sort on quantity from smallest to largest" or "show average cost per category", analysis assist uses AI to generate a suggested layout on an analysis tab.
Prerequisites
- Analysis assist capability is activated and you're granted permissions to use it. This task is typically done by an admin. Learn more about configuring Copilot and AI capabilities.
- The display language in Business Central is set to one the following English locales: en-AU, en-CA, en-GB, en-IE, en-IN, en-NZ, en-PH, en-SG, en-US, en-ZA. Learn more about changing the language.
- Your Business Central environment is in any country/region except Canada (this feature isn't yet available in Canada).
Get started
Open the list page you want to analyze.
For example, to work with Items page, select the
 icon (Alt+Q), enter items, and then choose the related link.
You can start analyzing data with Copilot directly from the list page or by first entering the analysis mode. To get started, do one of the following steps:
- In the action bar at the top of the page, select
 Copilot > Analyze list.
 - In the action bar at the top of the page, select
 Enter analysis mode, then select Copilot > Create new analysis.
- In the action bar at the top of the page, select
In the Analyze with Copilot window, enter a description of the layout you want. This description is known as a prompt.
Tip
For help in writing a prompt, select
 Prompt guide, and choose one of the options to get you started. The text in brackets
 [ ]is shown only as an example and isn't included in the Copilot window.Select Generate and then wait while Copilot generates the layout on new analysis tab.
Review the results on the new analysis tab.
Note
If navigate away from the new analysis tab (such as going to another anlaysis tab or page) or make layout changes on the tab (such as sorting columns or changing settings in the Columns and Analysis Filters tabs), the new analysis tab is automatically saved and Copilot closes.
If you want to change the generated analysis, you can do one of the steps:
To build on the previous instructions, enter the information in the Add more details about the analysis box, then select the
 Adjust arrow. Copilot remembers your previous instructions and uses them to make adjustments.
To start from scratch by adding new instructions, select the
 Edit prompt:, add the details to the prompt, and then select Generate.
If you want to save the analysis tab, select Keep it. If you don't to save it, select Discard.
Prompt tips and examples
Creating effective prompts for Copilot is essential to get accurate and relevant analysis suggestions. There are also ways to minimize text you add in prompts to make it faster when typing. Here are some tips and guidelines followed by some examples:
- Be concise and avoid long sentences or multiple sentences.
- Make sure field names used in prompts are somewhat close to actual field names on the page.
- Use natural language, expressing the data structure you want in a friendly and conversational manner.
- Use common keywords, phrases, and terms used in data analysis, like
group by,sum,sort by, and so on. - If the initial response isn't what you want, add follow-up instructions or rephrase the last instruction.
- Common abbreviations are acceptable.
- Letter case isn't important.
Examples
These following prompt examples use analysis assist on the Items list. The items page includes three summable fields for analysis: Quantity on Hand, Unit Cost, Unit Price.
Prompt: Show items by brand and unit of measure
This prompt tries to show totals for all summable fields, grouped by brand and Base Unit of Measure field. But in this case, "brand" doesn't match any field name, so Copilot probably can't find a matching field so it asks you to rephrase the prompt and try again.
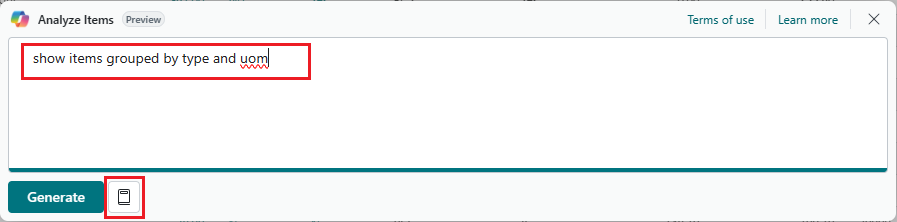
Prompt: Show items by type and uom
This prompt shows totals for all summable fields, grouped by the Type field and Base Unit of Measure field. But instead of writing out "unit of measure", the abbreviation uom is used.
Prompt: Show total quantity per type per UoM
This prompt creates a pivot table on the Quantity on Hand field per Base Unit of Measure per Type.
See also
Feedback
Coming soon: Throughout 2024 we will be phasing out GitHub Issues as the feedback mechanism for content and replacing it with a new feedback system. For more information see: https://aka.ms/ContentUserFeedback.
Submit and view feedback for