How Can I Debug a C++ Access Violation?
Applies to: ![]() Visual Studio
Visual Studio ![]() Visual Studio for Mac
Visual Studio for Mac
Note
This article applies to Visual Studio 2017. If you're looking for the latest Visual Studio documentation, see Visual Studio documentation. We recommend upgrading to the latest version of Visual Studio. Download it here
Problem Description
My program produces an access violation. How can I debug this?
Solution
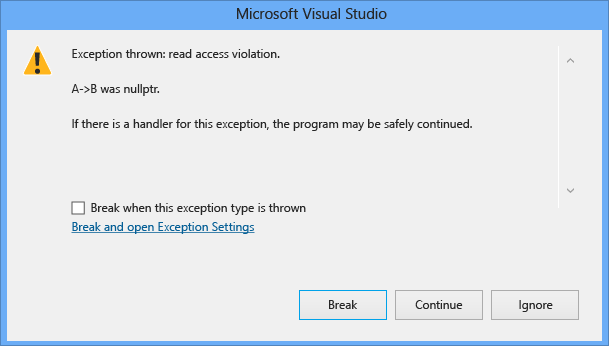
If you get an access violation on a line of code that dereferences multiple pointers, it can be difficult to find out which pointer caused the access violation. Starting in Visual Studio 2015 Update 1, the exception dialog box now explicitly names the pointer that caused the access violation.
For example, given the following code, you should get an access violation:
#include <iostream>
using namespace std;

class ClassC {
public:
  void printHello() {
    cout << "hello world";
  }
};

class ClassB {
public:
  ClassC* C;
  ClassB() {
    C = new ClassC();
  }
};

class ClassA {
public:
  ClassB* B;
  ClassA() {
    // Uncomment to fix
    // B = new ClassB();
  }
};

int main() {
  ClassA* A = new ClassA();
  A->B->C->printHello();

}
If you run this code in Visual Studio 2015 Update 1, you should see the following exception dialog:
If you cannot determine why the pointer caused an access violation, trace through the code to make sure that the pointer causing the problem has been assigned correctly. If it is passed as a parameter, make sure that it is passed correctly, and you aren't accidentally creating a shallow copy. Then verify that the values are not being unintentionally changed somewhere in the program by creating a Data Breakpoint for the pointer in question to make sure it isn't being modified elsewhere in the program. For more information about data breakpoints, see the data breakpoint section in Using Breakpoints.