SQL Server Reporting Services
A SQL Server technology that supports the creation, management, and delivery of both traditional, paper-oriented reports and interactive, web-based reports.
2,813 questions
This browser is no longer supported.
Upgrade to Microsoft Edge to take advantage of the latest features, security updates, and technical support.
' cx='32' cy='32' r='32' /%3E%3Ctext x='50%25' y='55%25' dominant-baseline='middle' text-anchor='middle' fill='%23FFF' %3EM%3C/text%3E%3C/svg%3E)
Hi all:
I have a table call EPowerLog,
The table have 2 columns
Column A : LogTime (datetime)
Column B : PowerValue (float)
Data like this
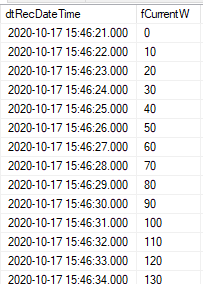
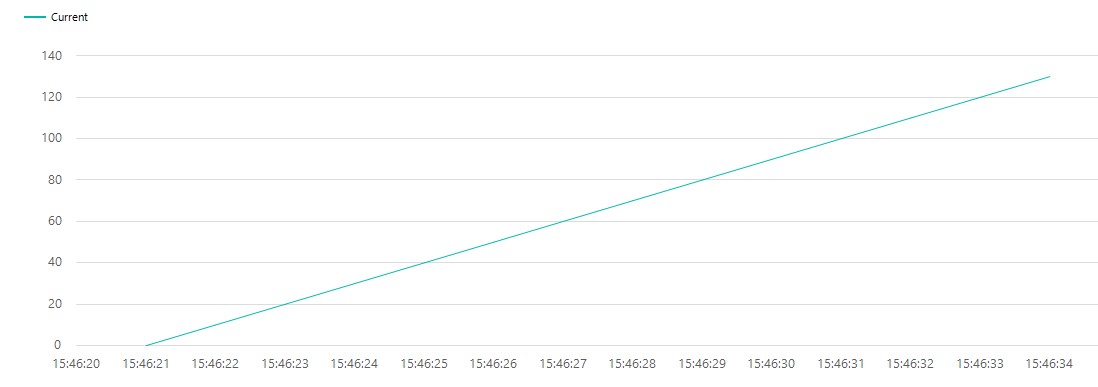
There have 382 records which record from 15:46:21.000 to 15:52:44.000
Then I use SSRS Report builder to build a Simple Line Chart,
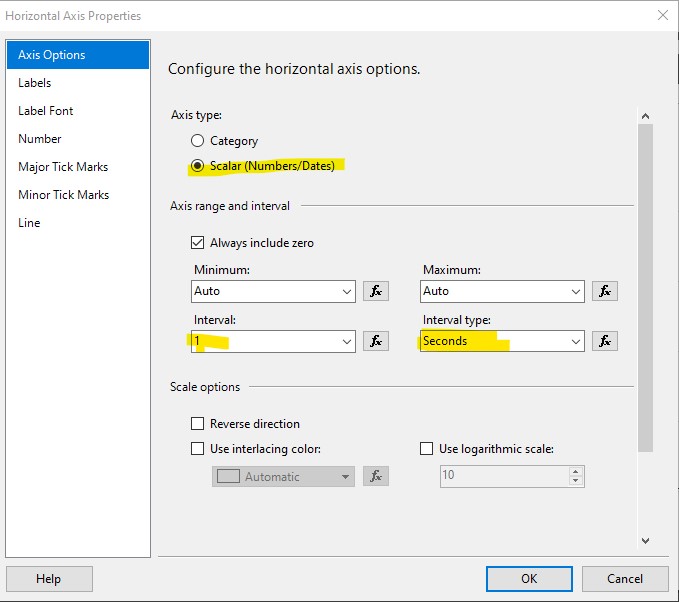
The Horizonal Axis Properties, Interval : Auto, Interval Type : Auto, Number Format : Time
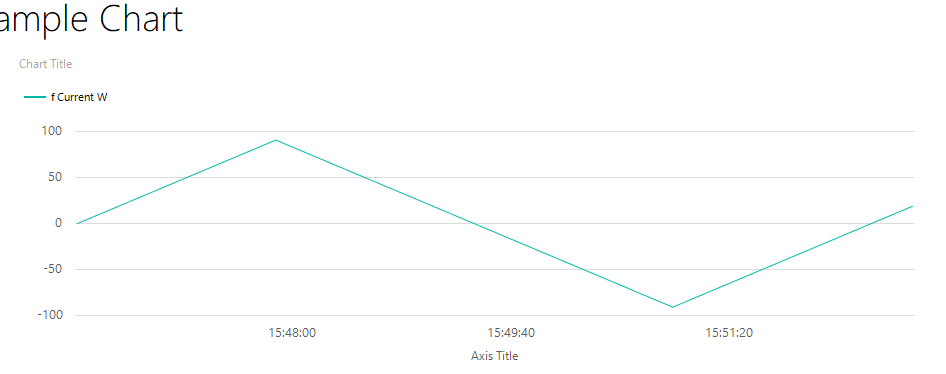
But I need the Horizonal Axis Properties need to show every second or every 5 second, I try to set
Interval : 1, Interval Type : Number or Second, The Y Axis label disappear.
Can I know how to set it?
Thanks for help

Hi @MicKYip ,
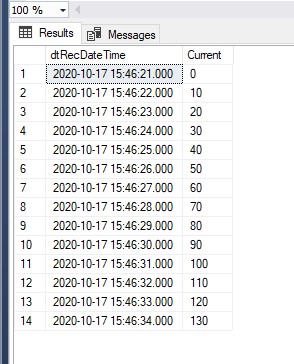
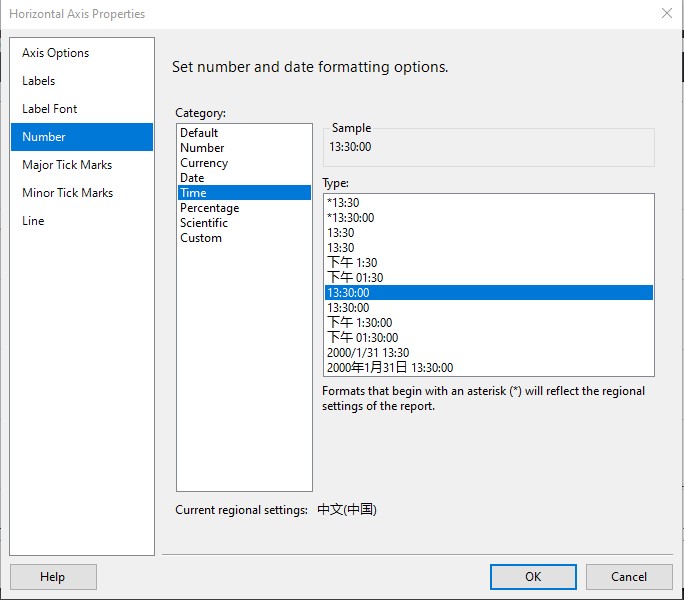
First of all, make sure that the calculation result of the value displayed on the X axis must be of the DateTime data type in order to set the time interval format correctly. If the data type of the field is String, the chart will not calculate the interval as a date or time
I did a test based on the information you provided:
If the answer is helpful, please click "Accept Answer" and upvote it.
Note: Please follow the steps in our documentation to enable e-mail notifications if you want to receive the related email notification for this thread.
Hi @MicKYip ,
Has your issue been resolved?
If you have any question, please feel free to let me know.
Best Regards,
Joy
If the answer is helpful, please click "Accept Answer" and upvote it.
Note: Please follow the steps in our [documentation][1] to enable e-mail notifications if you want to receive the related email notification for this thread.