Windows Presentation Foundation
A part of the .NET Framework that provides a unified programming model for building line-of-business desktop applications on Windows.
2,671 questions
This browser is no longer supported.
Upgrade to Microsoft Edge to take advantage of the latest features, security updates, and technical support.
' cx='32' cy='32' r='32' /%3E%3Ctext x='50%25' y='55%25' dominant-baseline='middle' text-anchor='middle' fill='%23FFF' %3ECH%3C/text%3E%3C/svg%3E)
This is a MSDN question asked by Mike Whalley, the source is Removing line chart datapoints where dependency property is null.
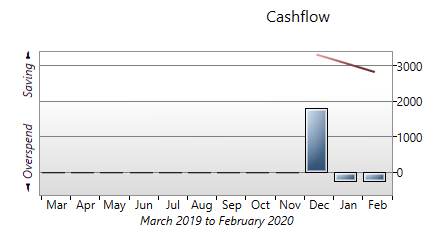
I have a line and bar chart showing the monthly movement in a bank account and the account balance (cashflow) as illustrated:
The account in this example was only opened in December. I want to have all previous datapoints removed (Mar to Nov) so that the line starts only at December (but for design consistency with other accounts I need to keep the whole 12 months range). I had thought that making the dependency value null would do this and accordingly set up my DataPointSeries dependency value as nullable:
private void GetCashLine()
        {
            List<KeyValuePair<string, decimal?>> balanceList = new List<KeyValuePair<string, decimal?>>();
            decimal? balance = null;
            for (int i = 0; i < 12; i++)
            {
                if (monthResult[i].Balance.HasValue)
                {
                    balance = decimal.Parse(((decimal)monthResult[i].Balance).ToString("N2"));
                }
                else if (i == 0)// Necessary to prevent"No suitable axis is available for plotting the dependent value" error if first X value is null
                {
                    balance = 0M;
                }
                KeyValuePair<string, decimal?> balancePoint = new KeyValuePair<string, decimal?>(months[startMonth - 1 + i < 0 ? 12 : startMonth - 1 + i], balance?? balance);
                balanceList.Add(balancePoint);
            }
            (columnChart.Series[1] as DataPointSeries).ItemsSource = balanceList;
        }
but the datapoints still show as above (note that the first dependency value datapoint cannot be null as this produces an "No suitable axis is available for plotting the dependent value" run-time error).
My XAML is:
<chartingToolkit:Chart  Height="260" HorizontalAlignment="Left" VerticalAlignment="Top"
                        Margin="75,-240,0,0" x:Name="columnChart" Title="Cashflow" Width="580" Background="White" ScrollViewer.CanContentScroll="True"  BorderBrush="{x:Null}">
                        <chartingToolkit:Chart.Axes>
                            <chartingToolkit:CategoryAxis x:Name="labelXAxis" MinWidth="20" VerticalAlignment="Bottom" Orientation="X" ShowGridLines="False"
                                Margin="2,0,0,-10" />
                            <chartingToolkit:CategoryAxis x:Name="labelYAxis" Title=" ◄ Overspend        Saving ►" MinWidth="20" VerticalAlignment="Bottom" Orientation="Y"
                                ShowGridLines="False"  />
                        </chartingToolkit:Chart.Axes>
                        <chartingToolkit:ColumnSeries x:Name="clnsExpenses" Title="Saving or deficit" DependentValuePath="Value" IndependentValuePath="Key" ItemsSource="{Binding}" />
                        <chartingToolkit:LineSeries x:Name="clnsBalanceLineChart" Foreground="Red"  Title="Account balance" DependentValuePath="Value"
                                                    IndependentValuePath="Key" ItemsSource="{Binding}">

                        </chartingToolkit:LineSeries>
                    </chartingToolkit:Chart>
I need to remove all datapoints where the value of the dependency property is null (but not zero) and would also prefer to overcome the need to set the first datapoint value to null as well.
Many solutions deal only with hiding or removing only the datapoint itself, or the whole series, but I want to delete an individual datapoint and the line joining it to the next datapoints if the it is null.
How can I achieve this?

Hi,
Welcome to our Microsoft Q&A platform!
Do you want to delete the previous data or just the LineSeries?
private void Button_Click(object sender, RoutedEventArgs e)
        {
            LineSeries ls = (LineSeries)Chart.Series[1];
            ObservableCollection<KeyValuePair<string, int>> list = (ObservableCollection<KeyValuePair<string, int>>)ls.ItemsSource;
            for (int index = 0; index < 6; index++)
            {
                list.RemoveAt(0);
            }
        }
Thanks.
' cx='32' cy='32' r='32' /%3E%3Ctext x='50%25' y='55%25' dominant-baseline='middle' text-anchor='middle' fill='%23FFF' %3EMW%3C/text%3E%3C/svg%3E)
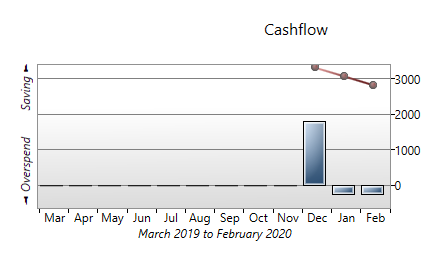
Cracked it. @Alex Li-MSFT 's answer above was helpful and had the effect of removing the earlier (pre-December in the illustration above) datapoints, but it also removed the points from the line for the subsequent months as well (although this didn't happen, strangely, if Alex's code is included in a subsequent event, triggered after the chart is created and populated). This is what I got:
But I got the result I needed by creating the full 12 months Keys in Series[0] and then simply populating only the months I needed to show in the line for Series1 (i.e. excluding any where the value was null):
It is essential to add the first Series with the full range of keys you need on your chart first (noting that the value of the first Key of the first Series cannot be null, as this produces an ''Object reference not set to an instance of an object' run-time exception when you try to add your KeyValuePairs list to your DataPointSeries ItemsSource). My final code is:
//Series[0]: chart columns
            List<KeyValuePair<string, decimal?>> netSpendList = new List<KeyValuePair<string, decimal?>>();
            for (int i = 0; i < 12; i++)
            {
                if (monthResult[i].Balance.HasValue)
                {
                    netSpendList.Add(new KeyValuePair<string, decimal?>(months[startMonth - 1 + i < 0 ? 12 : startMonth - 1 + i], decimal.Parse(((decimal)monthResult[i].income - (decimal)monthResult[i].expense).ToString("N2"))));
                }
                else if (i == 0) //Note, first Value in the Series cannot be null
                {
                    netSpendList.Add(new KeyValuePair<string, decimal?>(months[startMonth - 1 + i < 0 ? 12 : startMonth - 1 + i], 0M));
                }
                else
                {
                    netSpendList.Add(new KeyValuePair<string, decimal?>(months[startMonth - 1 + i < 0 ? 12 : startMonth - 1 + i], null));
                }
            }
            (cashflowChart.Series[0] as DataPointSeries).ItemsSource = netSpendList;
             //Series[1]: Chart line (partial only)
            List<KeyValuePair<string, decimal?>> balanceList = new List<KeyValuePair<string, decimal?>>();
            decimal? balance = null;
            for (int i = 0; i < 12; i++)
            {
                if (monthResult[i].Balance.HasValue)
                {
                    balance = decimal.Parse(((decimal)monthResult[i].Balance).ToString("N2"));
                    KeyValuePair<string, decimal?> balancePoint = new KeyValuePair<string, decimal?>(months[startMonth - 1 + i < 0 ? 12 : startMonth - 1 + i], balance ?? balance);
                    balanceList.Add(balancePoint);
                }
            }
            (cashflowChart.Series[1] as DataPointSeries).ItemsSource = balanceList;