SQL Server Reporting Services
A SQL Server technology that supports the creation, management, and delivery of both traditional, paper-oriented reports and interactive, web-based reports.
2,790 questions
This browser is no longer supported.
Upgrade to Microsoft Edge to take advantage of the latest features, security updates, and technical support.
' cx='32' cy='32' r='32' /%3E%3Ctext x='50%25' y='55%25' dominant-baseline='middle' text-anchor='middle' fill='%23FFF' %3EA%3C/text%3E%3C/svg%3E)
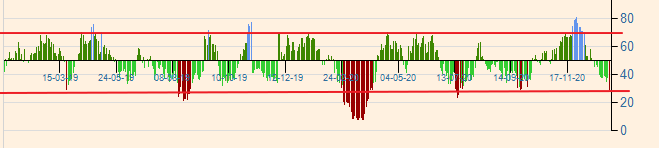
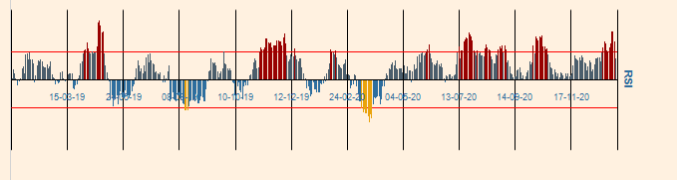
Im looking for a way of fixating the horizontal major gridlines. I need them to be positioned at 70 and 30. I am thinking of removing the major gridlines entirely and just add two striplines together with two textboxes indicating the level on the Y axis but I would prefer to do it with gridlines :)
an exaple with red lines below - disregard the existing gridlines.
Hi,
@Joyzhao-MSFT - thank you for taking your time to provide input for my question. I decided to with the striplines.

Hi @agepeder ,
Thanks for your feedback.
If you think the solution I gave is effective, please click "Accept Answer" and upvote it.
Thank you!
Best Regards,
Joy
Hi @agepeder ,
According to your description, you only want to show 2 main grid lines in the bar chart, right?
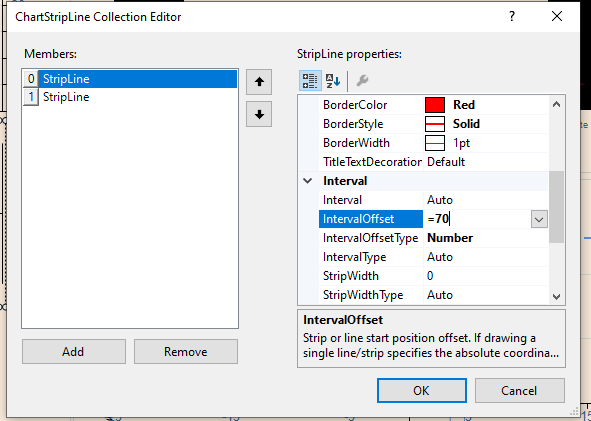
Usually, we can set the Interval and IntervalOffset properties to only control the display of the main grid lines in the bar chart. For example, if we specify the data field "SalesAmount" as the chart value, and another data field "Category" as the "category group", please refer to the following steps to configure the grid lines.
If the answer is helpful, please click "Accept Answer" and upvote it.
Note: Please follow the steps in our documentation to enable e-mail notifications if you want to receive the related email notification for this thread.