Not Monitored
Tag not monitored by Microsoft.
36,253 questions
This browser is no longer supported.
Upgrade to Microsoft Edge to take advantage of the latest features, security updates, and technical support.
' cx='32' cy='32' r='32' /%3E%3Ctext x='50%25' y='55%25' dominant-baseline='middle' text-anchor='middle' fill='%23FFF' %3ES%3C/text%3E%3C/svg%3E)
Hi everyone,
I'm having an issue with a measure created in DAX on powerpivot that I can't get my head around.
I'm importing data from a github with statistics on Coronavirus in my country. From the data I select "New cases" column and perfom the calculations, in M, to get the pero 100k cases and then load the table to a workbook sheet and to power pivot.
So far so good.
In PowerPivot I create a measure using DAX to get the 7 day moving average of the per 100k cases.
The idea is to duplicate the Harvad Index and visualize it in a pivot table and pivot chart with automatic updates.
First day I didn't it went beautifully, but now, 2 days later, everytime new data is imported, all calulations are done correctly, by the output in the pivot table is incorrect. If I check the meassure in the datamodel, it shows the correct result, but for some strange reason, it shows a different result in the pivot table and I can't undertstand why.
You can find the file here to see: https://1drv.ms/x/s!AmrjlXSYqMxe4H1S-w6aySjF80jN?e=84evV0
Thanks in advance for any help in figuring this out.
Cheers!

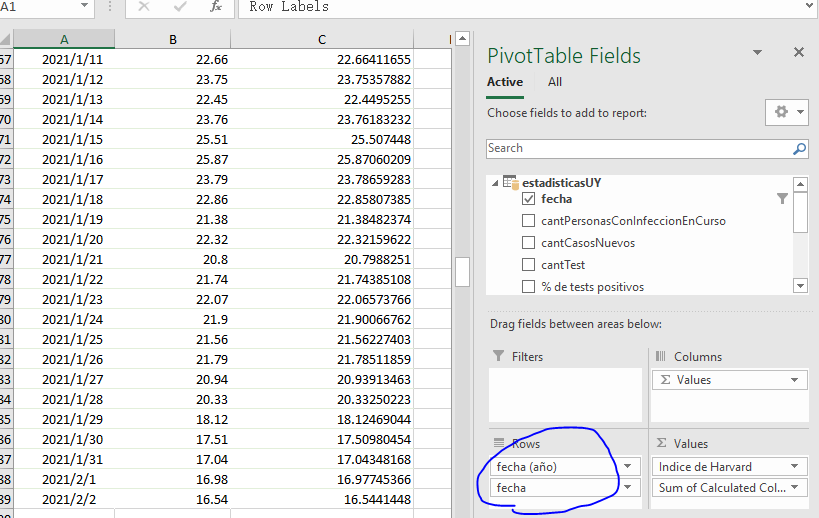
According to your file, if you remove "fecha (mes)", your measure will get different values in pivot table.
I added a new column in Data Model, enter following formula, and the values are same as measure values. So I suggest you remove "fecha (mes)" field in pivot table to get correct results.
=IF('estadisticasUY'[fecha]>=CALCULATE(LASTNONBLANK('estadisticasUY'[fecha],1),TOPN(7,'estadisticasUY')),AVERAGEX(FILTER('estadisticasUY','estadisticasUY'[fecha]<=EARLIER('estadisticasUY'[fecha])&&'estadisticasUY'[fecha]>EARLIER('estadisticasUY'[fecha])-7),'estadisticasUY'[Casos por 100k]),BLANK())
If an Answer is helpful, please click "Accept Answer" and upvote it.
Note: Please follow the steps in our documentation to enable e-mail notifications if you want to receive the related email notification for this thread.
Hi @Emily Hua-MSFT got a question.
Is it posible to perfom the same operation but in power query m language? That way, instead of importing with power query and doing the cases per 100k, also add right then and there the Harvard Index, instead of throwing it to power pivot and adding the column there.
I've been trying, but my skills are very, very limited and could not duplicate the logic behind your formula with m in power query.
Would it be too much trouble to ask for you help in this?
Thanks
@Shinka
Thank you for accepting my reply as an answer. But I am mainly responsible for general usage issues of the Office desktop clients.
As I am not familiar with Power Query M language, I think you need other experts to help you.
Thanks for your understanding.
@Lz._
Would you mind if i disturb you?
As I am not a Power Query M language expert, could you please share us some idea or sharing?
Thanks in advance.

@Emily Hua-MSFT
I'll be glad to look at a Power Query solution if one exists. For this @Shinka should open a new thread explaining what s/he wants to acheive + share a workbook with a sample of the underlying data + (if possible) translate the column names in English :)
Thank you so much! Worked like a charm.
Decided to delete the measure and keep the new column in the data model. That way I may keep the fecha(mes) row in the pivot table, which helps the visualization of the data.
Cheers!