Windows Forms
A set of .NET Framework managed libraries for developing graphical user interfaces.
1,838 questions
This browser is no longer supported.
Upgrade to Microsoft Edge to take advantage of the latest features, security updates, and technical support.
' cx='32' cy='32' r='32' /%3E%3Ctext x='50%25' y='55%25' dominant-baseline='middle' text-anchor='middle' fill='%23FFF' %3ERK%3C/text%3E%3C/svg%3E)
Dear all ,
Using this below sql stored procedure i want to create line chart with 3 line in my winforms app , but during execution i am getting this below error:
System.ArgumentOutOfRangeException: 'Index was out of range. Must be non-negative and less than the size of the collection.
Parameter name: index
In the line:
Chrtline.Series[1].Points.DataBindXY(Datetable, Turningtable);
kindly help me how to solve this , and what i am doing wrong:
my sql stored procedure:
@fromDate Date,
@toDate Date
as
SELECT [Date],
isnull([Milling],0)as [Milling],
isnull([Turning],0) as [Turning],
isnull([EDM],0) as [EDM] FROM (
  SELECT
    [Date],
    Department,
    Count(Action_Status) as Status
  FROM Semicon_NPD
  Where (Date between  @fromDate  and  @toDate) and (Action_Status = 'Pending')
   group by Department,[Date]
) StatusCount
PIVOT (
  SUM([Status])
  FOR [Department]
  IN (
    [Milling],
    [Turning],
    [EDM]
  )
)
 AS PivotTable
my code for populating chart:
private void statusline()
        {
            SqlConnection con = new SqlConnection(cs);
            SqlCommand cmd = new SqlCommand("statusline", con);
            cmd.Parameters.AddWithValue("@fromDate", dtfrom.Value);
            cmd.Parameters.AddWithValue("@toDate", dtto.Value);
            cmd.CommandType = CommandType.StoredProcedure;
            con.Open();
            SqlDataReader dr = cmd.ExecuteReader();
            while (dr.Read())
            {
                Datetable.Add(dr.GetDateTime(0));
                Millingcount.Add(dr.GetInt32(1));
                Turningtable.Add(dr.GetInt32(2));
                EDMtable.Add(dr.GetInt32(3));

            }
            Chrtline.Series[0].Points.DataBindXY(Datetable, Millingcount);
            Chrtline.Series[1].Points.DataBindXY(Datetable, Turningtable);
            Chrtline.Series[2].Points.DataBindXY(Datetable, EDMtable);
            dr.Close();
            con.Close();
        }
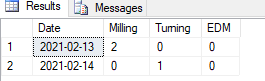
example result set:

Adding right tags/teams to assist

So how to you create this Chrtline collection? I would take the error to say that 1 is out side the range of the array. That is, there seems to only be a single object in it.
@Erland Sommarskog thank you so much for your response ...i now corrected the mistake ..the mistake is as you said i forgot to add axis to chart itself using series tab.