Azure App Service
Azure App Service is a service used to create and deploy scalable, mission-critical web apps.
6,866 questions
This browser is no longer supported.
Upgrade to Microsoft Edge to take advantage of the latest features, security updates, and technical support.
' cx='32' cy='32' r='32' /%3E%3Ctext x='50%25' y='55%25' dominant-baseline='middle' text-anchor='middle' fill='%23FFF' %3EME%3C/text%3E%3C/svg%3E)
I recently deployed and Django Rest Framework API with a PostgreSQL database using a web app service.
I'm receiving bad response times of > 1 second, I'm not exactly sure what it could be.
Any suggestions on how to investigate further would be greatly appreciated. Thanks!
' cx='32' cy='32' r='32' /%3E%3Ctext x='50%25' y='55%25' dominant-baseline='middle' text-anchor='middle' fill='%23FFF' %3EA%3C/text%3E%3C/svg%3E)
@Matthew Evans , Thanks for sharing a detailed description of the issue.
You have stated, the WebApp was recently deployed, just to confirm- have you been experiencing this issue since the time of deployment or after some config change? Do you also receive any specific error message or just the slow response time?
There could be several causes for high response time, to isolate the issue. Kindly try these steps:
Always On feature. By default, web apps are unloaded if they are idle for some period of time. This lets the system conserve resources. In Basic or Standard mode, you can enable Always On to keep the app loaded all the time. Diagnose and solve problems – Checkout the tile for “Diagnostic Tools” > “Availability and Performance” & "Best Practices". 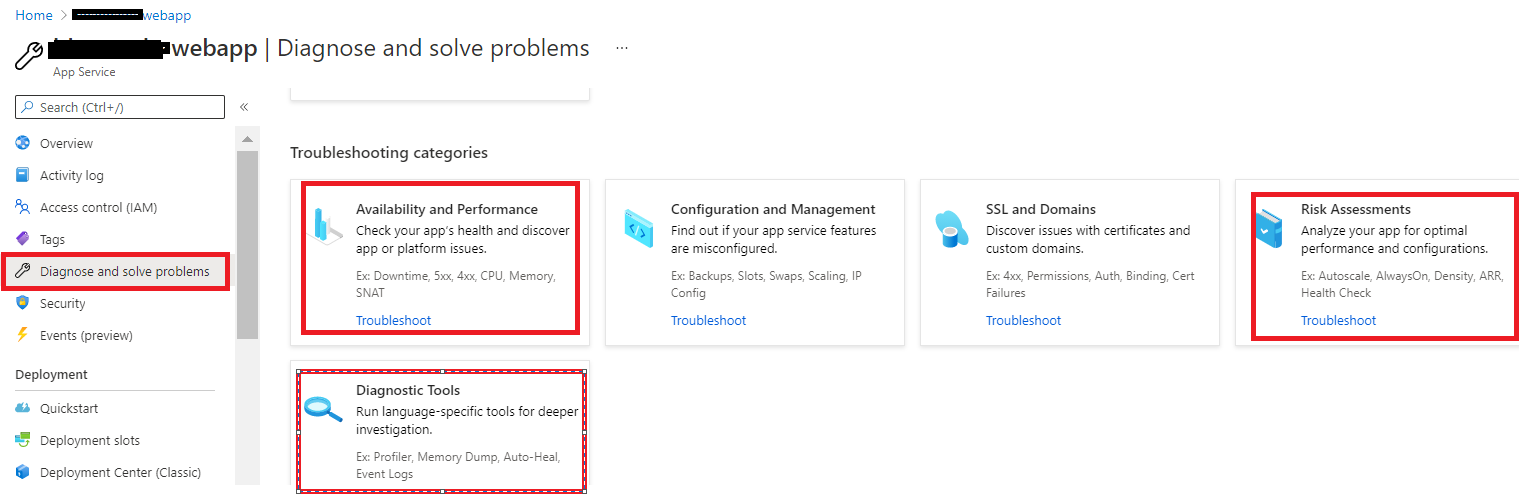
scale out condition or 25% for scale-in condition as test and see if that makes any difference (to avoid flapping condition/I understand you have already analyzed CPU usage) outbound TCP limits is easier to solve, as the limits are set by the size of your worker. You can see the limits in Sandbox Cross VM Numerical Limits - TCP Connections- - To avoid outbound TCP limits, you can either increase the size of your workers, or scale out horizontally. apps across multiple app service plans to obtain additional compute levels (to isolate the issue further/shared more details on this in the ‘comment’ section below) 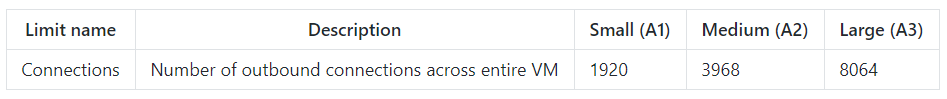
Review the logs to fetch more details on this issue:
@Matthew Evans , Adding more info:
Kindly checkout the documentation on step-step instructions - tutorial shows how to deploy a data-driven Python Django web app to Azure App Service
Information on Multiple Apps under a single App Service Plan(ASP):
When you create an app in App Service, it is put into an ASP. When the app runs, it runs on all the VM instances configured in the App Service plan. If multiple apps are in the same ASP, they all share the same VM instances. If you enable diagnostic logs, perform backups, or run WebJobs, deployment slots -they also use CPU cycles and memory on these VM instances.
Note: Linux is currently the recommended option for running Python apps in App Service and I believe you’re leveraging App Service Linux flavor.
Hope the above information helps! Kindly let us know we will be happy to assist you further.
Switched to hosting db on heroku, now my response time is lovely.
Thanks for the help everyone
@Matthew Evans , Thanks for follow-up. Appreciate you sharing the solution that worked for you, it would benefit users with a similar question.
Also, please do mark the post which was helpful by clicking on ‘Accept Answer’ & ‘Up-Vote’, to benefit the community find the right answers. Thanks again!

There is a small trick that you can follow to speed up for drf
Just remove the unwanted apps in INSTALLED_APPS and MIDDLEWARE
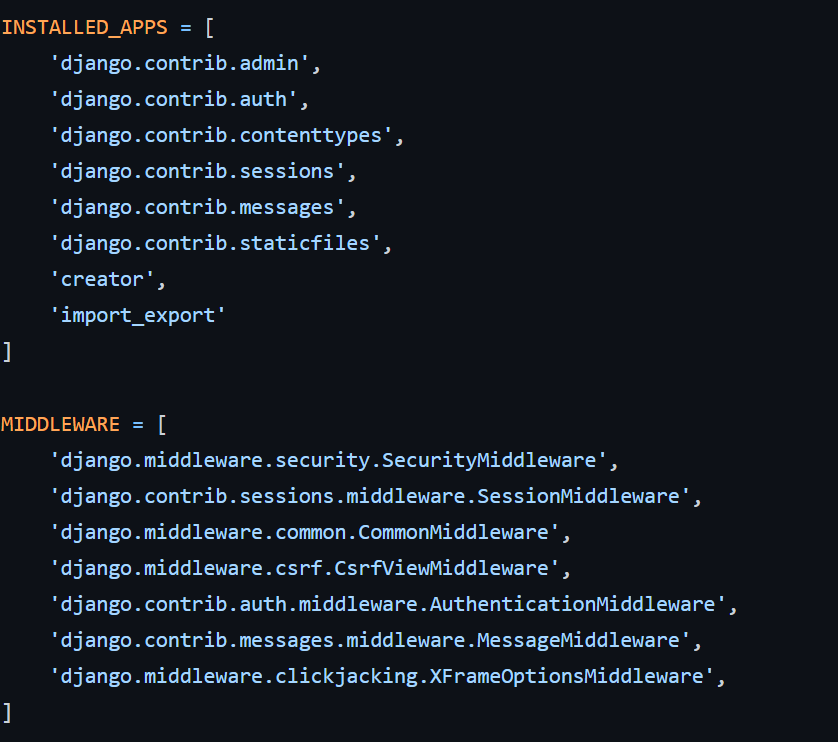
Like here you can see messages, csrf middle ware that are not needed in a web api so you can remove these things and boost your django rest framework performance