Azure App Service
Azure App Service is a service used to create and deploy scalable, mission-critical web apps.
6,875 questions
This browser is no longer supported.
Upgrade to Microsoft Edge to take advantage of the latest features, security updates, and technical support.
' cx='32' cy='32' r='32' /%3E%3Ctext x='50%25' y='55%25' dominant-baseline='middle' text-anchor='middle' fill='%23FFF' %3EGL%3C/text%3E%3C/svg%3E)
My site runs on the S1 service plan, which has 1.75 gigs of ram. I have only 1 app service, and the memory usage vs memory available does NOT add up to 1.75. About 400-500 meg are "missing", so I'm trying to understand where it went.
I've checked a number of sources for comparison:
1) App Service / Metrics, show "Average memory working set", which the max in the last 24 hours is ~800 meg.
2) This matches the total amount in the process explorer
3) However the "available memory" only shows ~350-400
I double checked the process explorer in Kudu and it matches what the Azure dashboard is reporting. I don't have ANY OTHER APPS running, so I'm at a loss how this memory is reported or where it's going
' cx='32' cy='32' r='32' /%3E%3Ctext x='50%25' y='55%25' dominant-baseline='middle' text-anchor='middle' fill='%23FFF' %3ESM%3C/text%3E%3C/svg%3E)
Thanks for asking question! If I have understood right you are using S1 Pricing Tier. This is the whole instance memory which you see at app service plan level. This includes all memory used by system processes + application's processes. And most of the time 50 % of memory might be consumed by the processes or services running for the operating system as that is just the base memory usage for processes running on the machine.
Process explorer of KUDU shows the process memory for that sandbox which does not include system processes.
So when you look only at app level, you see the memory consumed for that application.
Also, RAM – Often referred to as physical memory and This is fixed on an instance.
Refer to What is private bytes, virtual bytes, working set? for concepts are important to understand w.r.t memory.
Watch a quick video to understand different aspects shown in this view https://www.youtube.com/watch?v=lWeutt1GvRs
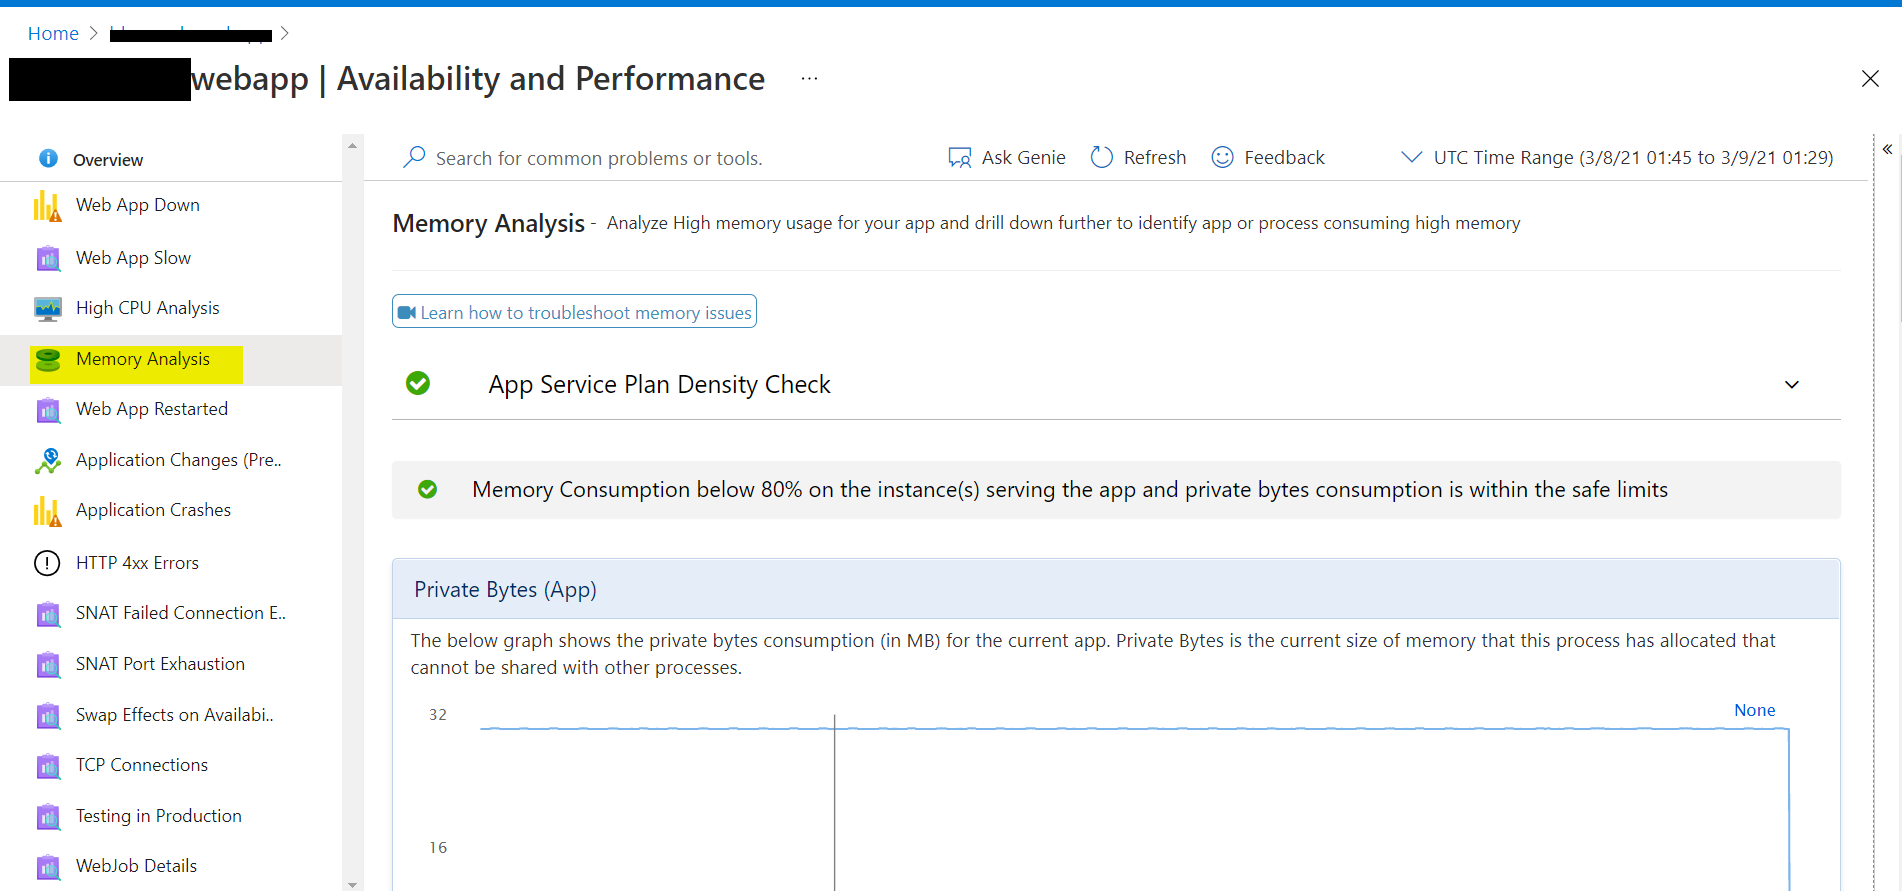
Under the Memory analysis tool:-
• The very first thing shown is App Service Plan Density – This checks looks for overstuffed App Service Plans and beeps if it finds that you have too many apps in the same app service plan
• An insight is shown if we detect or more apps consuming high memory
• Private Bytes consumption for the current app
• Physical memory in use for each instance allotted to the App Service Plan
• And then Memory Drill down shows Per instance memory drilldown for each app and its associated process running on that instance.
Hope this helps.
Is the Memory analysis going to show me how much the OS is using and is there any way to reduce that footprint?
Memory Analysis helps in measuring the memory consumption of all the Apps in the App service plan. Could you please send an email to AzCommunity[at]Microsoft[dot]com referencing this issue, we would like to work closer with you on this matter.
' cx='32' cy='32' r='32' /%3E%3Ctext x='50%25' y='55%25' dominant-baseline='middle' text-anchor='middle' fill='%23FFF' %3EMP%3C/text%3E%3C/svg%3E)
My app service plan have with zero apps but why it is showing 63% memory usage
Thanks for reaching here! Apologies you are facing issue here! Could you please open a new issue for better tracking and monitoring.