Hello, I have a simple question for which probably there will be many experts that can help me. And for that I would like to thank you in advance!
I have a set of values that looks like this:
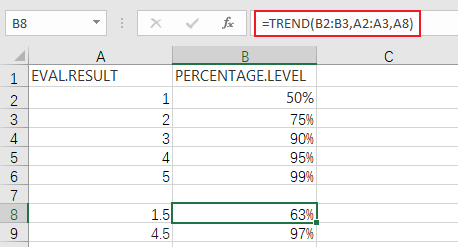
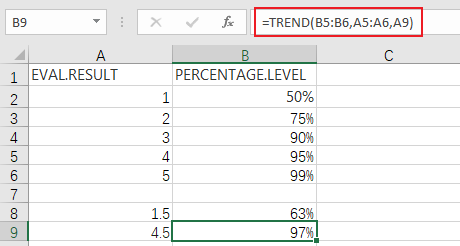
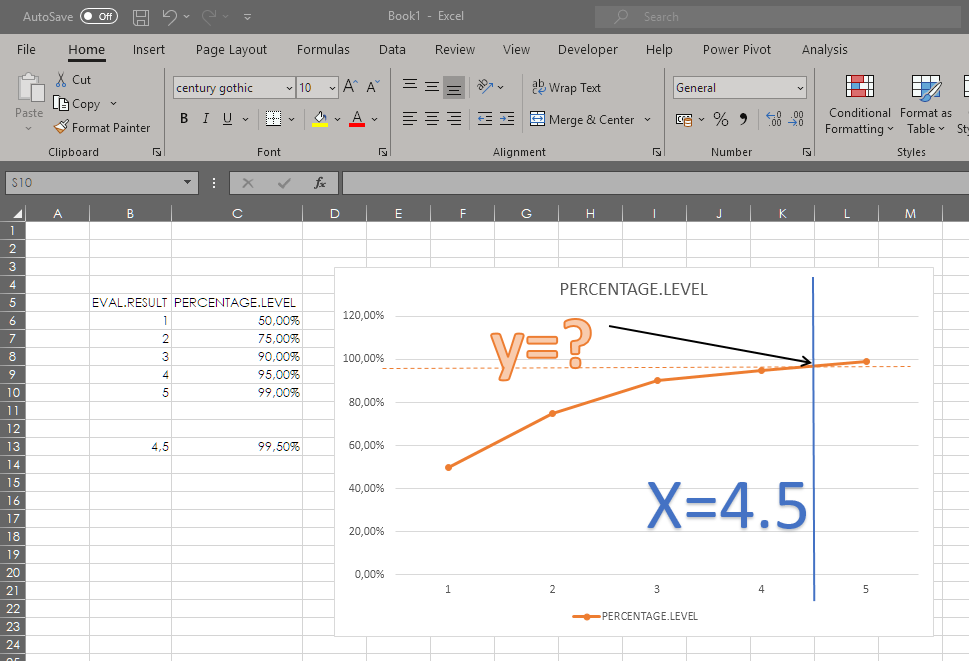
EVAL.RESULT | PERCENTAGE.LEVEL
1 | 50%
2 | 75%
3 | 90%
4 | 95%
5 | 99%
I want to know if the TREND function could help me to find the "Percentage.level" for a known EVAL.RESULT? To make myself more clear - if the known EVAL.RESULT is 1.5 then the PERCENTAGE.LEVEL should be in the middle of 50% and 75%. If the EVAL.RESULT will be 4.5 then the PERCENTAGE.LEVEL should be 97% (in the middle of 95% and 99% So, with trend it is creating a linear function based the entire set of data but for me is important to see if there is a function that will return the correct value on the line that the actual set of data is drawing. Thank you once again for your help
' cx='32' cy='32' r='32' /%3E%3Ctext x='50%25' y='55%25' dominant-baseline='middle' text-anchor='middle' fill='%23FFF' %3ELC%3C/text%3E%3C/svg%3E)

 ]
]