Azure Monitor
An Azure service that is used to collect, analyze, and act on telemetry data from Azure and on-premises environments.
2,815 questions
This browser is no longer supported.
Upgrade to Microsoft Edge to take advantage of the latest features, security updates, and technical support.
' cx='32' cy='32' r='32' /%3E%3Ctext x='50%25' y='55%25' dominant-baseline='middle' text-anchor='middle' fill='%23FFF' %3EPD%3C/text%3E%3C/svg%3E)
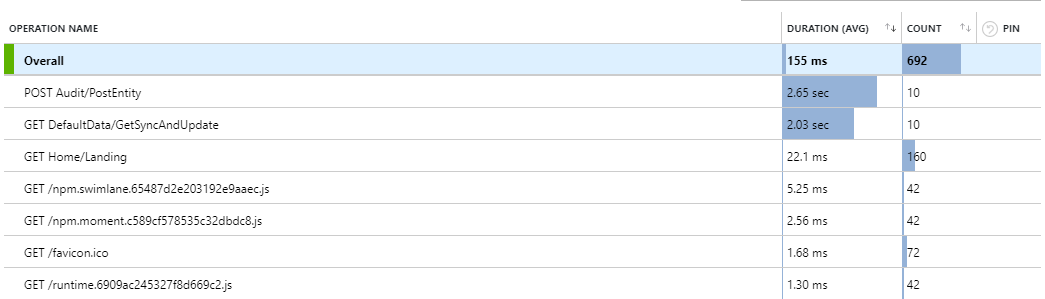
I am using app insights on my azure app service, and it shows me the following data. Is this telling me that in the first item there have been 10 requests with a total time of 2.65 seconds, or is it telling me there have been 10 requests of 2.65 seconds each?
Thanks

@Paul Davies Thanks for reaching out. Azure Application Insights, as an APM service, collects telemetry from your application to help analyze its operation and performance. It collects performance details for the different operations in your application (that you're seeing in the Performance blade). By identifying those operations with the longest duration, you can diagnose potential problems or identify improvements to the application that would most impact users.
The Performance blade shows the count and average duration of each operation for the application. In your case, it indicates that 10 hits of the POST Audit/PostEntity operation have taken 2.65 seconds each on an average. Similarly, there could be other operations that may have a higher duration but were rarely called, so the effect of their improvement would be minimal.
You can further drill down to find performance issues by switching to the 95th percentile and add the operations that you're interested in by pinning them to the graph.
Refer to this article to know more about finding and diagnosing performance issues with Azure Application Insights.
Hope this helps. Do let us know if you have further questions.
----------
If an answer is helpful, please "Accept answer" and/or "Up-Vote" which might help other community members reading this thread.
Thanks for your response but it's still not clear.
Is this 10 requests with a total time of 2.65 seconds
OR
Is this10 requests with a total time of 26.5 seconds
Thanks
@Paul Davies Apologies if my response wasn't clear earlier. To answer your question, if the visual indicates 10 requests taking 2.65 seconds duration on an average, it does imply that the total time for the 10 requests is 26.5 seconds.
Taking another similar example:
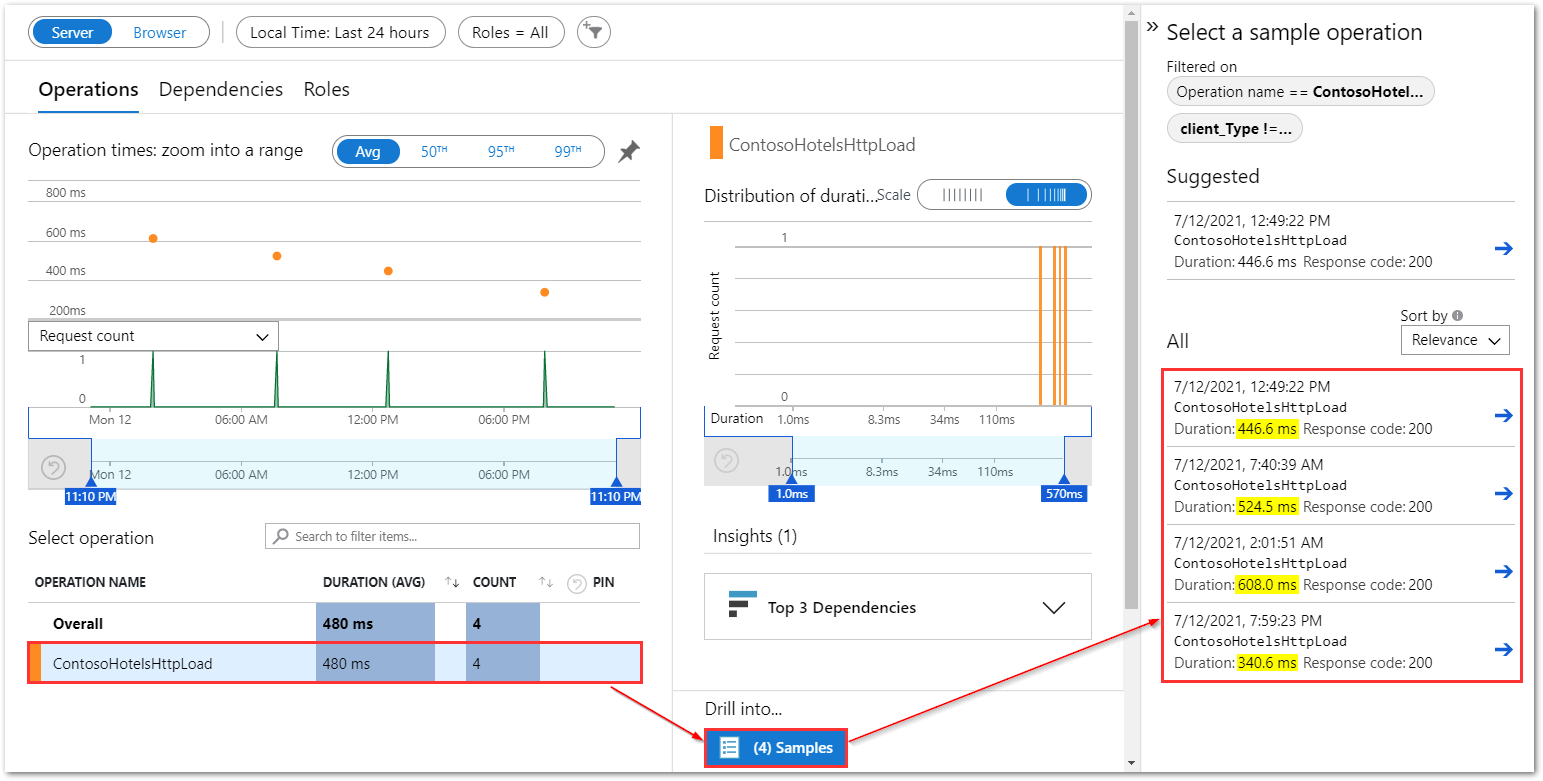
In the screenshot above, you'll see that there were 4 requests of type ContosoHotelsHttpLoad, with individual durations 446.6 ms, 524.5 ms, 608 ms, and 340.6 ms.
This implies that the total duration for 4 requests was 1919.7 ms, leading to an average duration for each request as around 480 ms.
Hope this clarifies.