Azure Monitor
An Azure service that is used to collect, analyze, and act on telemetry data from Azure and on-premises environments.
2,812 questions
This browser is no longer supported.
Upgrade to Microsoft Edge to take advantage of the latest features, security updates, and technical support.
' cx='32' cy='32' r='32' /%3E%3Ctext x='50%25' y='55%25' dominant-baseline='middle' text-anchor='middle' fill='%23FFF' %3EMB%3C/text%3E%3C/svg%3E)
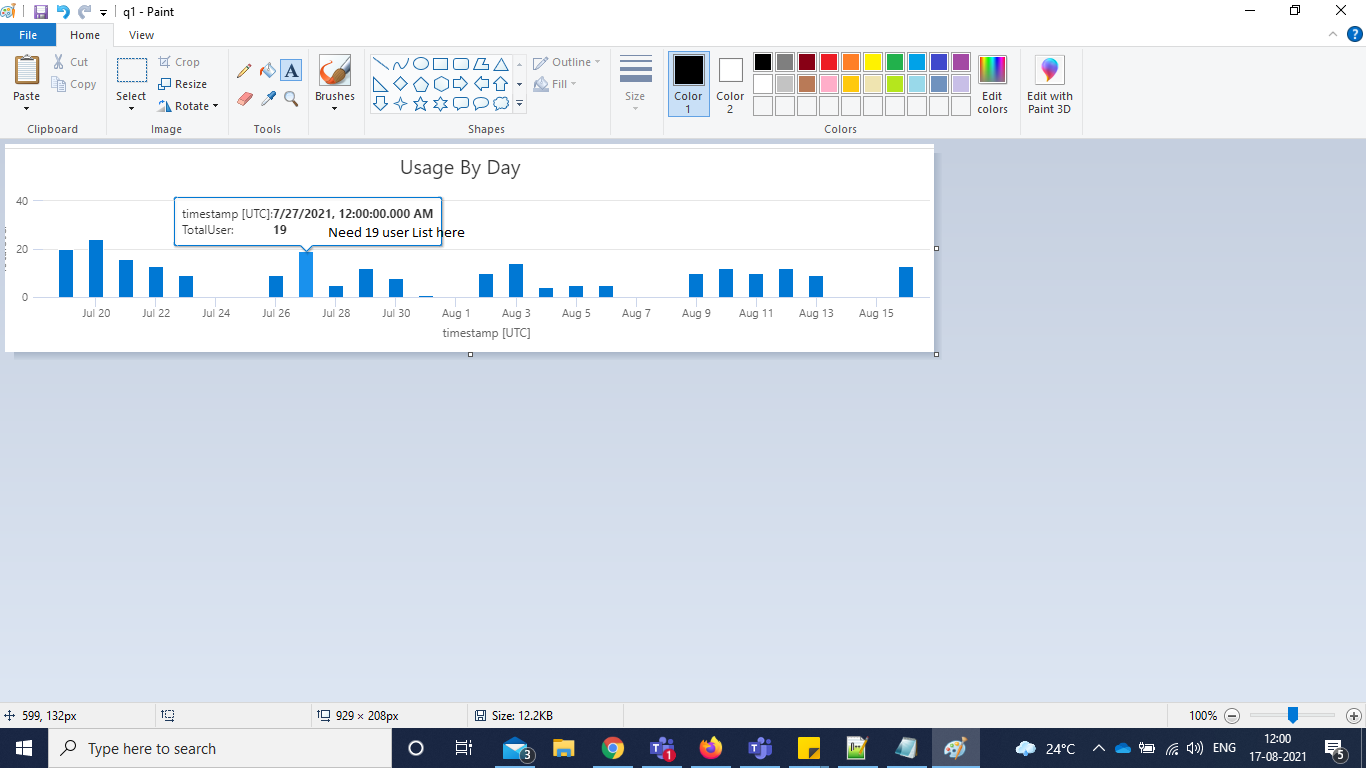
let T1 = Data
| where user_AuthenticatedId contains "retail"
| summarize by session_Id;
T1
|join kind=inner
Data on session_Id
| where user_AuthenticatedId contains "retail"
| where timestamp between (startofweek((timestamp)).. now())
| where dayofweek(timestamp) between (1d .. 6d)
| summarize TotalUser = dcount(user_AuthenticatedId) by bin(timestamp,1d)
|order by timestamp desc
| render columnchart title = "Usage By Day"
Is there any one? please help me

@Manoj Bobade Thanks for reaching out. I'm checking on this with our internal teams and will let you know as I hear more.
Okay Thanks in advance
@Manoj Bobade Thanks for reaching out. As per our Product group, customizing tooltips for visuals/charts rendered from Kusto queries is not supported out of the box as of today. However, this is in our backlog as there have been similar requests from other customers in the past.
While there aren't any timelines we can share on the ETA at this point, please watch out for any new announcements/updates on Azure Updates/Azure Blog.
Hope this helps. Do let us know if you have further questions.
----------
If an answer is helpful, please "Accept answer" and/or "Up-Vote" which might help other community members reading this thread.