Azure SQL Database
An Azure relational database service.
5,151 questions
This browser is no longer supported.
Upgrade to Microsoft Edge to take advantage of the latest features, security updates, and technical support.
' cx='32' cy='32' r='32' /%3E%3Ctext x='50%25' y='55%25' dominant-baseline='middle' text-anchor='middle' fill='%23FFF' %3EP%3C/text%3E%3C/svg%3E)
I'm using Gen5 General Purpose Azure SQL Managed Instance with 4 vcores / 20.4GB memory. Today an application that uses this database had a very high workload and put the DB instance under heavy usage. I was monitoring the resource of this SQL MI instance and was able to see only %CPU but no memory usage was shown anywhere.
I googled and found nothing related to this. Is it possible to know how high the memory usage is at the moment?, and it would be great if we can see historical data like in the "Metrics" feature under "Monitoring" section.
One article I found from Google was this blog post but it only tells the allocated memory, not actual usage and I don't understand it very clearly. Does the "TotalAvailableMemoryGB" means the amount of memory that SQL Server will be able to use, and "NonSOSMemGapGB" means the reserved memory which cannot be used by SQL Server?
Thanks.

Please try the following query:
SELECT cpu_count,
physical_memory_kb,
committed_target_kb
FROM sys.dm_os_sys_info;
Hope this helps.
Hello @Alberto Morillo ,
Thank you for your answer but I'm not really sure if it is accurate. Because according to the blog post I referred to in my question, the sys.dm_os_sys_info was mentioned as well and it says it is irrelevant for Azure SQL Managed Instance. Quote:
For Azure SQL Managed Instance, none of the habitual old DMVs such as sys.dm_os_process_memory or sys.dm_os_sys_info will provide correct answer, because they were not updated to adjust to the reality of the complex Azure SQL implementations.
I ran the SQL statement you provided and converted KB to GB and the converted values do not seem to match the TotalAvailableMemoryGB provided by the SQL statement in the blog post.
Is there any other ways to see memory usage?
Honestly, it does not make sense to measure memory consumption as it will be very close to 100% by design as explained on this article. The article instead presents performance counters that we need to monitor to identify when more memory is needed for Azure Managed Instance.

Hi @Pitawat Thank you for posting your question on Microsoft Q&A. Thank you @Alberto Morillo for your contribution on Microsoft Q&A forum.
According to this Blog written by the SQL MI product Group.
For Azure SQL Managed Instance, none of the habitual old DMVs such as sys.dm_os_process_memory or sys.dm_os_sys_info will provide correct answer, because they were not updated to adjust to the reality of the complex Azure SQL implementations.
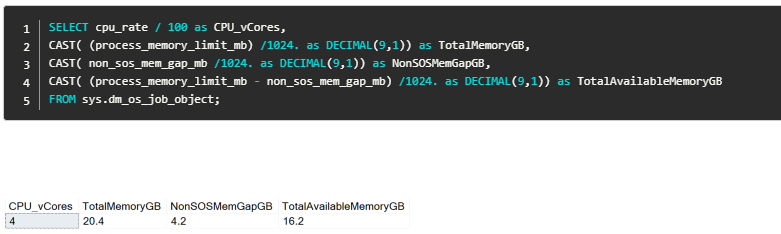
In order to get the correct information the Job Object, the DMV sys.dm_os_job_object will need to be used.
Job Object is a grouping of processes that need to be managed as a single unit with an explicit resource governance for CPU, memory and IO for the processes.
To observe the total amount of memory attributed to your Azure SQL MI, use the following query by consulting the column [process_memory_limit_mb], meaning that for example, for my 4 CPU vCores Azure SQL Managed Instance I expect to get 20.4 GB of RAM:
SELECT cpu_rate / 100 as CPU_vCores,
CAST( (process_memory_limit_mb) /1024. as DECIMAL(9,1)) as TotalMemoryGB
FROM sys.dm_os_job_object;
Please feel free to reach out if you have additional questions.
Regards,
Oury
Hi @Pitawat Checking if the above answer was helpful. If yes, Please mark as accepted answer. Otherwise let us know how we can better assist you.
Regards,
Oury
Hi @Pitawat Checking if the above answer was helpful. If yes, Please mark as accepted answer. Otherwise let us know how we can better assist you.
Regards,
Oury
@Pitawat
In addition to the above answer, you can also use this DMV below to get the memory usage.
SELECT [type] AS [ClerkType], SUM(pages_kb) / 1024 AS [SizeMb]
FROM sys.dm_os_memory_clerks WITH (NOLOCK)
GROUP BY [type]
ORDER BY SUM(pages_kb) DESC
For CPU usage please go through this Monitoring and performance tuning- Azure SQL Database | Microsoft Learn
Regards,
Oury