Average by categoies in Power Pivot

Bruce Bachtell 1 Reputation point
2021-10-03T16:55:01.467+00:00

Hi all,

I am new to DAX and need a bit of a hand. I am trying to calculate an average by categories that are survey questions. I have constructed a measure that correctly computes the average by question. When I add the facility to the Power Pivot table I get average by facility which is the same as their raw score. So, if the facility scored a 5 on the first question, the average is displayed as 5 rather than the average for that question. I understand why because the row context has changed. I have tried a number of variations to get the question average to display on each facility row to no avail. Here is the measure definition:

=DIVIDE(SUM('Table'[Score]),COUNTA('Table'[Measure Code]))

I have examples of the desired result when just the questions are displayed and the undesired result when the facility is displayed.. I tired to attach then to this message, but ended up with static text rather than137145-attachment-1.png137174-attachment-2.png 
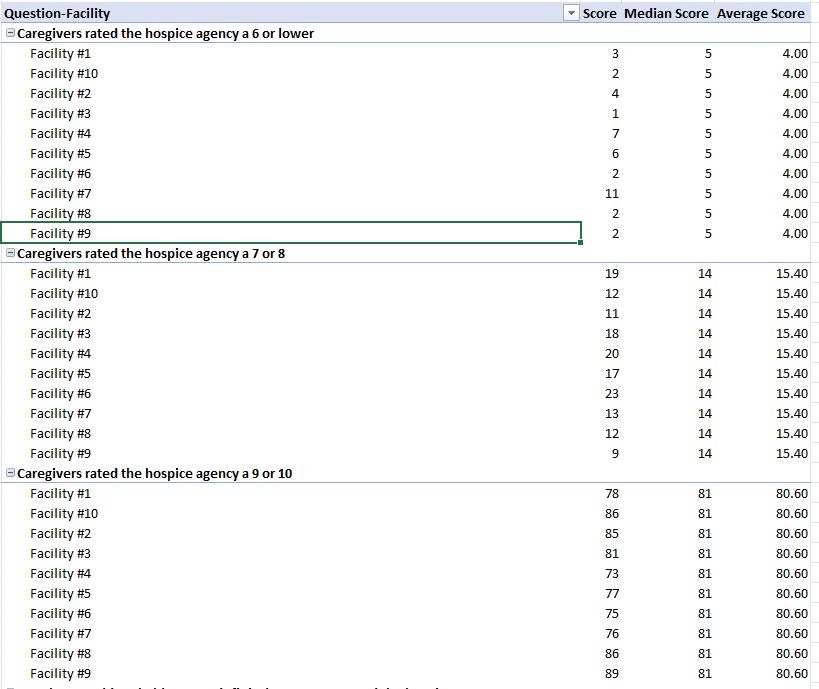
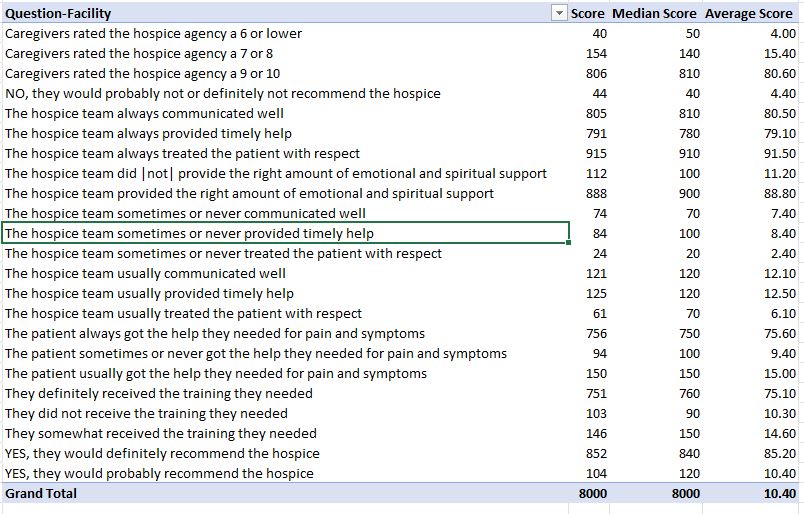
the image. If you need them, I can send them to you.

Thanks for nay help.

Bruce

Excel Management
Excel Management
Excel: A family of Microsoft spreadsheet software with tools for analyzing, charting, and communicating data.Management: The act or process of organizing, handling, directing or controlling something.
1,645 questions
{count} votes

2 answers

Sort by: Most helpful
  1. Bruce Bachtell 1 Reputation point
    2021-10-05T13:14:12.997+00:00

    Hi,

    The images in the original post illustrated a small sample of the data. There are 23 questions in one table and about 68,000 facility rows in a separate table.

    All data is from a national survey on the CMS web site.

    I have attached a small sample of sanitized data. Hope it helps.

    Bruce137716-questionfacility.jpg137772-questiononly.jpg

    0 comments No comments

  2. Emily Hua-MSFT 27,526 Reputation points
    2021-10-19T09:21:48.29+00:00

    @BruceBachtell-0307

    Sorry for the delay.

    Could you please provide the result you want based on your sample to help me understand your issue better?

    Currently, I would suggest you use Isinscope function, which could hlep us get percentage calculated by level.
    Such as: IF(ISINSCOPE(facility),DIVIDE(SUM('Table'[Score]),CALCULATE(COUNTA('Table'[Measure Code]),fILTER(table,[question]=max([question]))))


    If the answer is helpful, please click "Accept Answer" and kindly upvote it. If you have extra questions about this answer, please click "Comment".
    Note: Please follow the steps in our documentation to enable e-mail notifications if you want to receive the related email notification for this thread.


    0 comments No comments