Use the Debugger control in Unified Service Desk
To use debugger control in one of your sample Unified Service Desk applications, start the Unified Service Desk client, click the down arrow next to Settings, and then click Debug. You can also configure a debugger control if you are configuring Unified Service Desk from scratch. More information: Walkthrough 6: Configure the Debugger hosted control in your agent application
The debugger control provides information under these tabs: Action Calls, Debug Output, and Data Parameters. Additionally, debugger also lets you test the existing action calls and UII actions available in the system.
Action Calls tab
The first tab in the debugger is Action Calls. Action calls are the primary mechanisms by which things occur in Unified Service Desk. Tracking the progress of these, as well as the values used in your replacement parameters, can give you valuable information about your hosted controls.
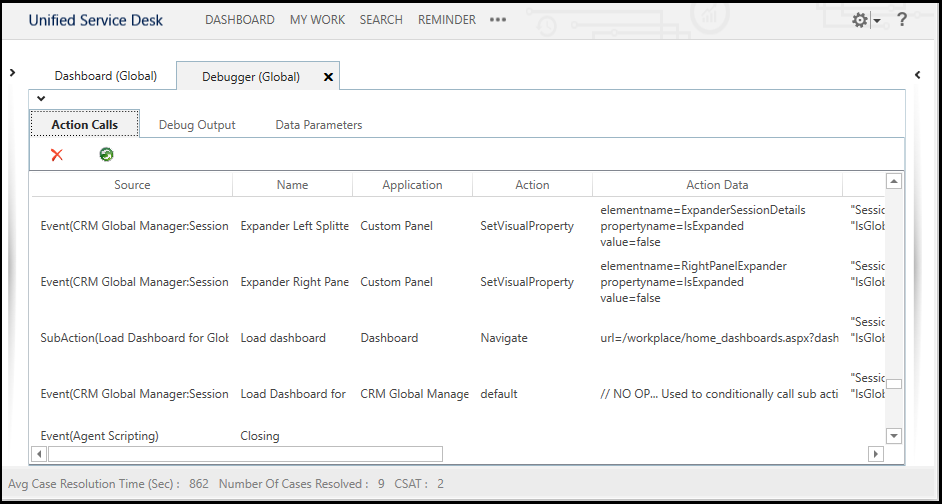
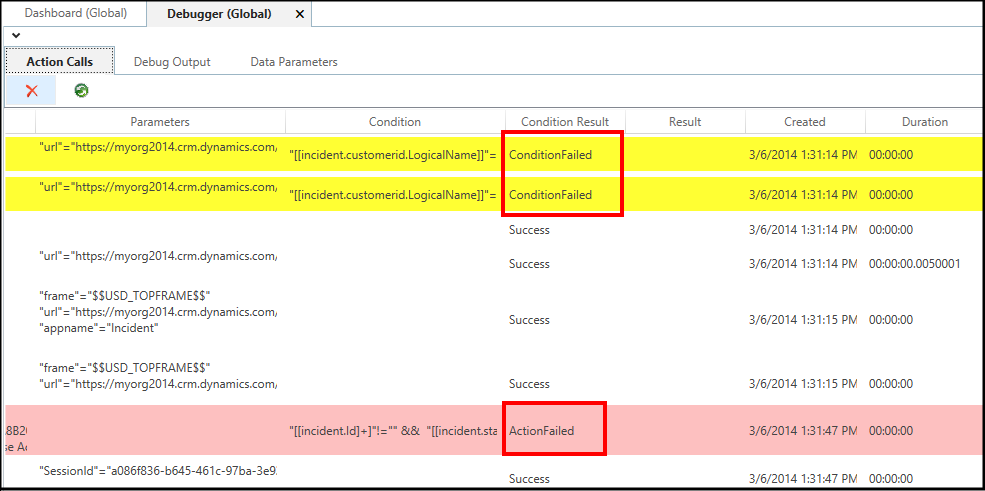
The following color highlights are used for the records in the Action Calls tab:
Yellow indicates an action call didn’t run because a condition failed.
Red indicates the condition succeeded but the action failed, either due to an exception or because required parameters in the data weren’t replaceable.
Right-click on a row or multiple rows in the Action Calls tab, and select Copy Data To Clipboard from the shortcut menu to copy action call data and then paste it in another application (say Microsoft Word or Notepad) to easily review the data or share the copied data with others using email for troubleshooting.
You can also refresh the Unified Service Desk client to use the latest configuration changes on the server without having to manually restart it by clicking the refresh icon (
 ). On clicking this icon, you are prompted whether to reload the configuration. Click Yes to reload the configuration or click No to cancel.
Debug Output tab
This tab displays a trace listener. If you attached a code debugger to the application, this is the output you would see. It also displays text that will be written to a log file.
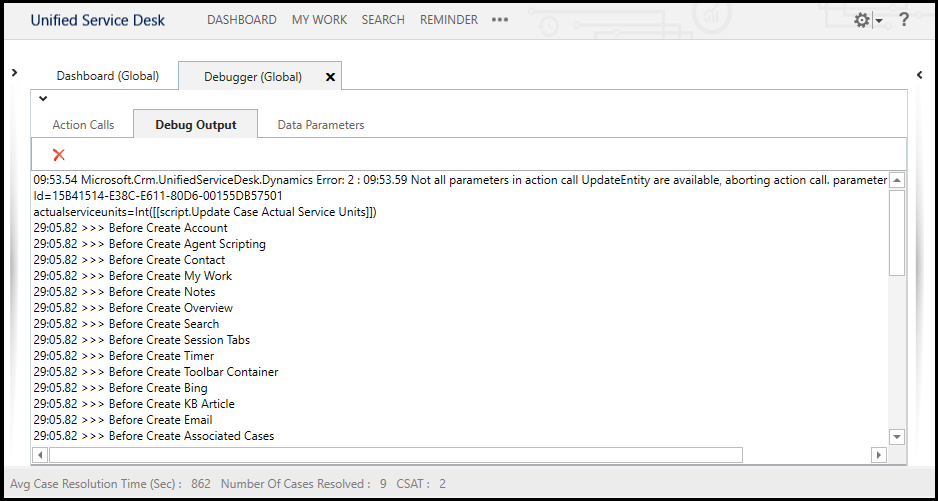
Data Parameters tab
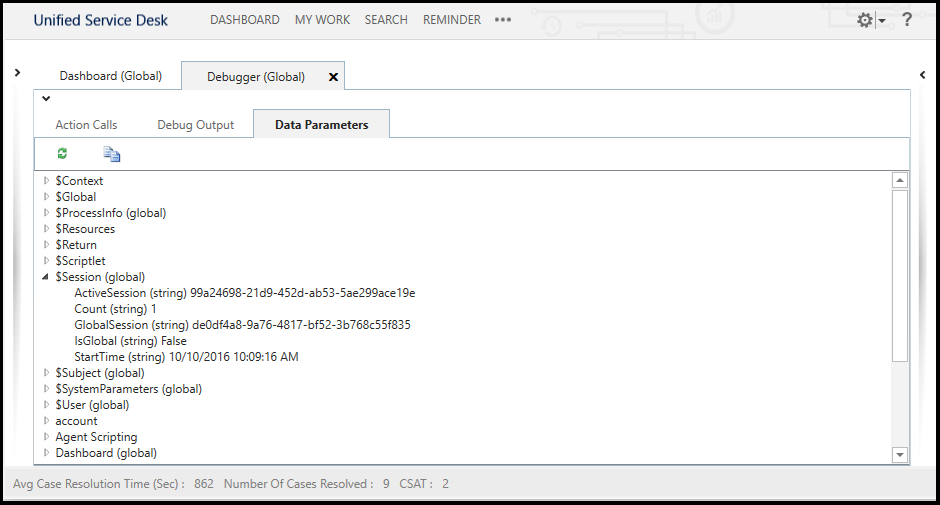
This tab displays data parameters that are captured during the execution of the application. The list of available values will change frequently as data is discovered from various ways while the application is used. These data parameters may be used when calling actions, for display, or other purposes in the application by using replacement parameters. System data parameters typically start with “$,” such as “$Global" to help separate them from general data parameters. For more information, see: Replacement parameters.
You can refresh data parameters by clicking the Update data parameters button. You can also copy the data parameters to your clipboard.
Test your action calls and UII actions
The debugger also lets you test the existing action calls and UII actions using different conditions and replacement parameters to experiment and view results however you need. To display the area where you can test action calls and UII actions, click the down arrow above the Action Calls tab.
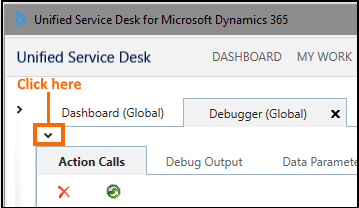
In the Action Calls tab, select an action call from the drop-down list, and then click the Run Action Call button
 to view the results of the action call. For more information about testing an action call, see the Test the action call for customizing your display section in the topic for customizing a theme.
In the Direct Action tab, you can directly call UII actions on hosted controls in the system. This is a great way to test action call configuration before creating an action call for the UII action. Replacement parameters can be used in the Data field while testing UII actions. If you have the required permissions, you can also create hosted controls and UII actions by clicking the Add buttons next to the respective drop-down lists. This opens the New Hosted Control or New UII Action page in Internet Explorer based on what you chose to create. For more information about testing a UII action, see the Run the Unified Service Desk client to work with custom hosted control section in the topic for creating a custom Unified Service Desk hosted control.
See also
Walkthrough 6: Configure the Debugger hosted control in your agent application
Debug your custom code for Unified Service Desk
الملاحظات
قريباً: خلال عام 2024، سنتخلص تدريجياً من مشكلات GitHub كآلية ملاحظات للمحتوى واستبداله بنظام ملاحظات جديد. لمزيد من المعلومات، انظر: https://aka.ms/ContentUserFeedback.
إرسال الملاحظات وعرضها المتعلقة بـ