Wire Data 2.0 (Preview) solution in Azure Monitor (Retired)

Note
The Wire Data solution has been replaced with VM insights and Service Map solution. Both use the Log Analytics agent and Dependency agent to collect network connection data into Azure Monitor.
Support for Wire Data solution will end on March 31, 2022. Until the retirement date, existing customers using the Wire Data 2.0 (preview) solution may continue to use it.
New and existing customers should install the VM insights or Service Map solution. The Map data set they collect is comparable to the Wire Data 2.0 (preview) data set. VM insights includes the Service Map data set along with additional performance data and features for analysis. Both offerings have connections with Microsoft Sentinel.
Wire data is consolidated network and performance data collected from Windows-connected and Linux-connected computers with the Log Analytics agent, including those monitored by Operations Manager in your environment. Network data is combined with your other log data to help you correlate data.
In addition to the Log Analytics agent, the Wire Data solution uses Microsoft Dependency Agents that you install on computers in your IT infrastructure. Dependency Agents monitor network data sent to and from your computers for network levels 2-3 in the OSI model, including the various protocols and ports used. Data is then sent to Azure Monitor using agents.
Migrate to Azure Monitor VM insights or Service Map
In many cases, we see that customers often have both Wire Data 2.0 (preview) and VM insights or Service Map solution already enabled on the same VMs. This means you have the replacement offering enabled on your VM. You can simply remove the Wire Data 2.0 (preview) solution from your Log Analytics workspace.
If you have VMs that only have Wire Data 2.0 (preview) enabled on them, then you can onboard the VMs to VM insights or Service Map solution and then remove the Wire Data 2.0 (preview) solution from your Log Analytics workspace.
Migrate your queries to the VMConnection table from Azure Monitor VM insights
Agents providing data
Wire Data 2.0 query
WireData
| summarize AggregatedValue = sum(TotalBytes) by Computer
| limit 500000
VM insights and Service Map query
VMConnection
| summarize AggregatedValue = sum(BytesReceived + BytesSent) by Computer
| limit 500000
IP Addresses of the agents providing data
Wire Data 2.0 query
WireData
| summarize AggregatedValue = count() by LocalIP
VM insights and Service Map query
VMComputer
| distinct Computer, tostring(Ipv4Addresses)
All Outbound communications by Remote IP Address
Wire Data 2.0 query
WireData
| where Direction == "Outbound"
| summarize AggregatedValue = count() by RemoteIP
VM insights and Service Map query
VMConnection
| where Direction == "outbound"
| summarize AggregatedValue = count() by RemoteIp
Bytes received by Protocol Name
Wire Data 2.0 query
WireData
| where Direction == "Inbound"
| summarize AggregatedValue = sum(ReceivedBytes) by ProtocolName
VM insights and Service Map query
VMConnection
| where Direction == "inbound"
| summarize AggregatedValue = sum(BytesReceived) by Protocol
Amount of Network Traffic (in Bytes) by Process
Wire Data 2.0 query
WireData
| summarize AggregatedValue = sum(TotalBytes) by ProcessName
VM insights and Service Map query
VMConnection
| summarize sum(BytesReceived), sum(BytesSent) by ProcessName
More examples queries
Refer to the VM insights log search documentation and the VM insights alert documentation for additional example queries.
Uninstall Wire Data 2.0 Solution
To uninstall Wire Data 2.0 you simply need to remove the Solution from your Log Analytics Workspace(s). This will result in the following:
- The Wire Data Management pack being removed from the VMs that are connected to the Workspace.
- The Wire Data data type no longer appearing in your Workspace
Follow these instructions to remove the Wire Data solution.
Note
If you have either the Service Map or VM insights solution on your workspace then the management pack will not be removed, as these solutions also use this management pack.
Wire Data 2.0 Management packs
When Wire Data is activated in a Log Analytics workspace, a 300-KB management pack is sent to all the Windows servers in that workspace. If you are using System Center Operations Manager agents in a connected management group, the Dependency Monitor management pack is deployed from System Center Operations Manager. If the agents are directly connected, Azure Monitor delivers the management pack.
The management pack is named Microsoft.IntelligencePacks.ApplicationDependencyMonitor. It's written to: %Programfiles%\Microsoft Monitoring Agent\Agent\Health Service State\Management Packs. The data source that the management pack uses is: %Program files%\Microsoft Monitoring Agent\Agent\Health Service State\Resources<AutoGeneratedID>\Microsoft.EnterpriseManagement.Advisor.ApplicationDependencyMonitorDataSource.dll.
Uninstall the Dependency agent
Note
If you plan to replace Wire Data with either Service Map or VM insights, you should not remove the Dependency agent.
Use the following sections to help you remove the Dependency agent.
Uninstall the Dependency agent on Windows
An administrator can uninstall the Dependency agent for Windows through Control Panel.
An administrator can also run %Programfiles%\Microsoft Dependency Agent\Uninstall.exe to uninstall the Dependency agent.
Uninstall the Dependency agent on Linux
To completely uninstall the Dependency agent from Linux, you must remove the agent itself and the connector, which is installed automatically with the agent. You can uninstall both by using the following single command:
rpm -e dependency-agent dependency-agent-connector
Using the Wire Data 2.0 solution
In the Overview page for your Log Analytics workspace in the Azure portal, click the Wire Data 2.0 tile to open the Wire Data dashboard. The dashboard includes the sections in the following table. Each section lists up to 10 items matching that section's criteria for the specified scope and time range. You can run a log search that returns all records by clicking See all at the bottom of the section or by clicking the section header.
| Section | Description |
|---|---|
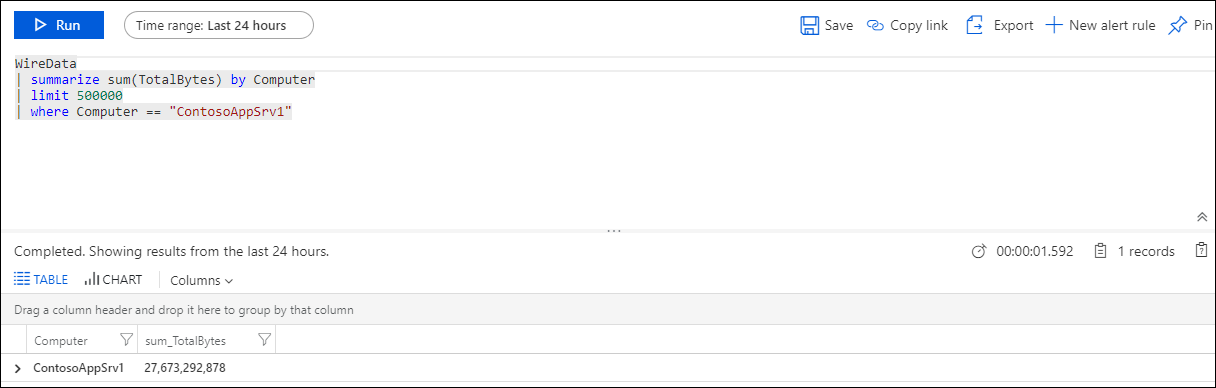
| Agents capturing network traffic | Shows the number of agents that are capturing network traffic and lists the top 10 computers that are capturing traffic. Click the number to run a log search for WireData | summarize sum(TotalBytes) by Computer | take 500000. Click a computer in the list to run a log search returning the total number of bytes captured. |
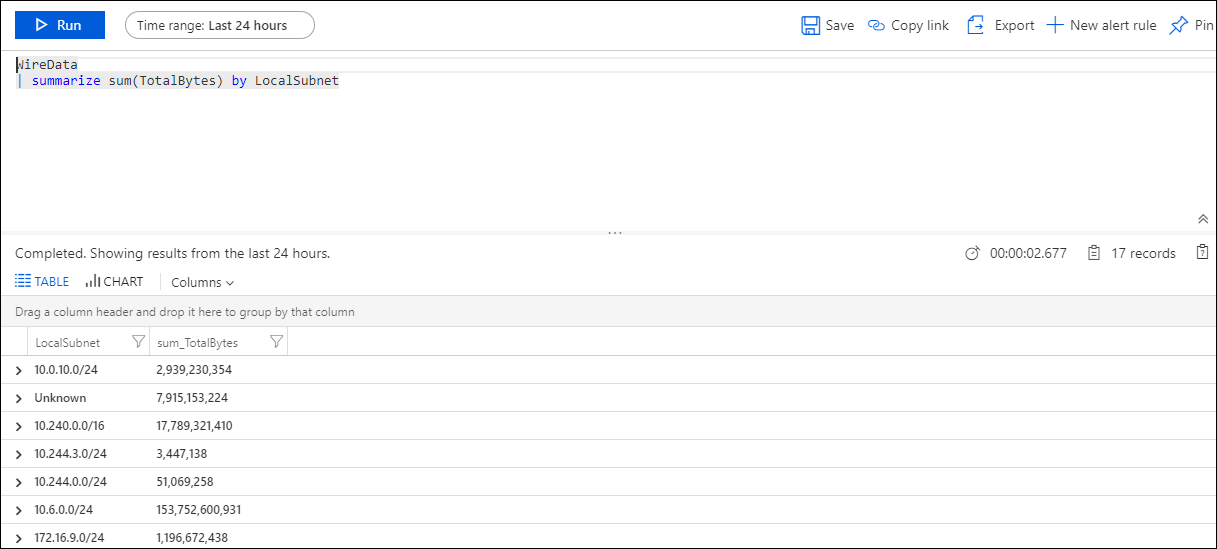
| Local Subnets | Shows the number of local subnets that agents have discovered. Click the number to run a log search for WireData | summarize sum(TotalBytes) by LocalSubnet that lists all subnets with the number of bytes sent over each one. Click a subnet in the list to run a log search returning the total number of bytes sent over the subnet. |
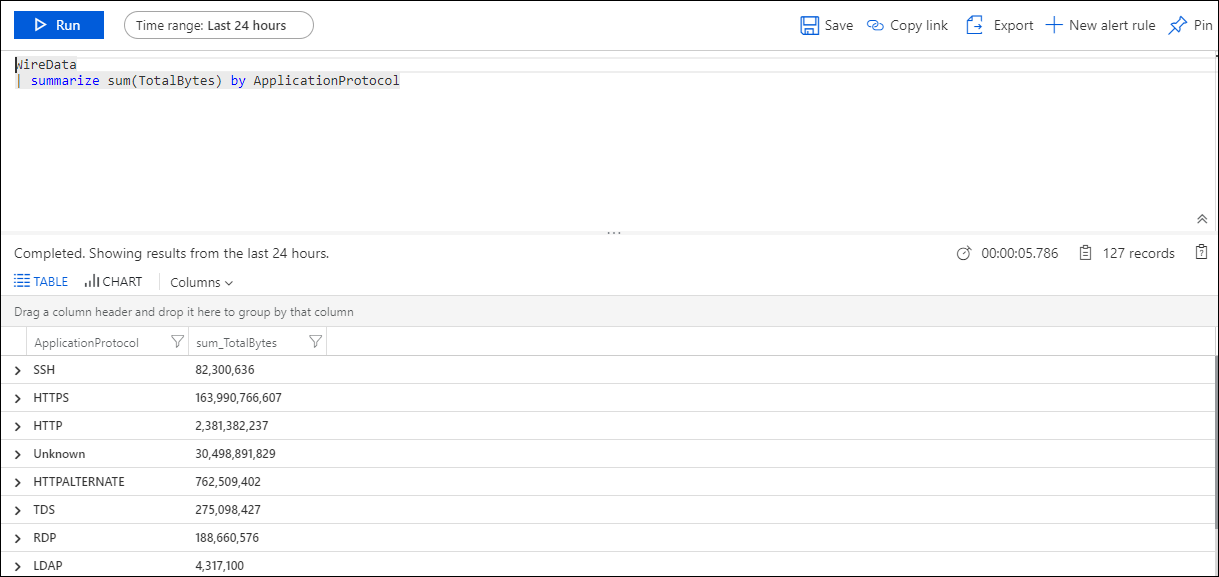
| Application-level Protocols | Shows the number of application-level protocols in use, as discovered by agents. Click the number to run a log search for WireData | summarize sum(TotalBytes) by ApplicationProtocol. Click a protocol to run a log search returning the total number of bytes sent using the protocol. |
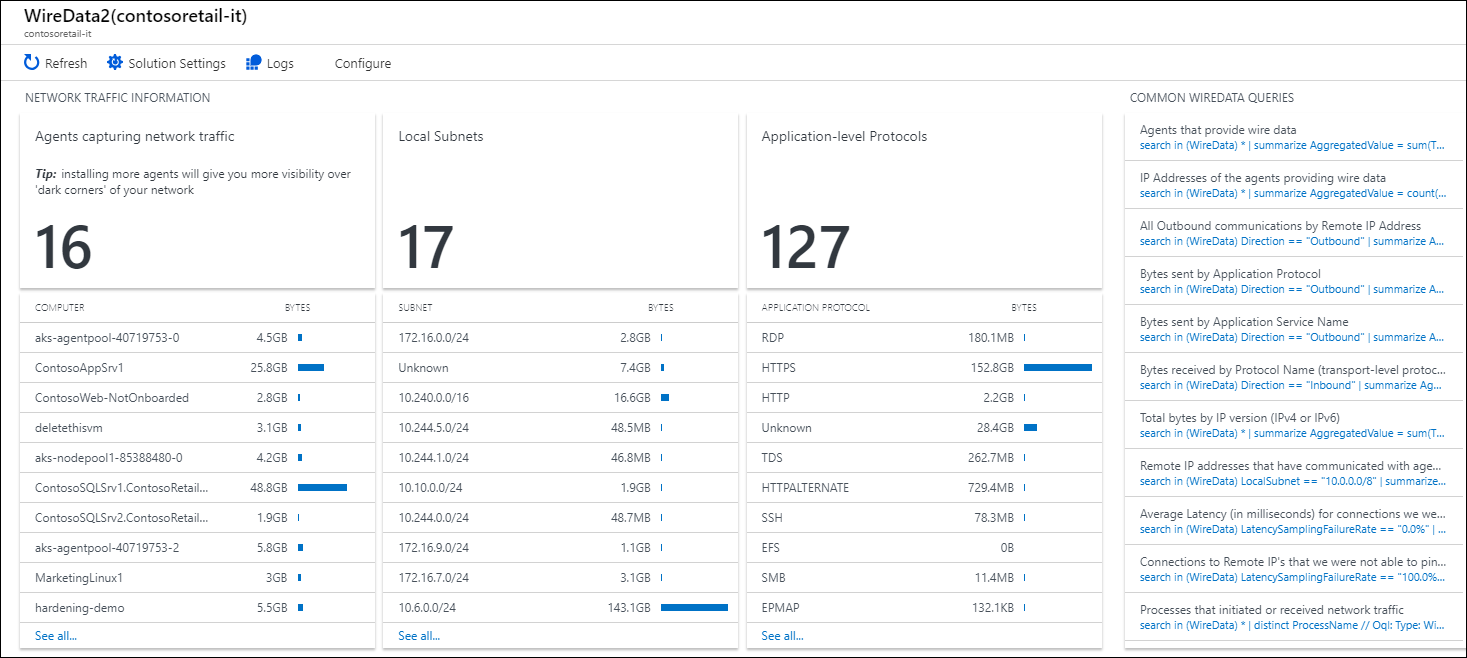
You can use the Agents capturing network traffic section to determine how much network bandwidth is being consumed by computers. This section can help you easily find the chattiest computer in your environment. Such computers could be overloaded, acting abnormally, or using more network resources than normal.
Similarly, you can use the Local Subnets section to determine how much network traffic is moving through your subnets. Users often define subnets around critical areas for their applications. This section offers a view into those areas.
The Application-level Protocols section is useful because it's helpful know what protocols are in use. For example, you might expect SSH to not be in use in your network environment. Viewing information available in the section can quickly confirm or disprove your expectation.
It's also useful to know if protocol traffic is increasing or decreasing over time. For example, if the amount of data being transmitted by an application is increasing, that might be something you should be aware of, or that you might find noteworthy.
Input data
Wire data collects metadata about network traffic using the agents that you have enabled. Each agent sends data about every 15 seconds.
Output data
A record with a type of WireData is created for each type of input data. WireData records have properties shown in the following table:
| Property | Description |
|---|---|
| Computer | Computer name where data was collected |
| TimeGenerated | Time of the record |
| LocalIP | IP address of the local computer |
| SessionState | Connected or disconnected |
| ReceivedBytes | Amount of bytes received |
| ProtocolName | Name of the network protocol used |
| IPVersion | IP version |
| Direction | Inbound or outbound |
| MaliciousIP | IP address of a known malicious source |
| Severity | Suspected malware severity |
| RemoteIPCountry | Country/region of the remote IP address |
| ManagementGroupName | Name of the Operations Manager management group |
| SourceSystem | Source where data was collected |
| SessionStartTime | Start time of session |
| SessionEndTime | End time of session |
| LocalSubnet | Subnet where data was collected |
| LocalPortNumber | Local port number |
| RemoteIP | Remote IP address used by the remote computer |
| RemotePortNumber | Port number used by the remote IP address |
| SessionID | A unique value that identifies communication session between two IP addresses |
| SentBytes | Number of bytes sent |
| TotalBytes | Total number of bytes sent during session |
| ApplicationProtocol | Type of network protocol used |
| ProcessID | Windows process ID |
| ProcessName | Path and file name of the process |
| RemoteIPLongitude | IP longitude value |
| RemoteIPLatitude | IP latitude value |
Next steps
- See Deploy VM insights for requirements and methods that to enable monitoring for your virtual machines.
- Search logs to view detailed wire data search records.