Create or edit an Azure Workbook
This article describes how to create a new workbook and how to add elements to your Azure Workbook.
This video walks you through creating workbooks.
Create a new Azure Workbook
To create a new Azure workbook:
- From the Azure Workbooks page, select an empty template or select New in the top toolbar.
- Combine any of these elements to add to your workbook:
- Text
- Parameters
- Queries
- Metric charts
- Links
- Groups
- Configuration options
Add text
Workbooks allow authors to include text blocks in their workbooks. The text can be human analysis of the data, information to help users interpret the data, section headings, etc.

Text is added through a markdown control into which an author can add their content. An author can use the full formatting capabilities of markdown. These include different heading and font styles, hyperlinks, tables, etc. Markdown allows authors to create rich Word- or Portal-like reports or analytic narratives. Text can contain parameter values in the markdown text, and those parameter references are updated as the parameters change.
Edit mode:

Preview mode:

To add text to an Azure workbook:
Make sure you are in Edit mode by selecting the Edit in the toolbar. Add a query by doing either of these steps:
- Select Add, and Add text below an existing element, or at the bottom of the workbook.
- Select the ellipses (...) to the right of the Edit button next to one of the elements in the workbook, then select Add and then Add text.
Enter markdown text into the editor field.
Use the Text Style option to switch between plain markdown, and markdown wrapped with the Azure portal's standard info/warning/success/error styling.
Tip
Use this markdown cheat sheet to see the different formatting options.
Use the Preview tab to see how your content looks. The preview shows the content inside a scrollable area to limit its size, but when displayed at runtime, the markdown content expands to fill whatever space it needs, without a scrollbar.
Select Done Editing.
Text styles
These text styles are available:
| Style | Description |
|---|---|
| plain | No formatting is applied |
| info | The portal's "info" style, with a ℹ or similar icon and blue background |
| error | The portal's "error" style, with a ❌ or similar icon and red background |
| success | The portal's "success" style, with a ✔ or similar icon and green background |
| upsell | The portal's "upsell" style, with a 🚀 or similar icon and purple background |
| warning | The portal's "warning" style, with a ⚠ or similar icon and blue background |
You can also choose a text parameter as the source of the style. The parameter value must be one of the above text values. The absence of a value, or any unrecognized value will be treated as plain style.
Text style examples
Info style example:
Warning style example:

Add queries
Azure Workbooks allow you to query any of the supported workbook data sources.
For example, you can query Azure Resource Health to help you view any service problems affecting your resources. You can also query Azure Monitor metrics, which is numeric data collected at regular intervals. Azure Monitor metrics provide information about an aspect of a system at a particular time.
To add a query to an Azure Workbook:
- Make sure you are in Edit mode by selecting the Edit in the toolbar. Add a query by doing either of these steps:
- Select Add, and Add query below an existing element, or at the bottom of the workbook.
- Select the ellipses (...) to the right of the Edit button next to one of the elements in the workbook, then select Add and then Add query.
- Select the data source for your query. The other fields are determined based on the data source you choose.
- Select any other values that are required based on the data source you selected.
- Select the visualization for your workbook.
- In the query section, enter your query, or select from a list of sample queries by selecting Samples, and then edit the query to your liking.
- Select Run Query.
- When you're sure you have the query you want in your workbook, select Done editing.
Best practices for querying logs
Use the smallest possible time ranges. The longer the time ranges, the slower the queries, and the more data returned. For longer time ranges, the query might have to go to slower "cold" storage, making the query even slower. Default to the shortest useful time range, but allow the user to pick a larger time range that may be slower.
Use the "All" special value in dropdowns. You can add an All special item in the dropdown parameter settings. You can use a special value. Using an All special item correctly can dramatically simplify queries.
Protect against missing columns. If you're using a custom table or custom columns, design your template so that it works if the column is missing in a workspace. See the column_ifexists function.
Protect against a missing table. If your template is installed as part of a solution, or in other cases where the tables are guaranteed to exist, checking for missing columns is unnecessary. If you're creating generic templates that could be visible on any resource or workspace, it's a good idea to protect for tables that don't exist. The log analytics query language doesn't have a table_ifexists function like the function for testing for columns. However, there are some ways to check if a table exists. For example, you can use a fuzzy union. When doing a union, you can use the isfuzzy=true setting to let the union continue if some of the tables don't exist. You can add a parameter query in your workbook that checks for existence of the table, and hides some content if it doesn't. Items that aren't visible aren't run, so you can design your template so that other queries in the workbook that would fail if the table doesn't exist, don't run until after the test verifies that the table exists.
For example:
let MissingTable = view () { print isMissing=1 };
union isfuzzy=true MissingTable, (AzureDiagnostics | getschema | summarize c=count() | project isMissing=iff(c > 0, 0, 1))
| top 1 by isMissing asc
This query returns a 1 if the AzureDiagnostics table doesn't exist in the workspace. If the real table doesn't exist, the fake row of the MissingTable will be returned. If any columns exist in the schema for the AzureDiagnostics table, a 0 is returned. You could use this as a parameter value, and conditionally hide your query steps unless the parameter value is 0. You could also use conditional visibility to show text that says that the current workspace doesn't have the missing table, and send the user to documentation on how to onboard.
Instead of hiding steps, you may just want to have no rows as a result. You can change the MissingTable to be an empty data table with the appropriate matching schema:
let MissingTable = datatable(ResourceId: string) [];
union isfuzzy=true MissingTable, (AzureDiagnostics
| extend ResourceId = column_ifexists('ResourceId', '')
In this case, the query returns no rows if the AzureDiagnostics table is missing, or if the ResourceId column is missing from the table.
Tutorial - resource centric logs queries in workbooks
This video shows you how to use resource level logs queries in Azure Workbooks. It also has tips and tricks on how to enable advanced scenarios and improve performance.
Dynamic resource type parameter
Uses dynamic scopes for more efficient querying. The snippet below uses this heuristic:
- Individual resources: if the count of selected resource is less than or equal to 5
- Resource groups: if the number of resources is over 5 but the number of resource groups the resources belong to is less than or equal to 3
- Subscriptions: otherwise
Resources
| take 1
| project x = dynamic(["microsoft.compute/virtualmachines", "microsoft.compute/virtualmachinescalesets", "microsoft.resources/resourcegroups", "microsoft.resources/subscriptions"])
| mvexpand x to typeof(string)
| extend jkey = 1
| join kind = inner (Resources
| where id in~ ({VirtualMachines})
| summarize Subs = dcount(subscriptionId), resourceGroups = dcount(resourceGroup), resourceCount = count()
| extend jkey = 1) on jkey
| project x, label = 'x',
      selected = case(
        x in ('microsoft.compute/virtualmachinescalesets', 'microsoft.compute/virtualmachines') and resourceCount <= 5, true,
        x == 'microsoft.resources/resourcegroups' and resourceGroups <= 3 and resourceCount > 5, true,
        x == 'microsoft.resources/subscriptions' and resourceGroups > 3 and resourceCount > 5, true,
        false)
Static resource scope for querying multiple resource types
[
    { "value":"microsoft.compute/virtualmachines", "label":"Virtual machine", "selected":true },
    { "value":"microsoft.compute/virtualmachinescaleset", "label":"Virtual machine scale set", "selected":true }
]
Resource parameter grouped by resource type
Resources
| where type =~ 'microsoft.compute/virtualmachines' or type =~ 'microsoft.compute/virtualmachinescalesets'
| where resourceGroup in~({ResourceGroups})
| project value = id, label = id, selected = false,
      group = iff(type =~ 'microsoft.compute/virtualmachines', 'Virtual machines', 'Virtual machine scale sets')
Add parameters
You can collect input from consumers and reference it in other parts of the workbook using parameters. Use parameters to scope the result set or to set the right visual. Parameters help you build interactive reports and experiences. For more information on how parameters can be used, see workbook parameters.
Workbooks allow you to control how your parameter controls are presented to consumers – text box vs. drop down, single- vs. multi-select, values from text, JSON, KQL, or Azure Resource Graph, etc.
Watch this video to learn how to use parameters and log data in Azure Workbooks.
To add a parameter to an Azure Workbook:
Make sure you are in Edit mode by selecting the Edit in the toolbar. Add a parameter by doing either of these steps:
- Select Add, and Add parameter below an existing element, or at the bottom of the workbook.
- Select the ellipses (...) to the right of the Edit button next to one of the elements in the workbook, then select Add and then Add parameter.
In the new parameter pane that pops up enter values for these fields:
- Parameter name: Parameter names can't include spaces or special characters
- Display name: Display names can include spaces, special characters, emoji, etc.
- Parameter type:
- Required:
Select Done editing.

Add metric charts
Most Azure resources emit metric data about state and health such as CPU utilization, storage availability, count of database transactions, failing app requests, etc. Using workbooks, you can create visualizations of the metric data as time-series charts.
The example below shows the number of transactions in a storage account over the prior hour. This allows the storage owner to see the transaction trend and look for anomalies in behavior.

To add a metric chart to an Azure Workbook:
- Make sure you are in Edit mode by selecting the Edit in the toolbar. Add a metric chart by doing either of these steps:
- Select Add, and Add metric below an existing element, or at the bottom of the workbook.
- Select the ellipses (...) to the right of the Edit button next to one of the elements in the workbook, then select Add and then Add metric.
- Select a resource type, the resources to target, the metric namespace and name, and the aggregation to use.
- Set other parameters if needed such time range, split-by, visualization, size and color palette.
- Select Done Editing.
This is a metric chart in edit mode:

Metric chart parameters
| Parameter | Explanation | Example |
|---|---|---|
| Resource Type | The resource type to target | Storage or Virtual Machine. |
| Resources | A set of resources to get the metrics value from | MyStorage1 |
| Namespace | The namespace with the metric | Storage > Blob |
| Metric | The metric to visualize | Storage > Blob > Transactions |
| Aggregation | The aggregation function to apply to the metric | Sum, Count, Average, etc. |
| Time Range | The time window to view the metric in | Last hour, Last 24 hours, etc. |
| Visualization | The visualization to use | Area, Bar, Line, Scatter, Grid |
| Split By | Optionally split the metric on a dimension | Transactions by Geo type |
| Size | The vertical size of the control | Small, medium or large |
| Color palette | The color palette to use in the chart. Ignored if the Split by parameter is used |
Blue, green, red, etc. |
Metric chart examples
Transactions split by API name as a line chart

Transactions split by response type as a large bar chart

Average latency as a scatter chart

Add links
You can use links to create links to other views, workbooks, other items inside a workbook, or to create tabbed views within a workbook. The links can be styled as hyperlinks, buttons, and tabs.

Watch this video to learn how to use tabs, groups, and contextual links in Azure Workbooks:
Link styles
You can apply styles to the link element itself and to individual links.
Link element styles
| Style | Sample | Notes |
|---|---|---|
| Bullet List |

|
The default, links, appears as a bulleted list of links, one on each line. The Text before link and Text after link fields can be used to add more text before or after the link items. |
| List |

|
Links appear as a list of links, with no bullets. |
| Paragraph |

|
Links appear as a paragraph of links, wrapped like a paragraph of text. |
| Navigation |

|
Links appear as links, with vertical dividers, or pipes (|) between each link. |
| Tabs |
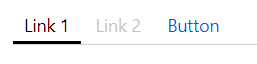
|
Links appear as tabs. Each link appears as a tab, no link styling options apply to individual links. See the tabs section below for how to configure tabs. |
| Toolbar |
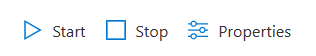
|
Links appear an Azure portal styled toolbar, with icons and text. Each link appears as a toolbar button. See the toolbar section below for how to configure toolbars. |
Link styles
| Style | Description |
|---|---|
| Link | By default links appear as a hyperlink. URL links can only be link style. |
| Button (Primary) | The link appears as a "primary" button in the portal, usually a blue color |
| Button (Secondary) | The links appear as a "secondary" button in the portal, usually a "transparent" color, a white button in light themes and a dark gray button in dark themes. |
If required parameters are used in button text, tooltip text, or value fields, and the required parameter is unset when using buttons, the button is disabled. You can use this capability, for example, to disable buttons when no value is selected in another parameter or control.
Link actions
Links can use all of the link actions available in link actions, and have two more available actions:
| Action | Description |
|---|---|
| Set a parameter value | A parameter can be set to a value when selecting a link, button, or tab. Tabs are often configured to set a parameter to a value, which hides and shows other parts of the workbook based on that value. |
| Scroll to a step | When selecting a link, the workbook will move focus and scroll to make another step visible. This action can be used to create a "table of contents", or a "go back to the top" style experience. |
Tabs
Most of the time, tab links are combined with the Set a parameter value action. Here's an example showing the links step configured to create 2 tabs, where selecting either tab sets a selectedTab parameter to a different value (the example shows a third tab being edited to show the parameter name and parameter value placeholders):

You can then add other items in the workbook that are conditionally visible if the selectedTab parameter value is "1" by using the advanced settings:

The first tab is selected by default, initially setting selectedTab to 1, and making that step visible. Selecting the second tab changes the value of the parameter to "2", and different content is displayed:

A sample workbook with the above tabs is available in sample Azure Workbooks with links. g
Tabs limitations
- URL links aren't supported in tabs. A URL link in a tab appears as a disabled tab.
- No item styling is supported in tabs. Items are displayed as tabs, and only the tab name (link text) field is displayed. Fields that aren't used in tab style are hidden while in edit mode.
- The first tab is selected by default, invoking whatever action that tab specified. If the first tab's action opens another view, as soon as the tabs are created, a view appears.
- You can use tabs to open another views, but this functionality should be used sparingly, since most users won't expect to navigate by selecting a tab. If other tabs are setting a parameter to a specific value, a tab that opens a view wouldn't change that value, so the rest of the workbook content continues to show the view or data for the previous tab.
Toolbars
Use the Toolbar style to have your links appear styled as a toolbar. In toolbar style, the author must fill in fields for:
- Button text, the text to display on the toolbar. Parameters may be used in this field.
- Icon, the icon to display in the toolbar.
- Tooltip Text, text to be displayed on the toolbar button's tooltip text. Parameters may be used in this field.

If any required parameters are used in button text, tooltip text, or value fields, and the required parameter is unset, the toolbar button is disabled. For example, this can be used to disable toolbar buttons when no value is selected in another parameter/control.
A sample workbook with toolbars, globals parameters, and ARM Actions is available in sample Azure Workbooks with links.
Add groups
A group item in a workbook allows you to logically group a set of steps in a workbook.
Groups in workbooks are useful for several things:
- Layout: When you want items to be organized vertically, you can create a group of items that will all stack up and set the styling of the group to be a percentage width instead of setting percentage width on all the individual items.
- Visibility: When you want several items to hide or show together, you can set the visibility of the entire group of items, instead of setting visibility settings on each individual item. This can be useful in templates that use tabs, as you can use a group as the content of the tab, and the entire group can be hidden/shown based on a parameter set by the selected tab.
- Performance: When you have a large template with many sections or tabs, you can convert each section into its own subtemplate, and use groups to load all the subtemplates within the top-level template. The content of the subtemplates won't load or run until a user makes those groups visible. Learn more about how to split a large template into many templates.
To add a group to your workbook:
Make sure you are in Edit mode by selecting the Edit in the toolbar. Add a parameter by doing either of these steps:
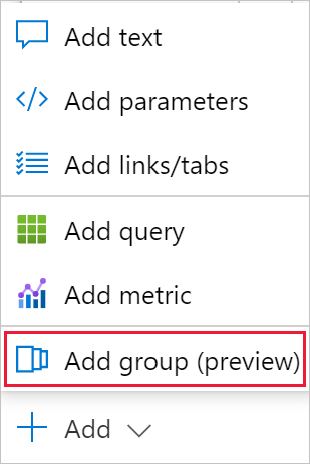
- Select Add, and Add group below an existing element, or at the bottom of the workbook.
- Select the ellipses (...) to the right of the Edit button next to one of the elements in the workbook, then select Add and then Add group.
Select items for your group.
Select Done editing.
This is a group in read mode with two items inside: a text item and a query item.

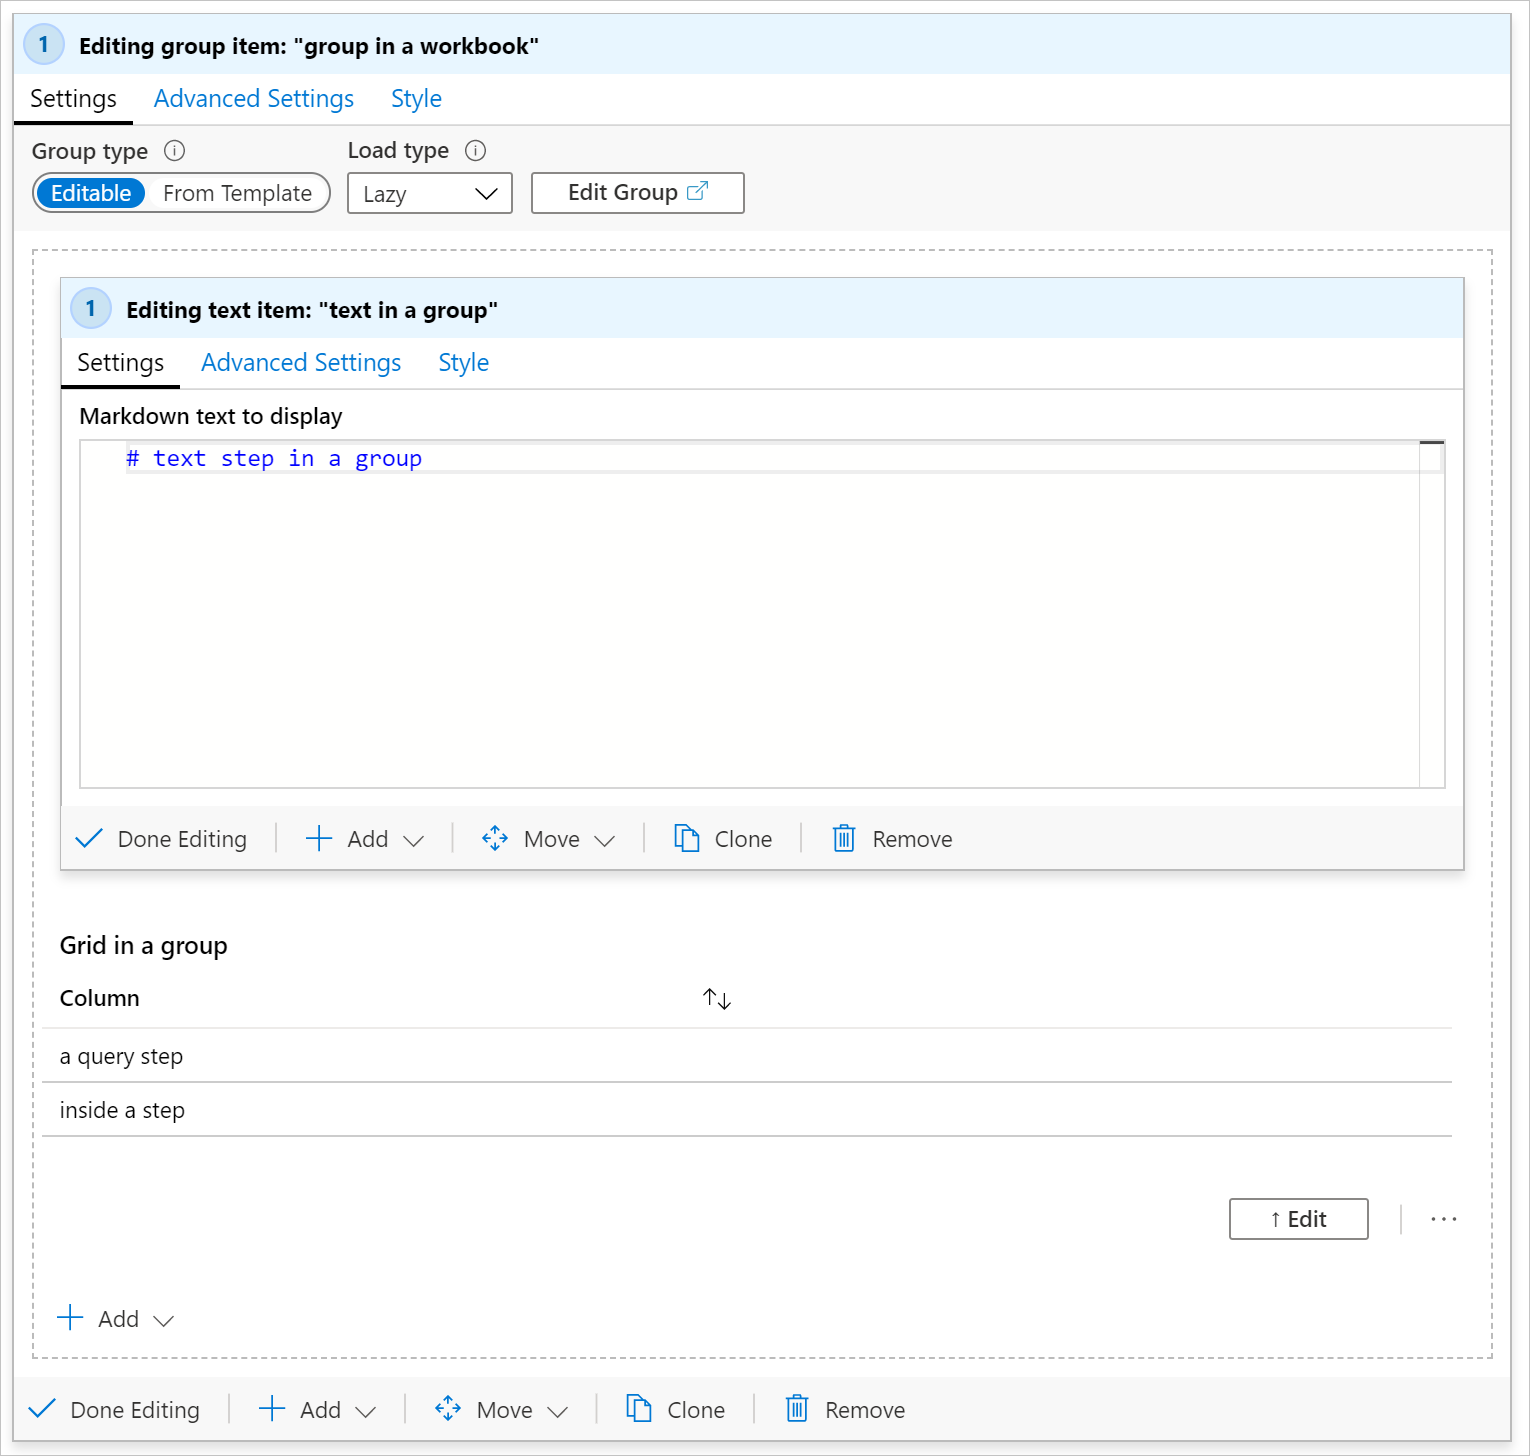
In edit mode, you can see those two items are actually inside a group item. In the screenshot below, the group is in edit mode. The group contains two items inside the dashed area. Each item can be in edit or read mode, independent of each other. For example, the text step is in edit mode while the query step is in read mode.


Scoping a group
A group is treated as a new scope in the workbook. Any parameters created in the group are only visible inside the group. This is also true for merge - you can only see data inside their group or at the parent level.
Group types
You can specify which type of group to add to your workbook. There are two types of groups:
- Editable: The group in the workbook allows you to add, remove, or edit the contents of the items in the group. This is most commonly used for layout and visibility purposes.
- From a template: The group in the workbook loads from the contents of another workbook by its ID. The content of that workbook is loaded and merged into the workbook at runtime. In edit mode, you can't modify any of the contents of the group, as they'll just load again from the template next time the item loads. When loading a group from a template, use the full Azure Resource ID of an existing workbook.
Load types
You can specify how and when the contents of a group are loaded.
Lazy loading
Lazy loading is the default. In lazy loading, the group is only loaded when the item is visible. This allows a group to be used by tab items. If the tab is never selected, the group never becomes visible and therefore the content isn't loaded.
For groups created from a template, the content of the template isn't retrieved and the items in the group aren't created until the group becomes visible. Users see progress spinners for the whole group while the content is retrieved.
Explicit loading
In this mode, a button is displayed where the group would be, and no content is retrieved or created until the user explicitly selects the button to load the content. This is useful in scenarios where the content might be expensive to compute or rarely used. The author can specify the text to appear on the button.
This screenshot shows explicit load settings with a configured "Load more" button.

This is the group before being loaded in the workbook:

The group after being loaded in the workbook:

Always mode
In Always mode, the content of the group is always loaded and created as soon as the workbook loads. This is most frequently used when you're using a group only for layout purposes, where the content will always be visible.
Using templates inside a group
When a group is configured to load from a template, by default, that content is loaded in lazy mode, and it will only load when the group is visible.
When a template is loaded into a group, the workbook attempts to merge any parameters declared in the template with parameters that already exist in the group. Any parameters that already exist in the workbook with identical names will be merged out of the template being loaded. If all parameters in a parameter step are merged out, the entire parameters step disappears.
Example 1: All parameters have identical names
Suppose you have a template that has two parameters at the top, a time range parameter and a text parameter named "Filter":

Then a group item loads a second template that has its own two parameters and a text step, where the parameters are named the same:

When the second template is loaded into the group, the duplicate parameters are merged out. Since all of the parameters are merged away, the inner parameters step is also merged out, resulting in the group containing only the text step.
Example 2: One parameter has an identical name
Suppose you have a template that has two parameters at the top, a time range parameter and a text parameter named "FilterB" ():

When the group's item's template is loaded, the TimeRange parameter is merged out of the group. The workbook contains the initial parameters step with TimeRange and Filter, and the group's parameter only includes FilterB.

If the loaded template had contained TimeRange and Filter (instead of FilterB), then the resulting workbook would have a parameters step and a group with only the text step remaining.
Splitting a large template into many templates
To improve performance, it's helpful to break up a large template into multiple smaller templates that loads some content in lazy mode or on demand by the user. This makes the initial load faster since the top-level template can be smaller.
When splitting a template into parts, you'll basically need to split the template into many templates (subtemplates) that all work individually. If the top-level template has a TimeRange parameter that other items use, the subtemplate will need to also have a parameters item that defines a parameter with same exact name. The subtemplates will work independently and can load inside larger templates in groups.
To turn a larger template into multiple subtemplates:
Create a new empty group near the top of the workbook, after the shared parameters. This new group will eventually become a subtemplate.
Create a copy of the shared parameters step, and then use move into group to move the copy into the group created in step 1. This parameter allows the subtemplate to work independently of the outer template, and will get merged out when loaded inside the outer template.
Note
Subtemplates don't technically need to have the parameters that get merged out if you never plan on the sub-templates being visible by themselves. However, if the sub-templates do not have the parameters, it will make them very hard to edit or debug if you need to do so later.
Move each item in the workbook you want to be in the subtemplate into the group created in step 1.
If the individual steps moved in step 3 had conditional visibilities, that becomes the visibility of the outer group (like used in tabs). Remove them from the items inside the group and add that visibility setting to the group itself. Save here to avoid losing changes and/or export and save a copy of the json content.
If you want that group to be loaded from a template, you can use the Edit toolbar button in the group. This opens just the content of that group as a workbook in a new window. You can then save it as appropriate and close this workbook view (don't close the browser, just that view to go back to the previous workbook you were editing).
You can then change the group step to load from template and set the template ID field to the workbook/template you created in step 5. To work with workbooks IDs, the source needs to be the full Azure Resource ID of a shared workbook. Press Load and the content of that group will now be loaded from that subtemplate instead of saved inside this outer workbook.
Feedback
Coming soon: Throughout 2024 we will be phasing out GitHub Issues as the feedback mechanism for content and replacing it with a new feedback system. For more information see: https://aka.ms/ContentUserFeedback.
Submit and view feedback for