Measure business outcomes by using AppDynamics
Measuring and quantifying business outcomes is a crucial part of any cloud adoption strategy. Understanding an application's performance and user experience is key to measuring those business outcomes. However, accurately measuring the correlation between application performance, user experience, and business impact is often difficult and time consuming.
AppDynamics can provide business insights for most metrics. Many organizations start a comprehensive cloud adoption strategy with these metrics:
- A pre-migration and post-migration comparison
- Business health
- Release validation
- Segment health
- User journeys
- Business journeys
- Conversion funnels
This article describes how to measure the business outcomes of a cloud adoption migration. It also describes how to speed up a migration and reduce risks.
How AppDynamics works
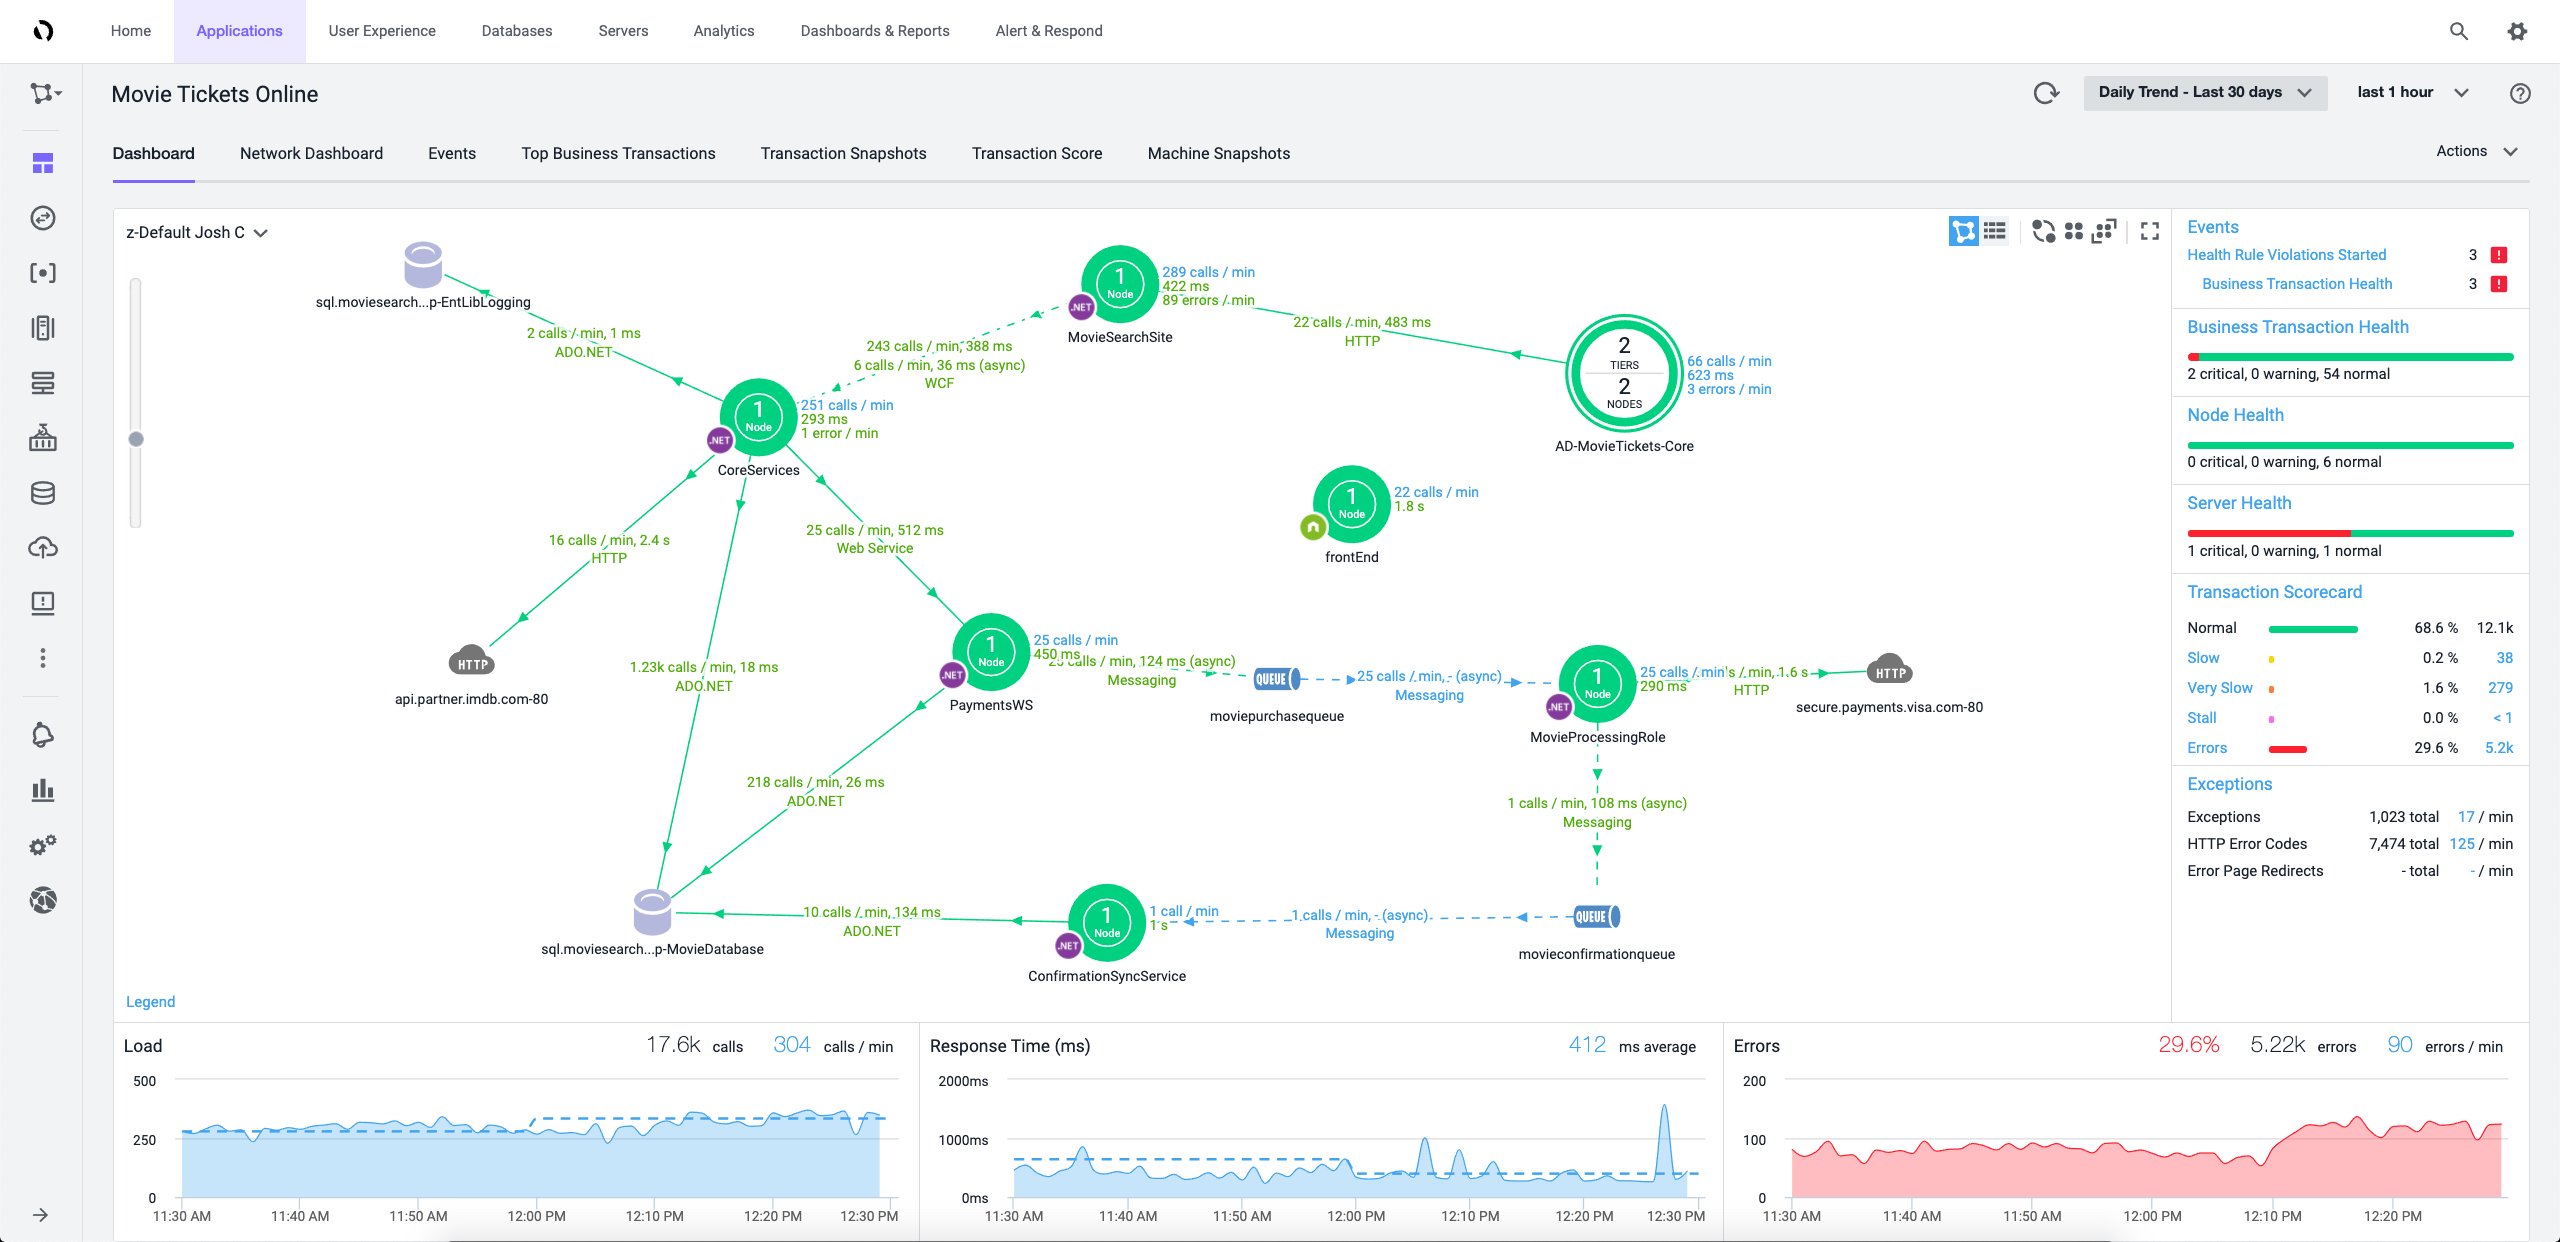
To use AppDynamics, you deploy a small, lightweight agent alongside your applications before your migration. Agents support various languages, like .NET, Java, and Node.js. The agent collects performance and diagnostic data during the migration and sends it to a controller that correlates and analyzes the information. Controllers can reside in a fully managed AppDynamics environment, or you can manage them in Azure. Key user experiences are identified as business transactions, which help you discover the baseline for normal application or business performance. Whether they're traditional server infrastructure, databases, middleware components, on-premises, or in the cloud, all application components and dependencies are identified in real time for the entire application and each business transaction.
Figure 1: AppDynamics flow map.
AppDynamics and business metrics
AppDynamics helps you define business value for your applications, identify the key metrics that they should meet to retain their value, and determine whether they're meeting their target business outcomes. AppDynamics agents collect these data points and traditional application performance metrics like response time and memory utilization in real time, directly from the application, without any changes to code.
Business metrics are closely related to business outcomes. Many organizations have complex metrics that measure unique business outcomes. These outcomes can range from fiscal and agility-related metrics to performance and customer engagement goals. AppDynamics collects the metrics that are specific and useful to your organization. Those metrics can contribute to business operations before and after you migrate workloads to Azure.
Example:
A company that sells widgets in an online marketplace identifies these key business transactions in its web application:
- Landing page
- Add to cart
- Shipping
- Billing
- Confirm order
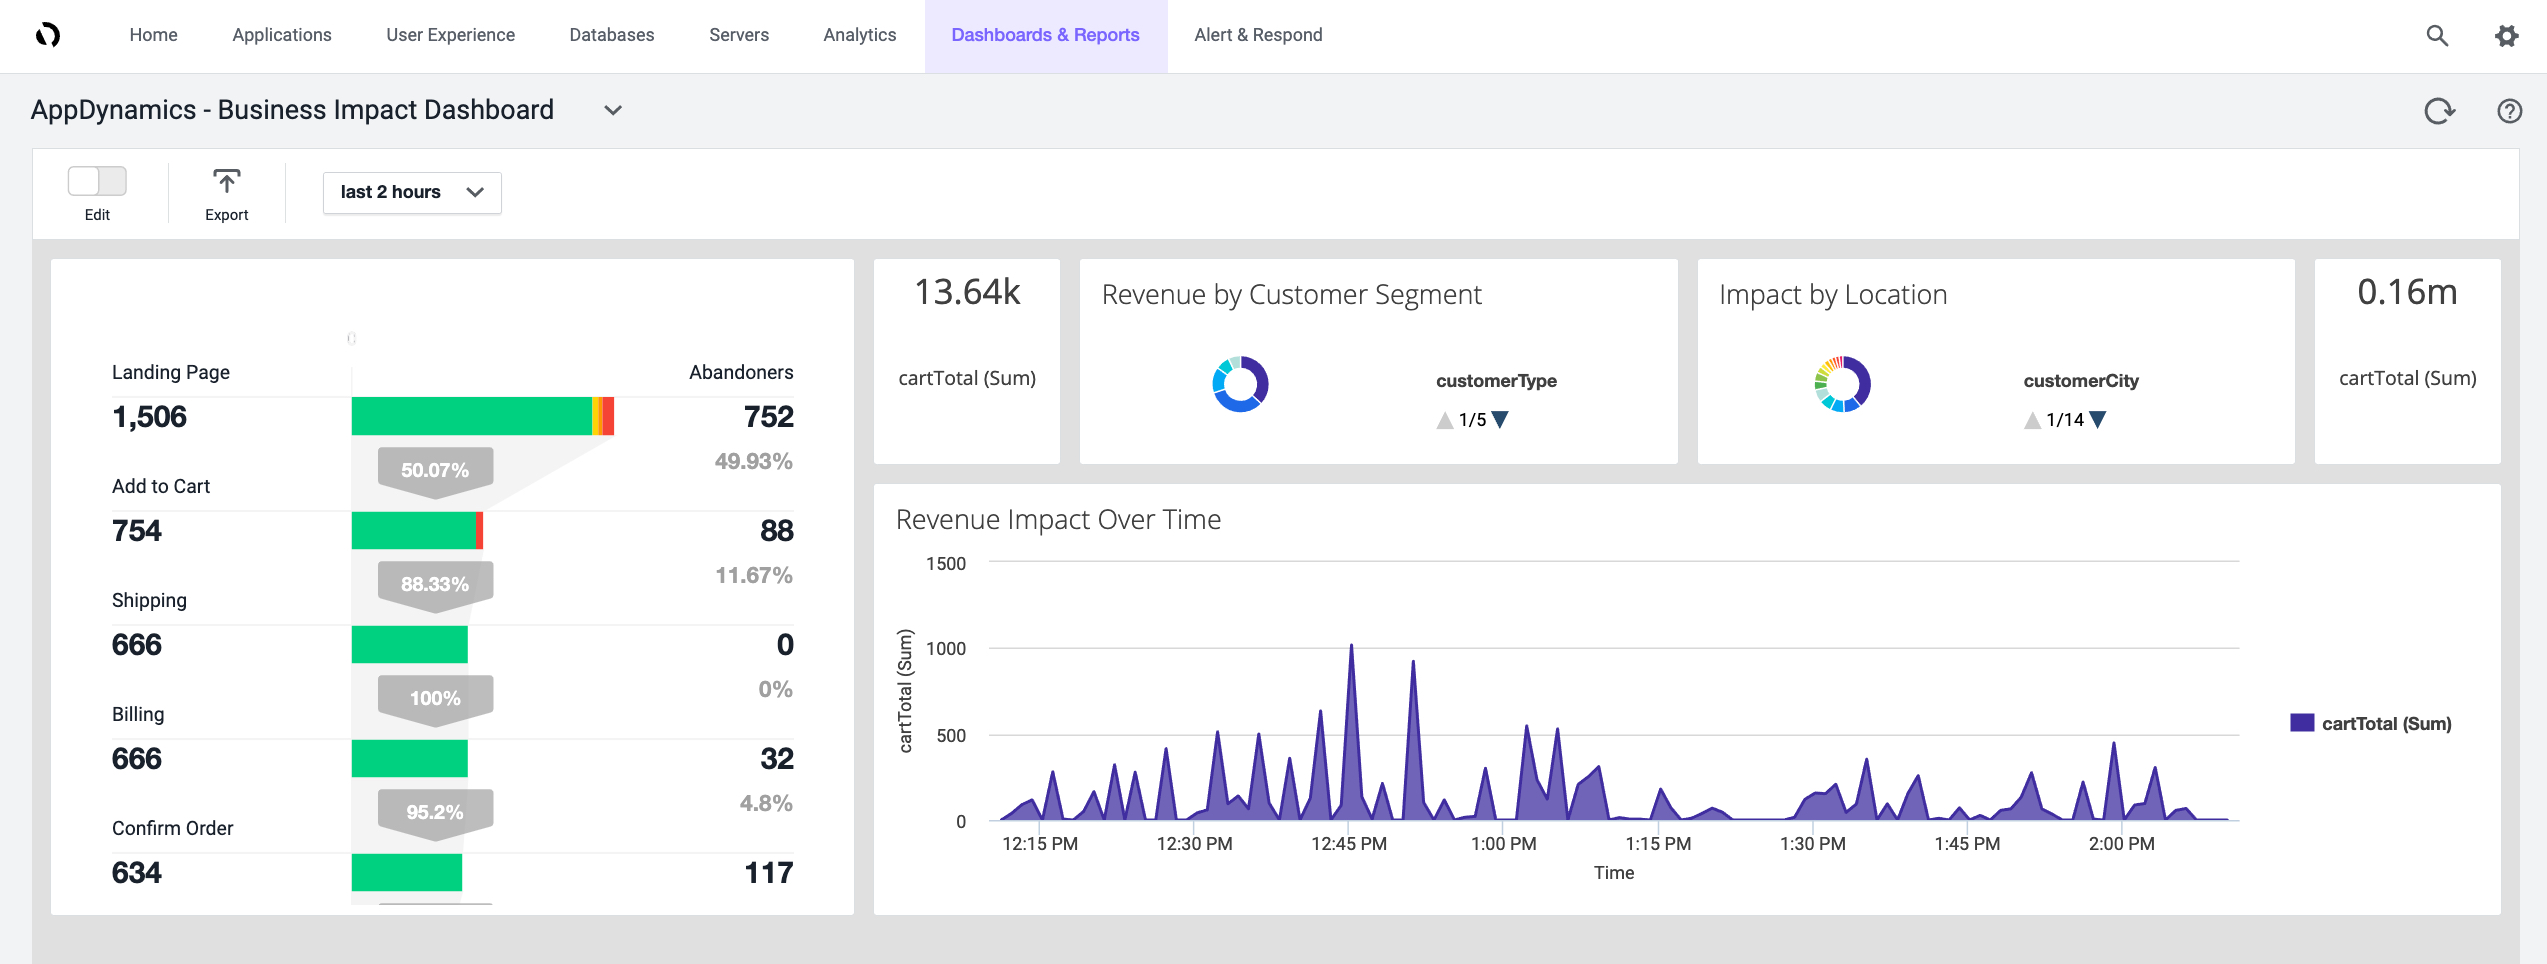
These business transactions are common to e-commerce applications. A conversion funnel is the journey that users take when they move through these pages. It leads directly to sales revenue for the company. When users abandon the journey because of poor page performance or errors, it affects the company's profits.
The company identifies these additional key business metrics:
- Cart totals
- Customer segments
- Customer locations
Combining application and business performance metrics helps to demonstrate how the application's performance relates to profit. These insights are vital during migrations.
Configurable dashboards are one of many AppDynamics tools that visualize these insights. In the following example, you can see the overall conversion funnel and the effect of individual page performance on abandoners. You can also see shopping cart totals, customer segments, location, and general revenue details.
Figure 2: AppDynamics business impact dashboard.
Identify business metrics
The strategy and business outcomes sections of the Cloud Adoption Framework for Azure provide strategies to help you identify business outcomes for your organization.
Pre-migration and post-migration comparison
The cloud offers extensive benefits and potential, but the first steps of a migration are often unclear and risky. You need to use more criteria, beyond the success of the deployment, to evaluate a migration. Understanding the user experience and business performance before and after cloud migration helps you to adjust and stabilize both as needed. Those adjustments help you produce successful business outcomes while reinforcing the value that Azure provides throughout your migration.
To build on the foundation that AppDynamics provides, compare business and application metrics before and after a migration to evaluate whether the target business outcomes are met.
Example:
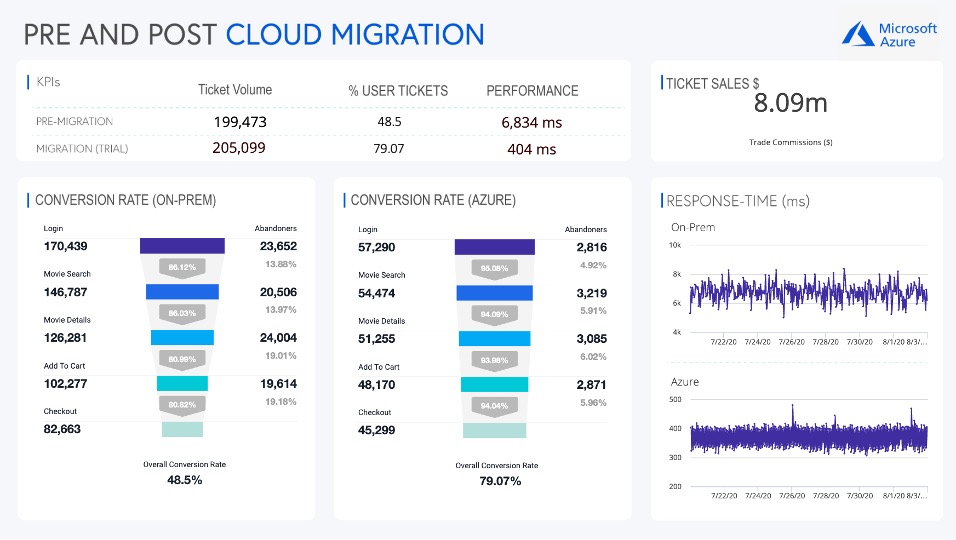
Movie Tickets Online, a fictional online ticket vendor, is retiring its existing datacenters and moving its workloads to Azure. Capacity problems have led to poor business transaction performance, and the company looks forward to the performance optimizations and capacity provided by Azure.
In addition to improving performance, the company wants to ensure that the business outcome goals of improving sales funnels and growing revenue are met. As part of the migration, the company deployed AppDynamics to its existing on-premises environments to clearly understand the current performance. As part of the cloud deployment, the company can use the AppDynamics native integration with Azure to understand post-migration performance and business outcomes.
Movie Tickets Online experienced an increase in conversion rates from 48 to 79 percent and improvements to performance, response time, and ticket sales volume.
Figure 3: AppDynamics migration comparison.
Next steps
AppDynamics can help you measure business outcomes during your cloud adoption. For more information about using AppDynamics with Azure, see Azure observability, right out of the box.
Feedback
Coming soon: Throughout 2024 we will be phasing out GitHub Issues as the feedback mechanism for content and replacing it with a new feedback system. For more information see: https://aka.ms/ContentUserFeedback.
Submit and view feedback for


