series_fft()
Applies the Fast Fourier Transform (FFT) on a series.
The series_fft() function takes a series of complex numbers in the time/spatial domain and transforms it to the frequency domain using the Fast Fourier Transform. The transformed complex series represents the magnitude and phase of the frequencies appearing in the original series. Use the complementary function series_ifft to transform from the frequency domain back to the time/spatial domain.
Syntax
series_fft(x_real [, x_imaginary])
Learn more about syntax conventions.
Parameters
| Name | Type | Required | Description |
|---|---|---|---|
| x_real | dynamic |
✔️ | A numeric array representing the real component of the series to transform. |
| x_imaginary | dynamic |
A similar array representing the imaginary component of the series. This parameter should only be specified if the input series contains complex numbers. |
Returns
The function returns the complex inverse fft in two series. The first series for the real component and the second one for the imaginary component.
Example
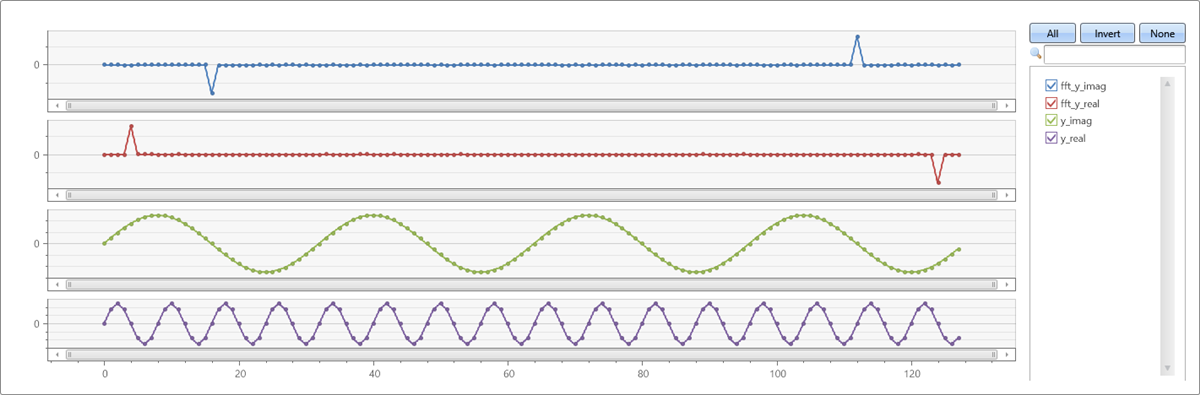
Generate a complex series, where the real and imaginary components are pure sine waves in different frequencies. Use FFT to transform it to the frequency domain:
let sinewave=(x:double, period:double, gain:double=1.0, phase:double=0.0)
{
    gain*sin(2*pi()/period*(x+phase))
}
;
let n=128;      //  signal length
range x from 0 to n-1 step 1 | extend yr=sinewave(x, 8), yi=sinewave(x, 32)
| summarize x=make_list(x), y_real=make_list(yr), y_imag=make_list(yi)
| extend (fft_y_real, fft_y_imag) = series_fft(y_real, y_imag)
| render linechart with(ysplit=panels)
This query returns fft_y_real and fft_y_imag:
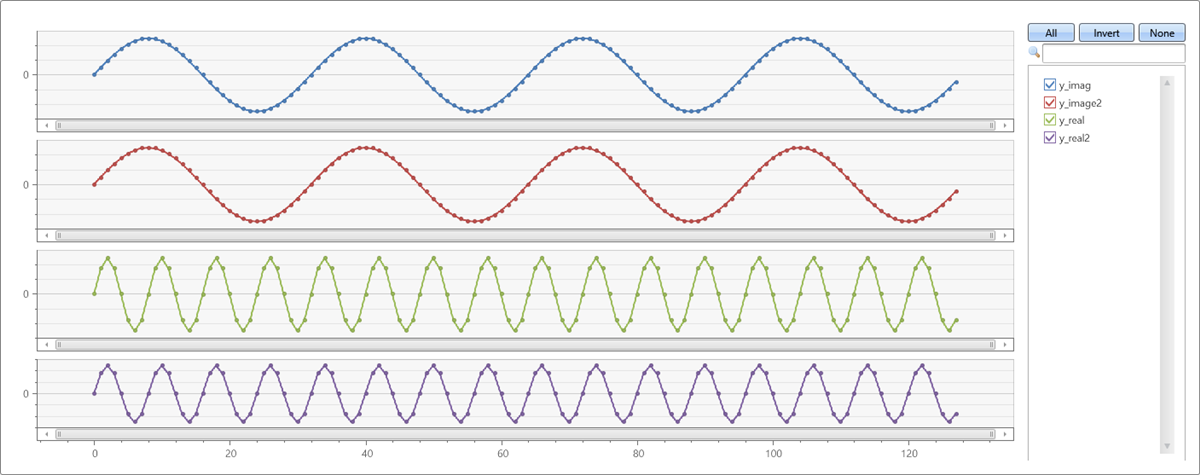
Transform a series to the frequency domain, and then apply the inverse transform to get back the original series:
let sinewave=(x:double, period:double, gain:double=1.0, phase:double=0.0)
{
    gain*sin(2*pi()/period*(x+phase))
}
;
let n=128;      //  signal length
range x from 0 to n-1 step 1 | extend yr=sinewave(x, 8), yi=sinewave(x, 32)
| summarize x=make_list(x), y_real=make_list(yr), y_imag=make_list(yi)
| extend (fft_y_real, fft_y_imag) = series_fft(y_real, y_imag)
| extend (y_real2, y_image2) = series_ifft(fft_y_real, fft_y_imag)
| project-away fft_y_real, fft_y_imag   //  too many series for linechart with panels
| render linechart with(ysplit=panels)
This query returns y_real2 and *y_imag2, which are the same as y_real and y_imag:
Feedback
Coming soon: Throughout 2024 we will be phasing out GitHub Issues as the feedback mechanism for content and replacing it with a new feedback system. For more information see: https://aka.ms/ContentUserFeedback.
Submit and view feedback for