Query Azure Monitor logs to monitor HDInsight clusters
Learn some basic scenarios on how to use Azure Monitor logs to monitor Azure HDInsight clusters:
Note
This article was recently updated to use the term Azure Monitor logs instead of Log Analytics. Log data is still stored in a Log Analytics workspace and is still collected and analyzed by the same Log Analytics service. We are updating the terminology to better reflect the role of logs in Azure Monitor. See Azure Monitor terminology changes for details.
Prerequisites
You must have configured an HDInsight cluster to use Azure Monitor logs, and added the HDInsight cluster-specific Azure Monitor logs monitoring solutions to the workspace. For instructions, see Use Azure Monitor logs with HDInsight clusters.
Analyze HDInsight cluster metrics
Learn how to look for specific metrics for your HDInsight cluster.
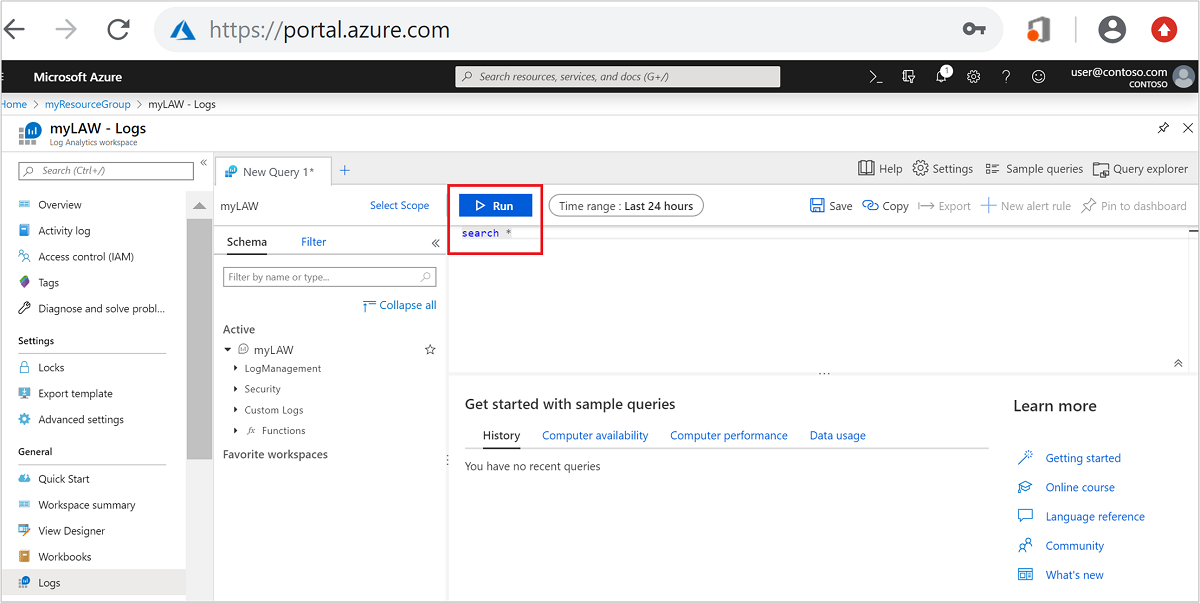
Open the Log Analytics workspace that is associated to your HDInsight cluster from the Azure portal.
Under General, select Logs.
Type the following query in the search box to search for all metrics for all available metrics for all HDInsight clusters configured to use Azure Monitor logs, and then select Run. Review the results.
search *
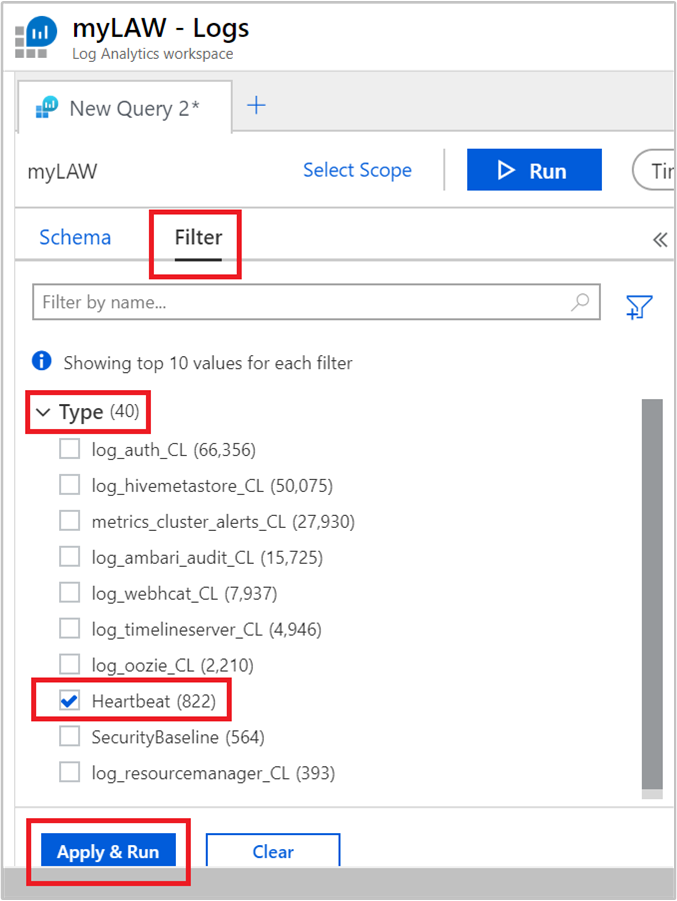
From the left menu, select the Filter tab.
Under Type, select Heartbeat. Then select Apply & Run.

Notice that the query in the text box changes to:
search *
| where Type == "Heartbeat"
You can dig deeper by using the options available in the left menu. For example:
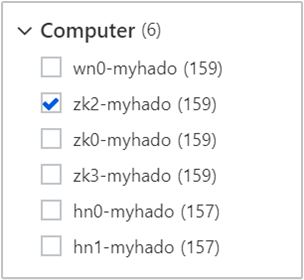
To see logs from a specific node:

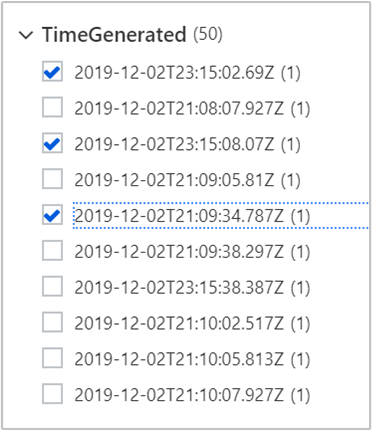
To see logs at certain times:

Select Apply & Run and review the results. Also note that the query was updated to:
search *
| where Type == "Heartbeat"
| where (Computer == "zk2-myhado") and (TimeGenerated == "2019-12-02T23:15:02.69Z" or TimeGenerated == "2019-12-02T23:15:08.07Z" or TimeGenerated == "2019-12-02T21:09:34.787Z")
Additional sample queries
A sample query based on the average of resources used in a 10-minute interval, categorized by cluster name:
search in (metrics_resourcemanager_queue_root_default_CL) *
| summarize AggregatedValue = avg(UsedAMResourceMB_d) by ClusterName_s, bin(TimeGenerated, 10m)
Instead of refining based on the average of resources used, you can use the following query to refine the results based on when the maximum resources were used (as well as 90th and 95th percentile) in a 10-minute window:
search in (metrics_resourcemanager_queue_root_default_CL) *
| summarize ["max(UsedAMResourceMB_d)"] = max(UsedAMResourceMB_d), ["pct95(UsedAMResourceMB_d)"] = percentile(UsedAMResourceMB_d, 95), ["pct90(UsedAMResourceMB_d)"] = percentile(UsedAMResourceMB_d, 90) by ClusterName_s, bin(TimeGenerated, 10m)
Create alerts for tracking events
The first step to create an alert is to arrive at a query based on which the alert is triggered. You can use any query that you want to create an alert.
Open the Log Analytics workspace that is associated to your HDInsight cluster from the Azure portal.
Under General, select Logs.
Run the following query on which you want to create an alert, and then select Run.
metrics_resourcemanager_queue_root_default_CL | where AppsFailed_d > 0The query provides list of failed applications running on HDInsight clusters.
Select New alert rule on the top of the page.

In the Create rule window, enter the query and other details to create an alert, and then select Create alert rule.

Edit or delete an existing alert
Open the Log Analytics workspace from the Azure portal.
From the left menu, under Monitoring, select Alerts.
Towards the top, select Manage alert rules.
Select the alert you want to edit or delete.
You have the following options: Save, Discard, Disable, and Delete.

For more information, see Create, view, and manage metric alerts using Azure Monitor.
See also
Feedback
Coming soon: Throughout 2024 we will be phasing out GitHub Issues as the feedback mechanism for content and replacing it with a new feedback system. For more information see: https://aka.ms/ContentUserFeedback.
Submit and view feedback for