Generate a Responsible AI insights in the studio UI
In this article, you create a Responsible AI dashboard and scorecard (preview) with a no-code experience in the Azure Machine Learning studio UI.
Important
This feature is currently in public preview. This preview version is provided without a service-level agreement, and we don't recommend it for production workloads. Certain features might not be supported or might have constrained capabilities.
For more information, see Supplemental Terms of Use for Microsoft Azure Previews.
To access the dashboard generation wizard and generate a Responsible AI dashboard, do the following:
Register your model in Azure Machine Learning so that you can access the no-code experience.
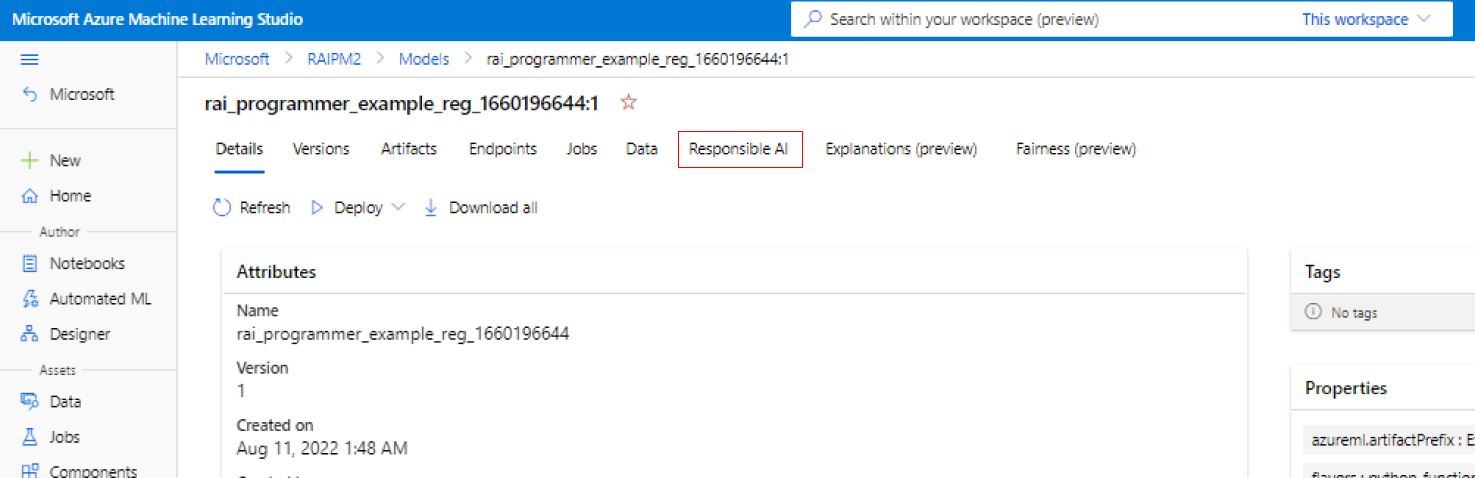
On the left pane of Azure Machine Learning studio, select the Models tab.
Select the registered model that you want to create Responsible AI insights for, and then select the Details tab.
Select Create Responsible AI dashboard (preview).

To learn more supported model types and limitations in the Responsible AI dashboard, see supported scenarios and limitations.
The wizard provides an interface for entering all the necessary parameters to create your Responsible AI dashboard without having to touch code. The experience takes place entirely in the Azure Machine Learning studio UI. The studio presents a guided flow and instructional text to help contextualize the variety of choices about which Responsible AI components you'd like to populate your dashboard with.
The wizard is divided into five sections:
- Training datasets
- Test dataset
- Modeling task
- Dashboard components
- Component parameters
- Experiment configuration
Select your datasets
In the first two sections, you select the train and test datasets that you used when you trained your model to generate model-debugging insights. For components like causal analysis, which doesn't require a model, you use the train dataset to train the causal model to generate the causal insights.
Note
Only tabular dataset formats in ML Table are supported.
Select a dataset for training: In the list of registered datasets in the Azure Machine Learning workspace, select the dataset you want to use to generate Responsible AI insights for components, such as model explanations and error analysis.
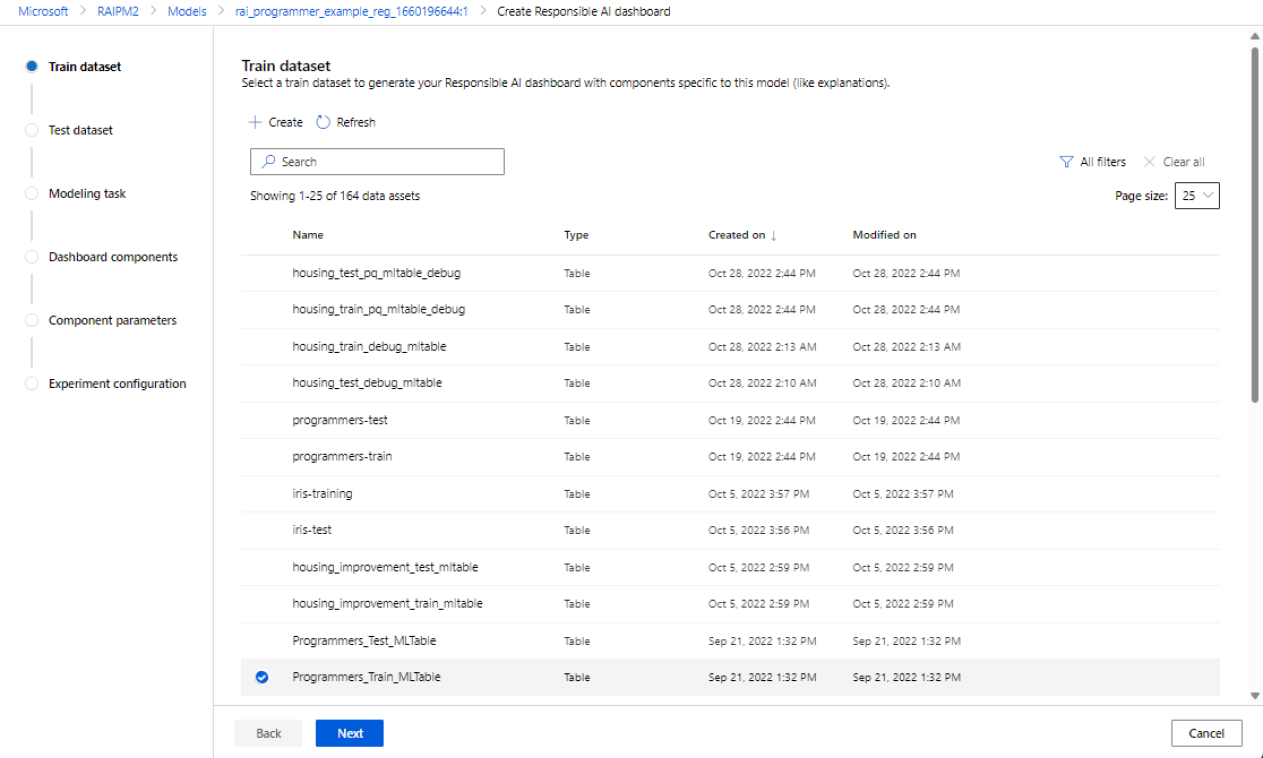
Select a dataset for testing: In the list of registered datasets, select the dataset you want to use to populate your Responsible AI dashboard visualizations.

If the train or test dataset you want to use isn't listed, select Create to upload it.


Select your modeling task
After you've picked your datasets, select your modeling task type, as shown in the following image:

Select your dashboard components
The Responsible AI dashboard offers two profiles for recommended sets of tools that you can generate:
Model debugging: Understand and debug erroneous data cohorts in your machine learning model by using error analysis, counterfactual what-if examples, and model explainability.
Real-life interventions: Understand and debug erroneous data cohorts in your machine learning model by using causal analysis.
Note
Multi-class classification doesn't support the real-life interventions analysis profile.

- Select the profile you want to use.
- Select Next.
Configure parameters for dashboard components
After you've selected a profile, the Component parameters for model debugging configuration pane for the corresponding components appears.

Component parameters for model debugging:
Target feature (required): Specify the feature that your model was trained to predict.
Categorical features: Indicate which features are categorical to properly render them as categorical values in the dashboard UI. This field is pre-loaded for you based on your dataset metadata.
Generate error tree and heat map: Toggle on and off to generate an error analysis component for your Responsible AI dashboard.
Features for error heat map: Select up to two features that you want to pre-generate an error heatmap for.
Advanced configuration: Specify additional parameters, such as Maximum depth of error tree, Number of leaves in error tree, and Minimum number of samples in each leaf node.
Generate counterfactual what-if examples: Toggle on and off to generate a counterfactual what-if component for your Responsible AI dashboard.
Number of counterfactuals (required): Specify the number of counterfactual examples that you want generated per data point. A minimum of 10 should be generated to enable a bar chart view of the features that were most perturbed, on average, to achieve the desired prediction.
Range of value predictions (required): Specify for regression scenarios the range that you want counterfactual examples to have prediction values in. For binary classification scenarios, the range will automatically be set to generate counterfactuals for the opposite class of each data point. For multi-classification scenarios, use the dropdown list to specify which class you want each data point to be predicted as.
Specify which features to perturb: By default, all features will be perturbed. However, if you want only specific features to be perturbed, select Specify which features to perturb for generating counterfactual explanations to display a pane with a list of features to select.
When you select Specify which features to perturb, you can specify the range you want to allow perturbations in. For example: for the feature YOE (Years of experience), specify that counterfactuals should have feature values ranging from only 10 to 21 instead of the default values of 5 to 21.

Generate explanations: Toggle on and off to generate a model explanation component for your Responsible AI dashboard. No configuration is necessary, because a default opaque box mimic explainer will be used to generate feature importances.

Alternatively, if you select the Real-life interventions profile, you'll see the following screen generate a causal analysis. This will help you understand the causal effects of features you want to "treat" on a certain outcome you want to optimize.

Component parameters for real-life interventions use causal analysis. Do the following:
- Target feature (required): Choose the outcome you want the causal effects to be calculated for.
- Treatment features (required): Choose one or more features that you're interested in changing ("treating") to optimize the target outcome.
- Categorical features: Indicate which features are categorical to properly render them as categorical values in the dashboard UI. This field is pre-loaded for you based on your dataset metadata.
- Advanced settings: Specify additional parameters for your causal analysis, such as heterogenous features (that is, additional features to understand causal segmentation in your analysis, in addition to your treatment features) and which causal model you want to be used.
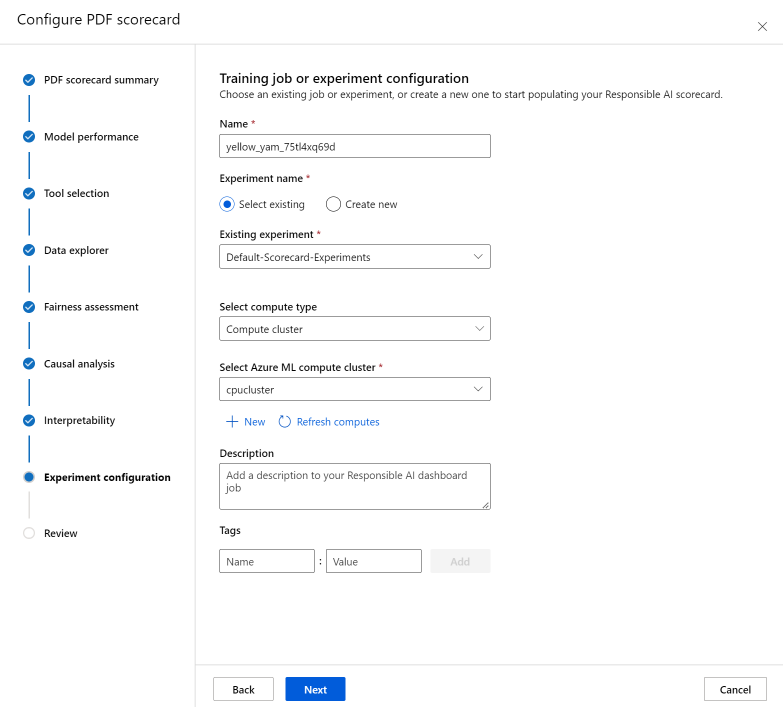
Configure your experiment
Finally, configure your experiment to kick off a job to generate your Responsible AI dashboard.

On the Training job or Experiment configuration pane, do the following:
- Name: Give your dashboard a unique name so that you can differentiate it when you're viewing the list of dashboards for a given model.
- Experiment name: Select an existing experiment to run the job in, or create a new experiment.
- Existing experiment: In the dropdown list, select an existing experiment.
- Select compute type: Specify which compute type you want to use to execute your job.
- Select compute: In the dropdown list, select the compute you want to use. If there are no existing compute resources, select the plus sign (+), create a new compute resource, and then refresh the list.
- Description: Add a longer description of your Responsible AI dashboard.
- Tags: Add any tags to this Responsible AI dashboard.
After you've finished configuring your experiment, select Create to start generating your Responsible AI dashboard. You'll be redirected to the experiment page to track the progress of your job with a link to the resulting Responsible AI dashboard from the job page when it's completed.
To learn how to view and use your Responsible AI dashboard see, Use the Responsible AI dashboard in Azure Machine Learning studio.
How to generate Responsible AI scorecard (preview)
Once you've created a dashboard, you can use a no-code UI in Azure Machine Learning studio to customize and generate a Responsible AI scorecard. This enables you to share key insights for responsible deployment of your model, such as fairness and feature importance, with non-technical and technical stakeholders. Similar to creating a dashboard, you can use the following steps to access the scorecard generation wizard:
- Navigate to the Models tab from the left navigation bar in Azure Machine Learning studio.
- Select the registered model you'd like to create a scorecard for and select the Responsible AI tab.
- From the top panel, select Create Responsible AI insights (preview) and then Generate new PDF scorecard.
The wizard will allow you to customize your PDF scorecard without having to touch code. The experience takes place entirely in the Azure Machine Learning studio to help contextualize the variety of choices of UI with a guided flow and instructional text to help you choose the components you'd like to populate your scorecard with. The wizard is divided into seven steps, with an eighth step (fairness assessment) that will only appear for models with categorical features:
- PDF scorecard summary
- Model performance
- Tool selection
- Data analysis (previously called data explorer)
- Causal analysis
- Interpretability
- Experiment configuration
- Fairness assessment (only if categorical features exist)
Configuring your scorecard
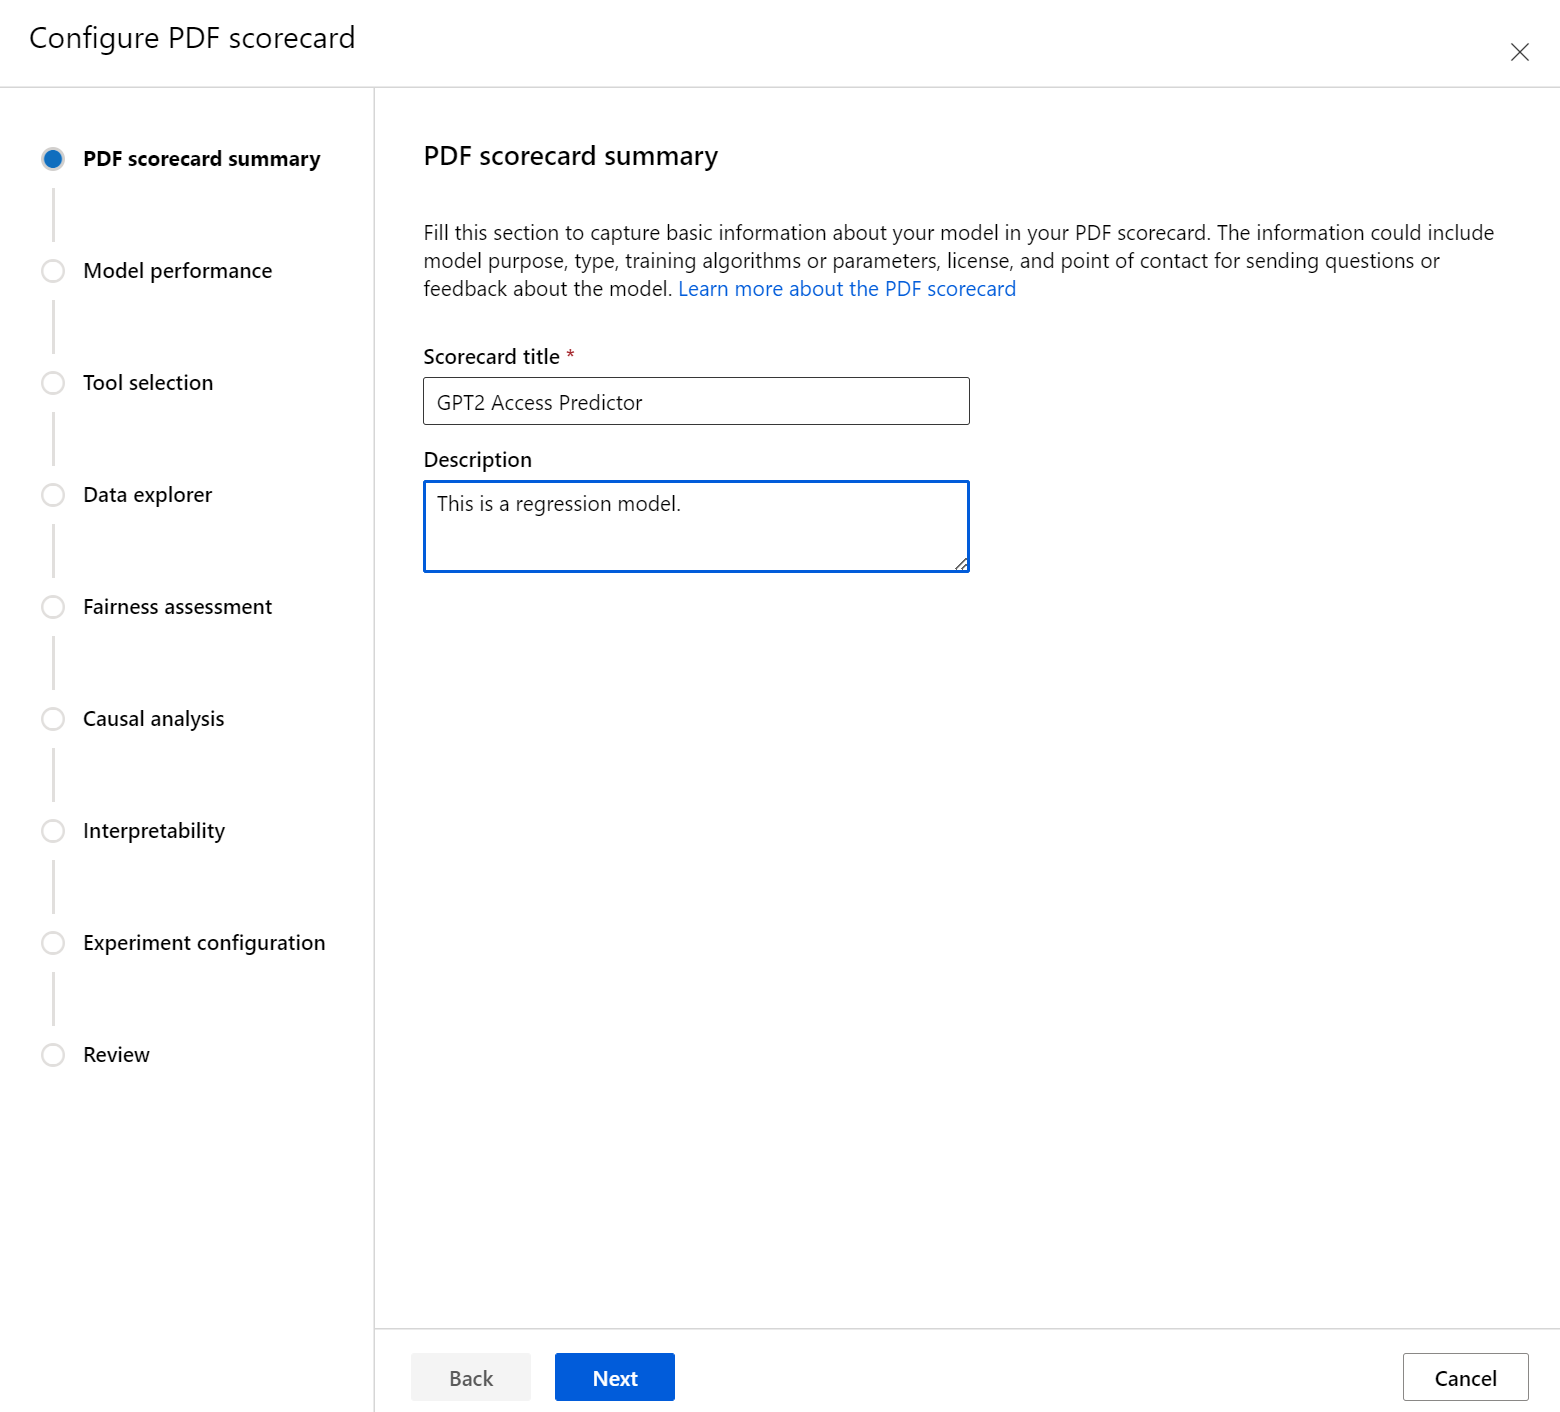
First, enter a descriptive title for your scorecard. You can also enter an optional description about the model's functionality, data it was trained and evaluated on, architecture type, and more.
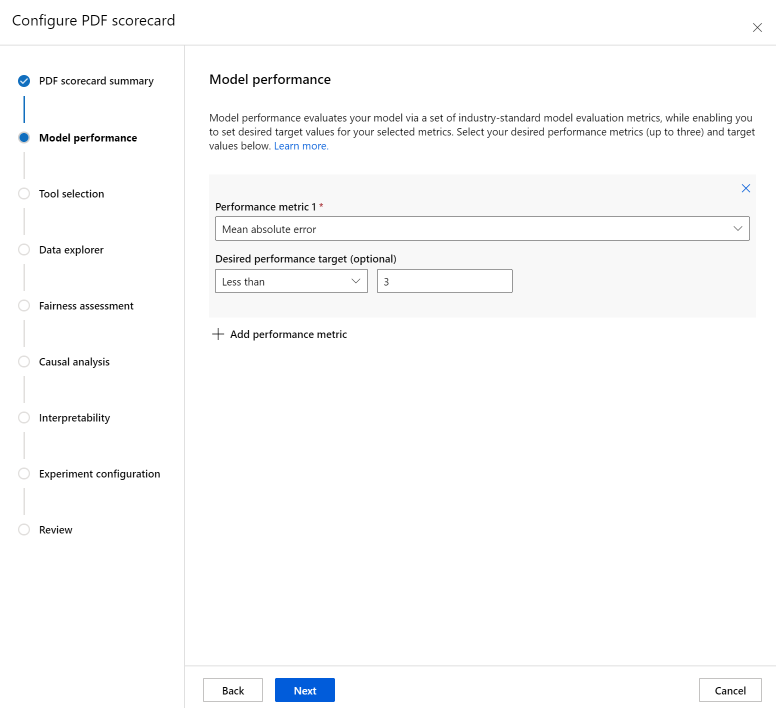
The Model performance section allows you to incorporate into your scorecard industry-standard model evaluation metrics, while enabling you to set desired target values for your selected metrics. Select your desired performance metrics (up to three) and target values using the dropdowns.
The Tool selection step allows you to choose which subsequent components you would like to include in your scorecard. Check Include in scorecard to include all components, or check/uncheck each component individually. Select the info icon ("i" in a circle) next to the components to learn more about them.

The Data analysis section (previously called data explorer) enables cohort analysis. Here, you can identify issues of over- and under-representation explore how data is clustered in the dataset, and how model predictions impact specific data cohorts. Use checkboxes in the dropdown to select your features of interest below to identify your model performance on their underlying cohorts.

The Fairness assessment section can help with assessing which groups of people might be negatively impacted by predictions of a machine learning model. There are two fields in this section.
Sensitive features: identify your sensitive attribute(s) of choice (for example, age, gender) by prioritizing up to 20 subgroups you would like to explore and compare.
Fairness metric: select a fairness metric that is appropriate for your setting (for example, difference in accuracy, error rate ratio), and identify your desired target value(s) on your selected fairness metric(s). Your selected fairness metric (paired with your selection of difference or ratio via the toggle) will capture the difference or ratio between the extreme values across the subgroups. (max - min or max/min).

Note
The Fairness assessment is currently only available for categorical sensitive attributes such as gender.
The Causal analysis section answers real-world "what if" questions about how changes of treatments would impact a real-world outcome. If the causal component is activated in the Responsible AI dashboard for which you're generating a scorecard, no more configuration is needed.

The Interpretability section generates human-understandable descriptions for predictions made by of your machine learning model. Using model explanations, you can understand the reasoning behind decisions made by your model. Select a number (K) below to see the top K important features impacting your overall model predictions. The default value for K is 10.

Lastly, configure your experiment to kick off a job to generate your scorecard. These configurations are the same as the ones for your Responsible AI dashboard.
Finally, review your configurations and select Create to start your job!
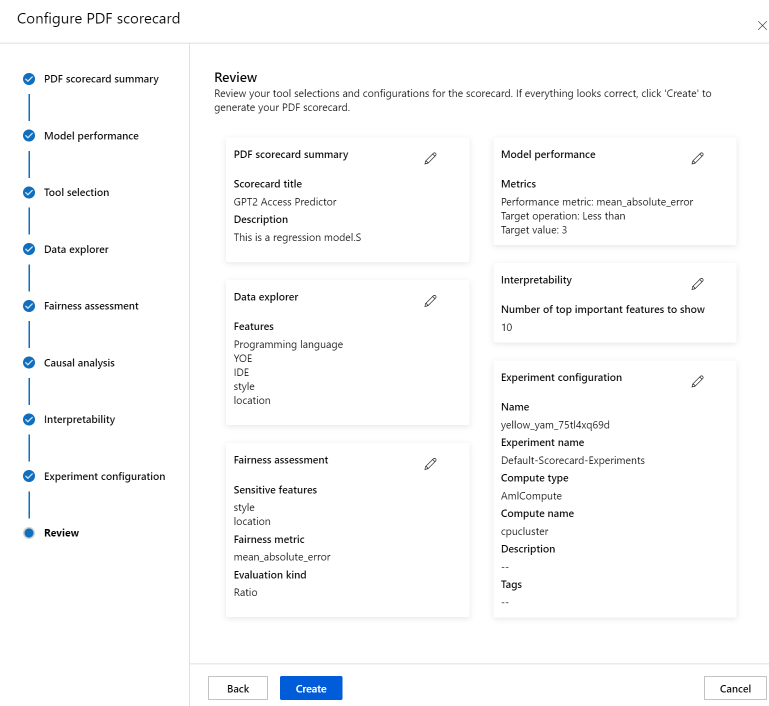
You'll be redirected to the experiment page to track the progress of your job once you've started it. To learn how to view and use your Responsible AI scorecard, see Use Responsible AI scorecard (preview).


Next steps
- After you've generated your Responsible AI dashboard, view how to access and use it in Azure Machine Learning studio.
- Learn more about the concepts and techniques behind the Responsible AI dashboard.
- Learn more about how to collect data responsibly.
- Learn more about how to use the Responsible AI dashboard and scorecard to debug data and models and inform better decision-making in this tech community blog post.
- Learn about how the Responsible AI dashboard and scorecard were used by the UK National Health Service (NHS) in a real life customer story.
- Explore the features of the Responsible AI dashboard through this interactive AI Lab web demo.
Feedback
Coming soon: Throughout 2024 we will be phasing out GitHub Issues as the feedback mechanism for content and replacing it with a new feedback system. For more information see: https://aka.ms/ContentUserFeedback.
Submit and view feedback for