Monitor Azure Service Bus
When you have critical applications and business processes relying on Azure resources, you want to monitor those resources for their availability, performance, and operation. This article describes the monitoring data generated by Azure Service Bus and how to analyze and alert on this data with Azure Monitor.
What is Azure Monitor?
Azure Service Bus creates monitoring data using Azure Monitor, which is a full stack monitoring service in Azure. Azure Monitor provides a complete set of features to monitor your Azure resources. It can also monitor resources in other clouds and on-premises.
Start with the article Monitoring Azure resources with Azure Monitor, which describes the following concepts:
- What is Azure Monitor?
- Costs associated with monitoring
- Monitoring data collected in Azure
- Configuring data collection
- Standard tools in Azure for analyzing and alerting on monitoring data
The following sections build on this article by describing the specific data gathered for Azure Service Bus. These sections also provide examples for configuring data collection and analyzing this data with Azure tools.
Tip
To understand costs associated with Azure Monitor, see Azure Monitor cost and usage. To understand the time it takes for your data to appear in Azure Monitor, see Log data ingestion time.
Monitoring data from Azure Service Bus
Azure Service Bus collects the same kinds of monitoring data as other Azure resources that are described in Monitoring data from Azure resources.
See Azure Service Bus monitoring data reference for a detailed reference of the logs and metrics created by Azure Service Bus.
Collection and routing
Platform metrics and the activity log are collected and stored automatically, but can be routed to other locations by using a diagnostic setting.
Resource Logs aren't collected and stored until you create a diagnostic setting and route them to one or more locations.
See Create diagnostic setting to collect platform logs and metrics in Azure for the detailed process for creating a diagnostic setting using the Azure portal, CLI, or PowerShell. When you create a diagnostic setting, you specify which categories of logs to collect. The categories for Azure Service Bus are listed in Azure Service Bus monitoring data reference.
Note
Azure Monitor doesn't include dimensions in the exported metrics data, that's sent to a destination like Azure Storage, Azure Event Hubs, Log Analytics, etc.
Azure Storage
The diagnostic logging information is stored in containers named insights-logs-operationlogs and insights-metrics-pt1m.
Sample URL for an operation log: https://<Azure Storage account>.blob.core.windows.net/insights-logs-operationallogs/resourceId=/SUBSCRIPTIONS/<Azure subscription ID>/RESOURCEGROUPS/<Resource group name>/PROVIDERS/MICROSOFT.SERVICEBUS/NAMESPACES/<Namespace name>/y=<YEAR>/m=<MONTH-NUMBER>/d=<DAY-NUMBER>/h=<HOUR>/m=<MINUTE>/PT1H.json. The URL for a metric log is similar.
Azure Event Hubs
The diagnostic logging information is stored in event hubs named insights-logs-operationlogs and insights-metrics-pt1m. You can also select your own event hub.
Log Analytics
The diagnostic logging information is stored in tables named AzureDiagnostics and AzureMetrics.
Sample operational log output (formatted)
{
	"Environment": "PROD",
	"Region": "East US",
	"ScaleUnit": "PROD-BL2-002",
	"ActivityId": "a097a88a-33e5-4c9c-9c64-20f506ec1375",
	"EventName": "Retrieve Namespace",
	"resourceId": "/SUBSCRIPTIONS/<Azure subscription ID>/RESOURCEGROUPS/SPSBUS0213RG/PROVIDERS/MICROSOFT.SERVICEBUS/NAMESPACES/SPSBUS0213NS",
	"SubscriptionId": "<Azure subscription ID>",
	"EventTimeString": "5/18/2021 3:25:55 AM +00:00",
	"EventProperties": "{\"SubscriptionId\":\"<Azure subscription ID>\",\"Namespace\":\"spsbus0213ns\",\"Via\":\"https://spsbus0213ns.servicebus.windows.net/$Resources/topics?api-version=2017-04&$skip=0&$top=100\",\"TrackingId\":\"a097a88a-33e5-4c9c-9c64-20f506ec1375_M8CH3_M8CH3_G8\"}",
	"Status": "Succeeded",
	"Caller": "rpfrontdoor",
	"category": "OperationalLogs"
}
Sample metric log output (formatted)
{
	"count": 1,
	"total": 4,
	"minimum": 4,
	"maximum": 4,
	"average": 4,
	"resourceId": "/SUBSCRIPTIONS/<Azure subscription ID>/RESOURCEGROUPS/SPSBUS0213RG/PROVIDERS/MICROSOFT.SERVICEBUS/NAMESPACES/SPSBUS0213NS",
	"time": "2021-05-18T03:27:00.0000000Z",
	"metricName": "IncomingMessages",
	"timeGrain": "PT1M"
}
Important
Enabling these settings requires additional Azure services (storage account, event hub, or Log Analytics), which may increase your cost. To calculate an estimated cost, visit the Azure pricing calculator.
Note
When you enable metrics in a diagnostic setting, dimension information is not currently included as part of the information sent to a storage account, event hub, or log analytics.
The metrics and logs you can collect are discussed in the following sections.
Analyzing metrics
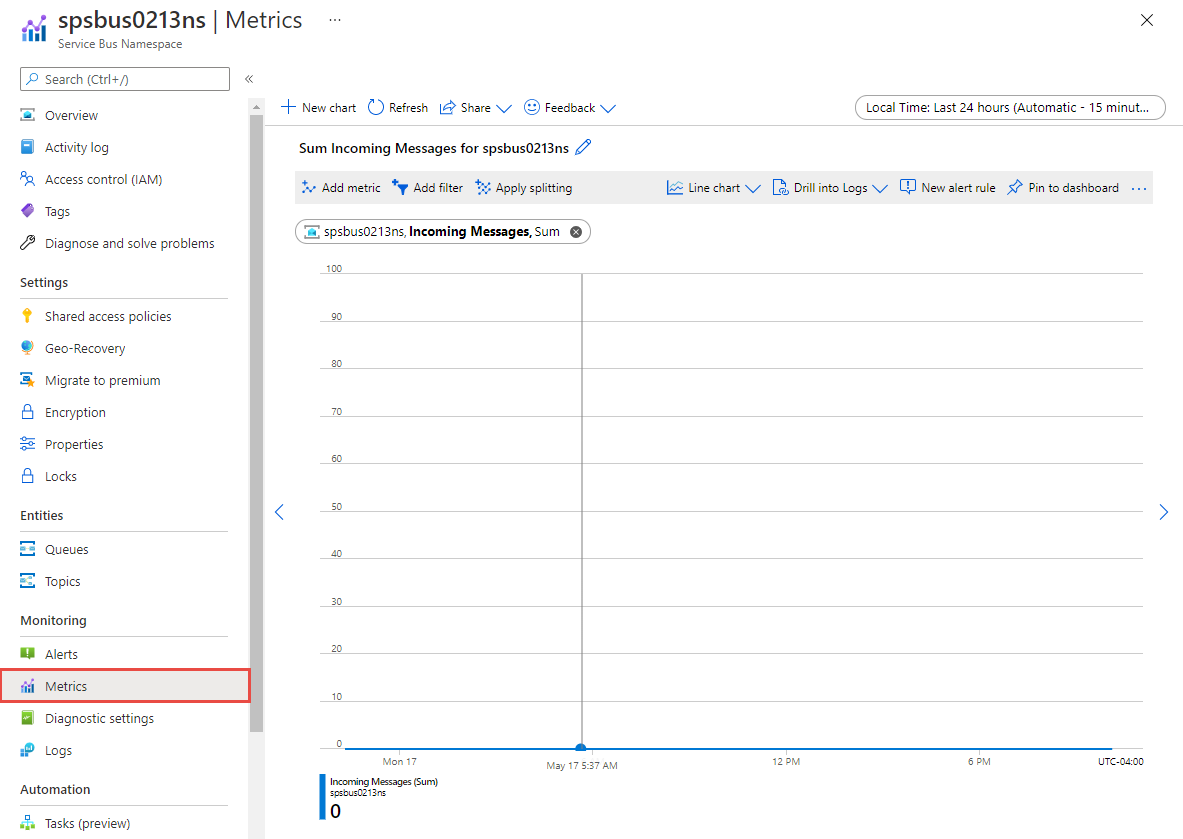
You can analyze metrics for Azure Service Bus, along with metrics from other Azure services, by selecting Metrics from the Azure Monitor section on the home page for your Service Bus namespace. See Analyze metrics with Azure Monitor metrics explorer for details on using this tool. For a list of the platform metrics collected, see Monitoring Azure Service Bus data reference metrics.
For reference, you can see a list of all resource metrics supported in Azure Monitor.
Tip
Azure Monitor metrics data is available for 90 days. However, when creating charts only 30 days can be visualized. For example, if you want to visualize a 90 day period, you must break it into three charts of 30 days within the 90 day period.
Filtering and splitting
For metrics that support dimensions, you can apply filters using a dimension value. For example, add a filter with EntityName set to the name of a queue or a topic. You can also split a metric by dimension to visualize how different segments of the metric compare with each other. For more information of filtering and splitting, see Advanced features of Azure Monitor.
Analyzing logs
Using Azure Monitor Log Analytics requires you to create a diagnostic configuration and enable Send information to Log Analytics. For more information, see the Collection and routing section. Data in Azure Monitor Logs is stored in tables, with each table having its own set of unique properties.Azure Service Bus has the capability to dispatch logs to either of two destination tables - Azure Diagnostic or Resource specific tables in Log Analytics. For a detailed reference of the logs and metrics, see Azure Service Bus monitoring data reference.
Important
When you select Logs from the Azure Service Bus menu, Log Analytics is opened with the query scope set to the current workspace. This means that log queries will only include data from that resource. If you want to run a query that includes data from other databases or data from other Azure services, select Logs from the Azure Monitor menu. See Log query scope and time range in Azure Monitor Log Analytics for details.
Additional Kusto queries
Following are sample queries that you can use to help you monitor your Azure Service Bus resources:
Get management operations in the last 7 days.
AzureDiagnostics
| where TimeGenerated > ago(7d)
| where ResourceProvider =="MICROSOFT.SERVICEBUS"
| where Category == "OperationalLogs"
| summarize count() by EventName_s, _ResourceId
Get runtime audit logs generated in the last one hour.
AzureDiagnostics
| where TimeGenerated > ago(1h)
| where ResourceProvider =="MICROSOFT.SERVICEBUS"
| where Category == "RuntimeAuditLogs"
Get access attempts to a key vault that resulted in "key not found" error.
AzureDiagnostics
| where ResourceProvider == "MICROSOFT.SERVICEBUS"
| where Category == "Error" and OperationName == "wrapkey"
| project Message, _ResourceId
Get errors from the past 7 days
AzureDiagnostics
| where TimeGenerated > ago(7d)
| where ResourceProvider =="MICROSOFT.SERVICEBUS"
| where Category == "Error"
| summarize count() by EventName_s, _ResourceId
Get operations performed with a key vault to disable or restore the key.
AzureDiagnostics
| where ResourceProvider == "MICROSOFT.SERVICEBUS"
| where (Category == "info" and (OperationName == "disable" or OperationName == "restore"))
| project Message, _ResourceId
Get all the entities that have been autodeleted
AzureDiagnostics
| where ResourceProvider == "MICROSOFT.SERVICEBUS"
| where Category == "OperationalLogs"
| where EventName_s startswith "AutoDelete"
| summarize count() by EventName_s, _ResourceId
Feedback
Coming soon: Throughout 2024 we will be phasing out GitHub Issues as the feedback mechanism for content and replacing it with a new feedback system. For more information see: https://aka.ms/ContentUserFeedback.
Submit and view feedback for