Monitoring and troubleshooting from HANA side
In this article, we'll look at monitoring and troubleshooting your SAP HANA on Azure (Large Instances) using resources provided by SAP HANA.
To analyze problems related to SAP HANA on Azure (Large Instances), you'll want to narrow down the root cause of a problem. SAP has published lots of documentation to help you. FAQs related to SAP HANA performance can be found in the following SAP Notes:
- SAP Note #2222200 – FAQ: SAP HANA Network
- SAP Note #2100040 – FAQ: SAP HANA CPU
- SAP Note #199997 – FAQ: SAP HANA Memory
- SAP Note #200000 – FAQ: SAP HANA Performance Optimization
- SAP Note #199930 – FAQ: SAP HANA I/O Analysis
- SAP Note #2177064 – FAQ: SAP HANA Service Restart and Crashes
SAP HANA alerts
First, check the current SAP HANA alert logs. In SAP HANA Studio, go to Administration Console: Alerts: Show: all alerts. This tab will show all SAP HANA alerts for values (free physical memory, CPU use, and so on) that fall outside the set minimum and maximum thresholds. By default, checks are automatically refreshed every 15 minutes.

CPU
For an alert triggered by improper threshold setting, reset to the default value or a more reasonable threshold value.
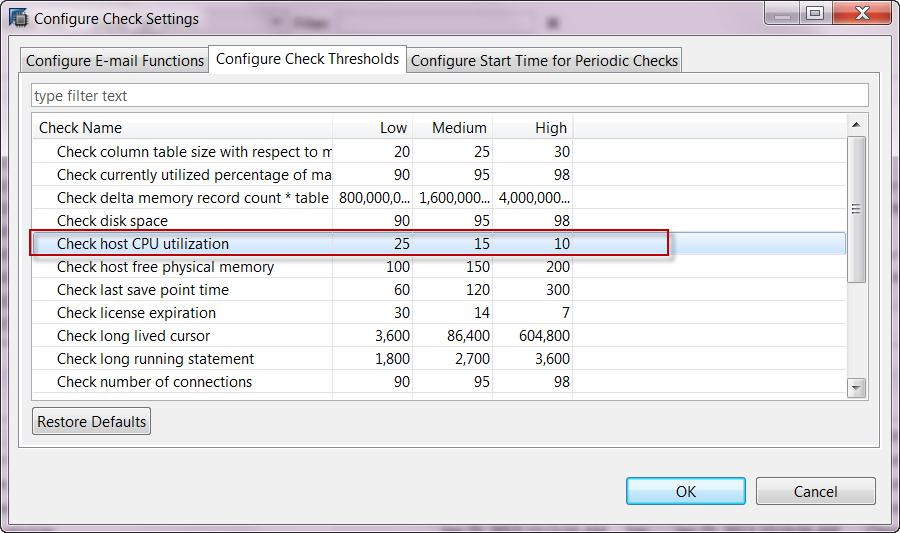
The following alerts may indicate CPU resource problems:
- Host CPU Usage (Alert 5)
- Most recent savepoint operation (Alert 28)
- Savepoint duration (Alert 54)
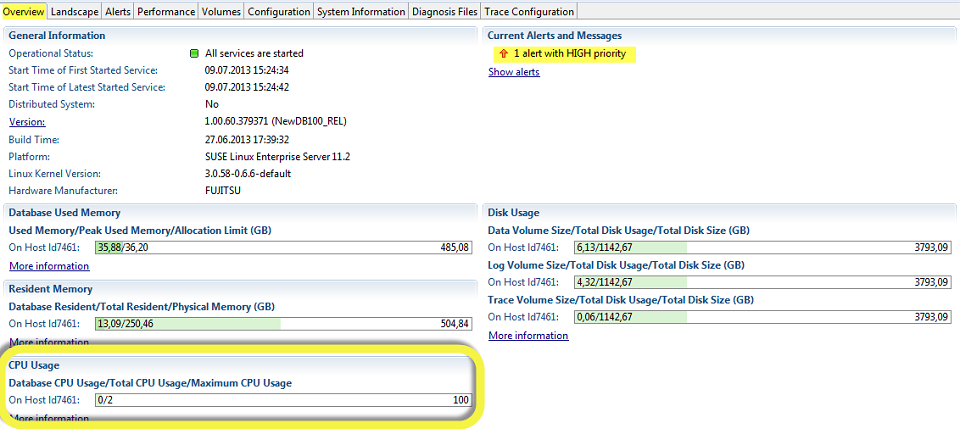
You may notice high CPU consumption on your SAP HANA database from:
- Alert 5 (Host CPU usage) is raised for current or past CPU usage
- The displayed CPU usage on the overview screen
The Load graph might show high CPU consumption, or high consumption in the past:

An alert triggered by high CPU use could be caused by several reasons:
- Execution of certain transactions
- Data loading
- Jobs that aren't responding
- Long-running SQL statements
- Bad query performance (for example, with BW on HANA cubes)
For detailed CPU usage troubleshooting steps, see SAP HANA Troubleshooting: CPU Related Causes and Solutions.
Operating system (OS)
An important check for SAP HANA on Linux is to make sure Transparent Huge Pages are disabled. For more information, see SAP Note #2131662 – Transparent Huge Pages (THP) on SAP HANA Servers.
You can check whether Transparent Huge Pages are enabled through the following Linux command: cat /sys/kernel/mm/transparent_hugepage/enabled
- If always is enclosed in brackets, it means that the Transparent Huge Pages are enabled: [always] madvise never
- If never is enclosed in brackets, it means that the Transparent Huge Pages are disabled: always madvise [never]
The following Linux command should return nothing: rpm -qa | grep ulimit. If it appears ulimit is installed, uninstall it immediately.
Memory
You may observe that the amount of memory allotted to the SAP HANA database is higher than expected. The following alerts indicate issues with high memory usage:
- Host physical memory usage (Alert 1)
- Memory usage of name server (Alert 12)
- Total memory usage of Column Store tables (Alert 40)
- Memory usage of services (Alert 43)
- Memory usage of main storage of Column Store tables (Alert 45)
- Runtime dump files (Alert 46)
For detailed memory troubleshooting steps, see SAP HANA Troubleshooting: Root Causes of Memory Problems.
Network
Refer to SAP Note #2081065 – Troubleshooting SAP HANA Network and do the network troubleshooting steps in this SAP Note.
Analyzing round-trip time between server and client.
- Run the SQL script HANA_Network_Clients.
Analyze internode communication.
- Run SQL script HANA_Network_Services.
Run Linux command ifconfig (the output shows whether any packet losses are occurring).
Run Linux command tcpdump.
Also, use the open-source IPERF tool (or similar) to measure real application network performance.
For detailed network troubleshooting steps, see SAP HANA Troubleshooting: Network Performance and Connectivity Problems.
Storage
Let's say there are issues with I/O performance. End users may then find applications, or the system as a whole, runs sluggishly, is unresponsive, or can even stop responding. In the Volumes tab in SAP HANA Studio, you can see the attached volumes and what volumes are used by each service.
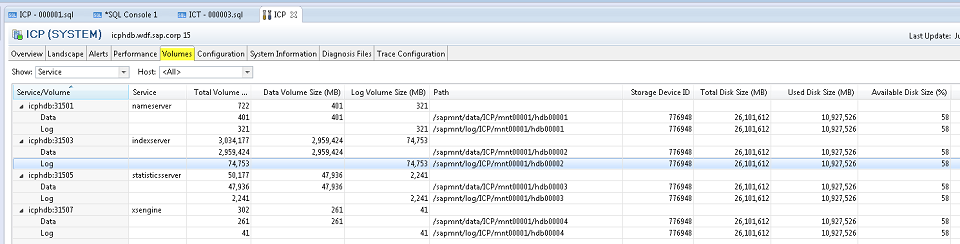
On the lower part of the screen (on the Volumes tab), you can see details of the volumes, such as files and I/O statistics.

For I/O troubleshooting steps, see SAP HANA Troubleshooting: I/O Related Root Causes and Solutions. For disk-related troubleshooting steps, see SAP HANA Troubleshooting: Disk Related Root Causes and Solutions.
Diagnostic tools
Do an SAP HANA Health Check through HANA_Configuration_Minichecks. This tool returns potentially critical technical issues that should have already been raised as alerts in SAP HANA Studio.
Refer to SAP Note #1969700 – SQL statement collection for SAP HANA and download the SQL Statements.zip file attached to that note. Store this .zip file on the local hard drive.
In SAP HANA Studio, on the System Information tab, right-click in the Name column and select Import SQL Statements.

Select the SQL Statements.zip file stored locally; a folder with the corresponding SQL statements will be imported. At this point, the many different diagnostic checks can be run with these SQL statements.
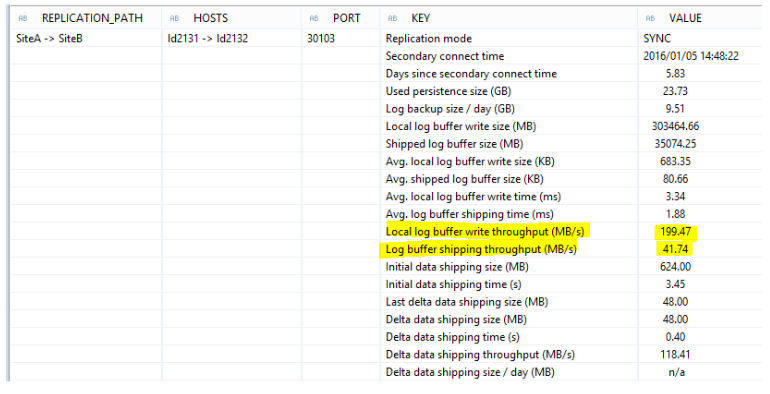
For example, to test SAP HANA System Replication bandwidth requirements, right-click the Bandwidth statement under Replication: Bandwidth and select Open in SQL Console.
The complete SQL statement opens allowing input parameters (modification section) to be changed and then executed.

Another example is to right-click on the statements under Replication: Overview. Select Execute from the context menu:
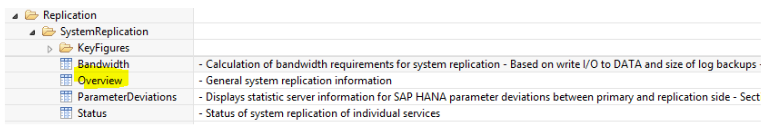
You'll view information helpful with troubleshooting:
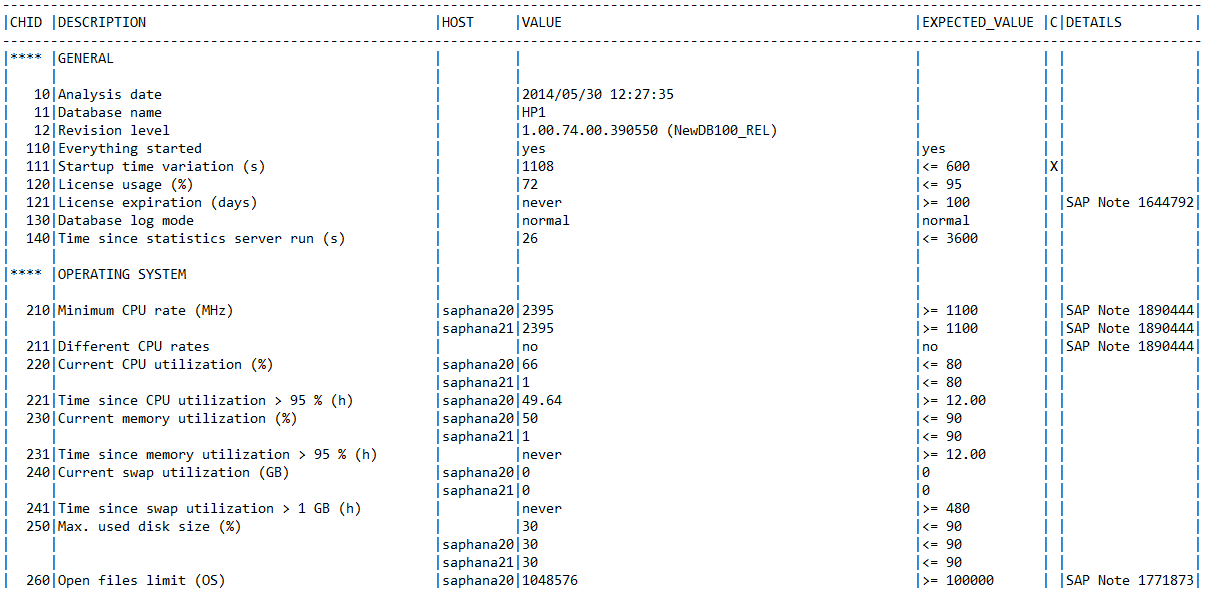
Do the same for HANA_Configuration_Minichecks and check for any X marks in the C (Critical) column.
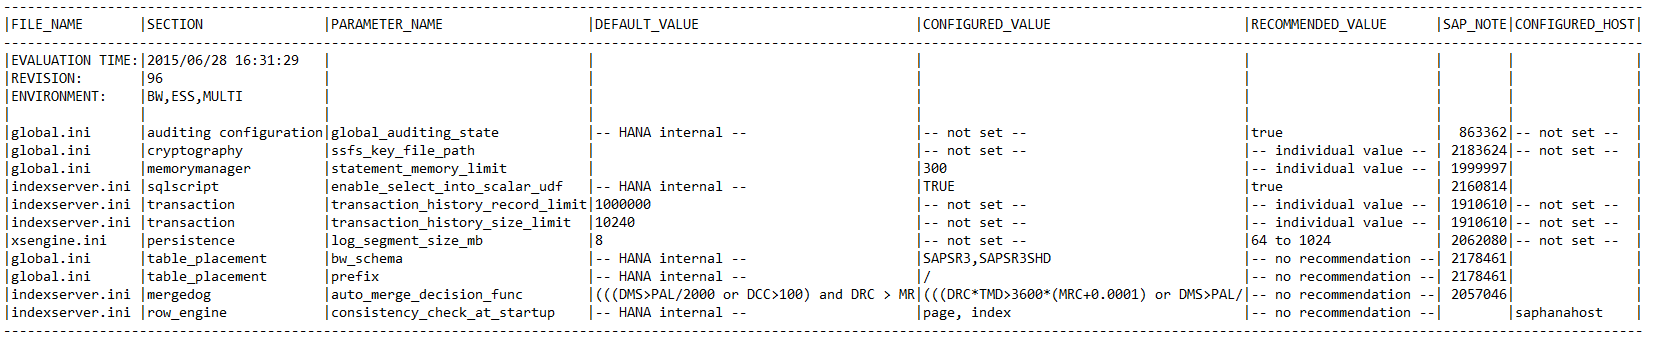
Sample outputs:
HANA_Configuration_MiniChecks_Rev102.01+1 for general SAP HANA checks.
HANA_Services_Overview for an overview of which SAP HANA services are currently running.

HANA_Services_Statistics for SAP HANA service information (CPU, memory, and so on).

HANA_Configuration_Overview_Rev110+ for general information on the SAP HANA instance.

HANA_Configuration_Parameters_Rev70+ to check SAP HANA parameters.
Next steps
Learn how to set up high availability on the SUSE operating system using the fencing device.
Feedback
Coming soon: Throughout 2024 we will be phasing out GitHub Issues as the feedback mechanism for content and replacing it with a new feedback system. For more information see: https://aka.ms/ContentUserFeedback.
Submit and view feedback for