Debug an SDK-first bot
APPLIES TO: SDK v4
This article describes how to debug your bot using an IDE, such as Visual Studio or Visual Studio Code, and the Bot Framework Emulator. Use these methods to debug a bot locally. This article uses an echo bot, such as the one created in the Create a bot quickstart.
Note
In this article, we use the Bot Framework Emulator to send and receive messages from the bot during debugging. If you're looking for other ways to debug your bot using the Bot Framework Emulator, please read the Debug with the Bot Framework Emulator article.
Note
The Bot Framework JavaScript, C#, and Python SDKs will continue to be supported, however, the Java SDK is being retired with final long-term support ending in November 2023. Only critical security and bug fixes within this repository will be undertaken.
Existing bots built with the Java SDK will continue to function.
For new bot building, consider using Power Virtual Agents and read about choosing the right chatbot solution.
For more information, see The future of bot building.
Prerequisites
- Download and install the Bot Framework Emulator.
- Download and install Visual Studio Code or Visual Studio.
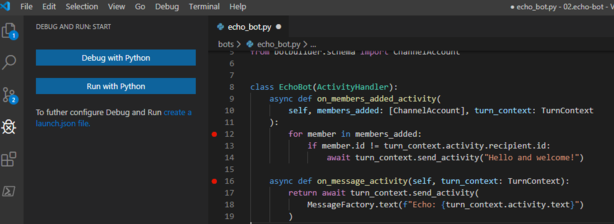
Set C# breakpoints in Visual Studio Code
In Visual Studio Code, you can set breakpoints and run the bot in debug mode to step through your code. To set breakpoints in Visual Studio Code, do the following:
Launch Visual Studio Code and open your bot project folder.
Set breakpoints as necessary. To set a breakpoint, hover your mouse over the column to the left of the line numbers. A small red dot will appear. If you select the dot, the breakpoint is set. If you select the dot again, the breakpoint is removed.
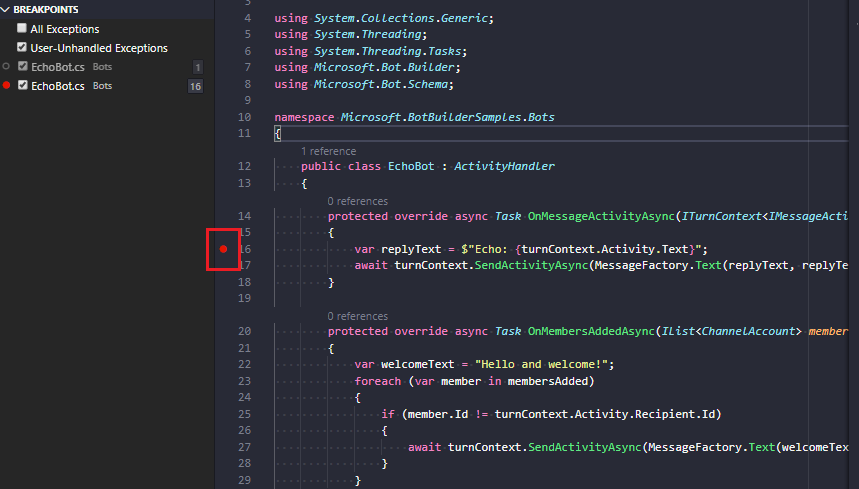
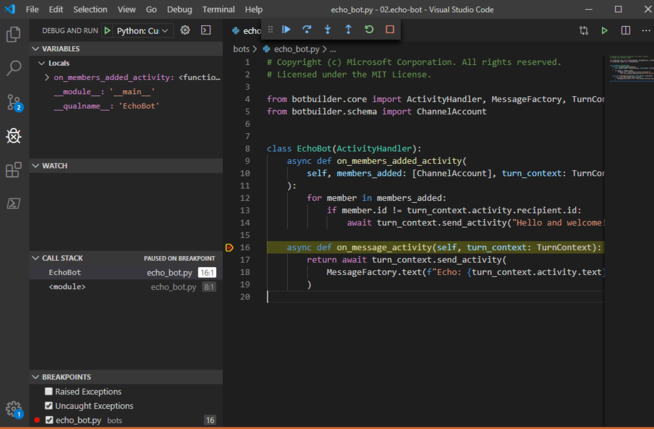
From the menu bar, select Run, then Start Debugging. Your bot will start running in debugging mode from the Terminal in Visual Studio Code.
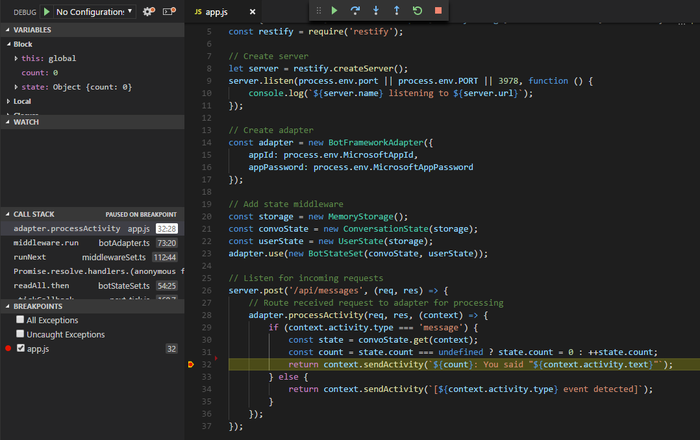
Start the Bot Framework Emulator and connect to your bot as described in how to Debug with the Bot Framework Emulator.
From the Emulator, send your bot a message (for example, send the message "Hi"). Execution will stop at the line where you place the breakpoint.
Set C# breakpoints in Visual Studio
In Visual Studio, you can set breakpoints and run the bot in debug mode to step through your code. To set breakpoints in Visual Studio, do the following:
Navigate to your bot folder and open the .sln file. This will open the solution in Visual Studio.
From the menu bar, select Build and select Build Solution.
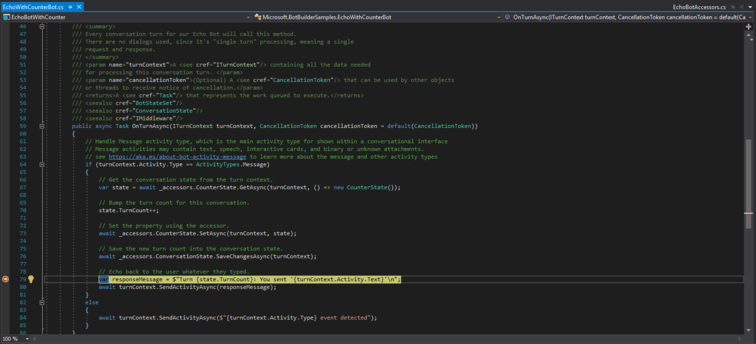
In the Solution Explorer, select the .cs file and set breakpoints as necessary. This file defines your main bot logic. To set a breakpoint, hover your mouse over the column to the left of the line numbers. A small dot will appear. If you select the dot, the breakpoint is set. If you select the dot again, the breakpoint is removed.

From the menu, select Debug, then Start Debugging. At this point, the bot is running locally.
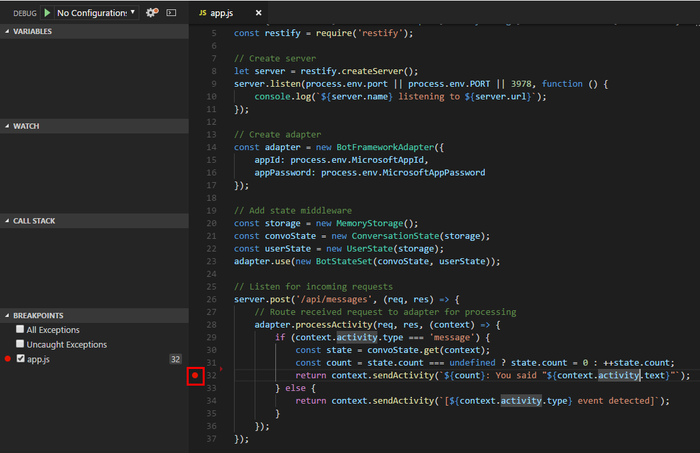
Start the Bot Framework Emulator and connect to your bot as described in the section above.
From the Emulator, send your bot a message, such as "Hi". Execution will stop at the line where you place the breakpoint.


Additional resources
- Troubleshoot bot configuration issues and the other troubleshooting articles in that section.
- Debug with the Emulator.
Next steps
Feedback
Coming soon: Throughout 2024 we will be phasing out GitHub Issues as the feedback mechanism for content and replacing it with a new feedback system. For more information see: https://aka.ms/ContentUserFeedback.
Submit and view feedback for