Create reporting solutions
This tutorial shows how to export data and create a report, expand predefined views and add navigation to charts, use the free-form report designer, and customize the parameter experience.
Prerequisites
For this tutorial, you must access the application environment, and you must be provisioned as an administrator on the instance.
Key concepts
- Describe the various ways reports can be created and consumed
- Add interactivity to embedded aggregate reports in forms and workspaces
- Use framework extensions to customize the parameter experience for SSRS based business documents
- Export List Page data to create reports with external tools including Microsoft Excel
- Author modern report designs using enhanced developer tooling in Visual Studio
What's new in Reporting?
- Embedded report drill-through navigations to AX forms and reports
- Navigate between reports using embedded report drill-through links
- Several Document Routing Service enhancements including support for custom print settings
- Introduced Document Brand Management administrative tools
- Additional visualizations available through the Embedded Charting Control
- Dates and Amounts in the report body are formatted based on the "Date, time, and number format" user setting
- Network Print monitoring form
- Table extensions need to be supported through the VS Query picker
What is a report in Dynamics 365 finance and operations apps?
Reports can be defined simply as any visualization of a structured data set. This may include transactional data presented in a tabular layout and advanced graphical views of aggregate information. To account for this broad definition, the application offers several tools to produce reports to satisfy complex business requirements. Some common applications of reports in an ERP include:
- Creating and archiving transactional documents as part of a posting process
- Producing packing slips for tracking orders from Manufacturing to Warehousing to Sales
- Monitoring key performance metrics and surfacing trends in data
- Navigating the client through filtered searches
- Distributing heavily branded documents to customers and employees
- Extracting data in such a way that it articulates the health of a business
The most difficult task for developers is selecting the right Business Intelligence visualization tool for the job, given a customer's requirements. To accomplish this, it's important to understand the capabilities offered through the tools that are available for creating reports. We offer tooling to support the following basic reporting requirements:
- Excel Integration – Allows data management and analysis using Microsoft Excel
- Embedded Analytics – Add aggregate data to a Workspaces using native controls like charts and grids
- Reporting Services – Create business documents that require precision using SSRS-based solutions
- Power BI Integration – Author and share reports that can be accessed anywhere
- Management Reporter – Designed to help users create financial reports
The following table can be used to compare the basic characteristics of these reporting tools:
| Tool | Author | Target | Data | Consumption | Designer |
|---|---|---|---|---|---|
| Excel | Power User | Power User | Transactional | External | Free form |
| Embedded BI | Developer | All users | Aggregates | Internal | Modeled |
| SSRS Report | Developer | All users | Transactional and Aggregates | Internal/External | Free form |
| Power BI | Power User | All users | Aggregates | Internal/External | Free form |
| Management Reporter | Power User | Power User | Transactional | External | Modeled |
Create a report using List Pages
In this section, we'll walk you through the process of exporting data displayed in an entity details form. Here we'll demonstrate how every form in can be viewed as a source of data for management and analysis using the power of Excel.
Create an analysis report based on all rentals in Fleet Management that are marked as complete
Open Microsoft Edge, and navigate to your instance base URL and sign in.
- On the cloud environment, the base URL is obtained from LCS
- On a local VM, the base URL is
https://usnconeboxax1aos.cloud.onebox.dynamics.com.
On the Dashboard, scroll to the far right, and click the Reservation management tile.
Under the Summary section, click on the All rentals tile.
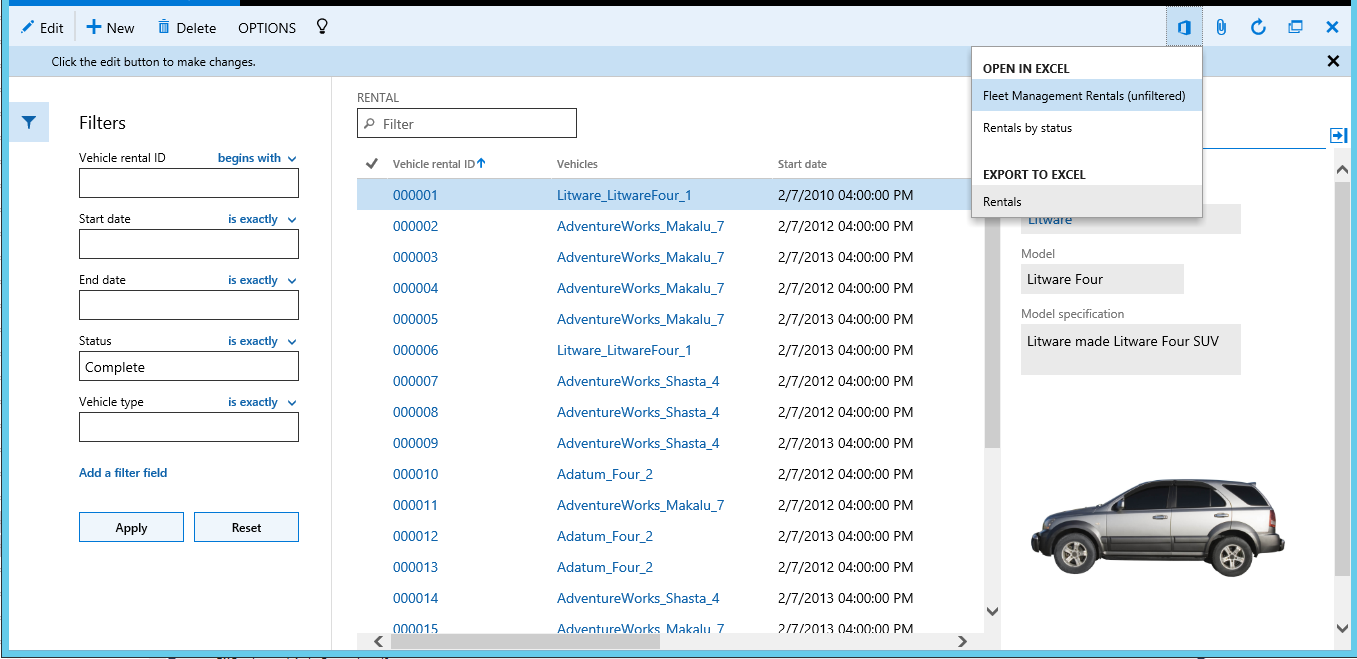
Expand the Filters pane by clicking on the Filters icon next to the main grid.
Click Add a filter field, and then select Status in the drop-down list.
Enter Complete in the Status filter field, and then click Apply.
Expand the page action bar, click Open in Office, and then select Rentals.
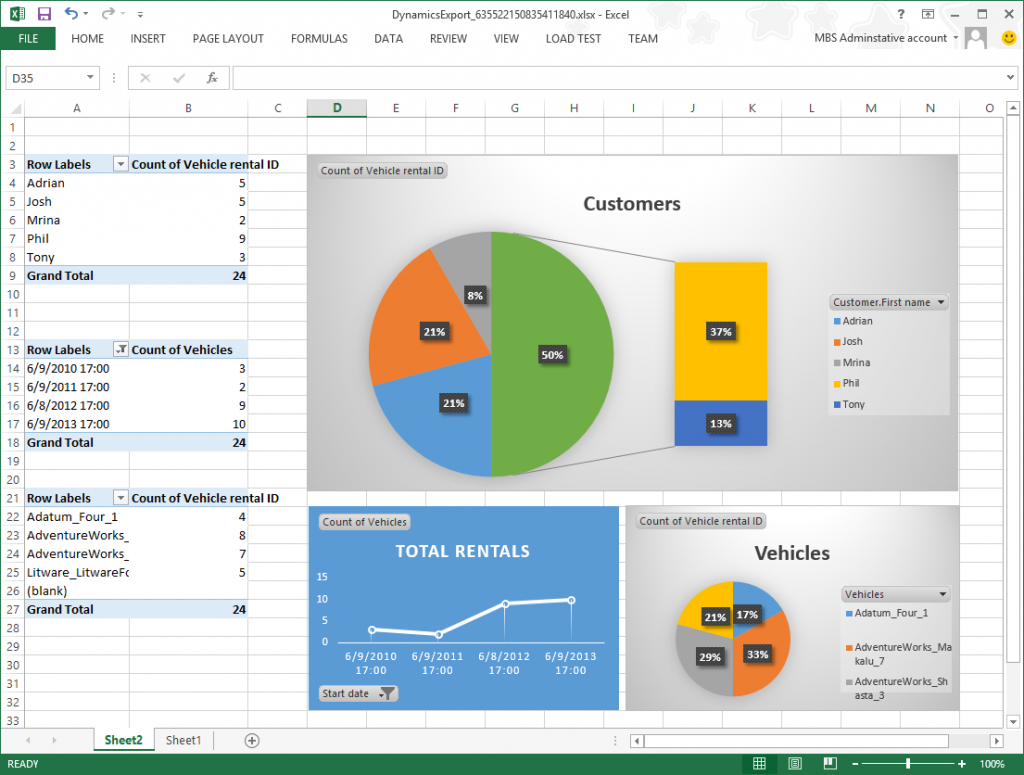
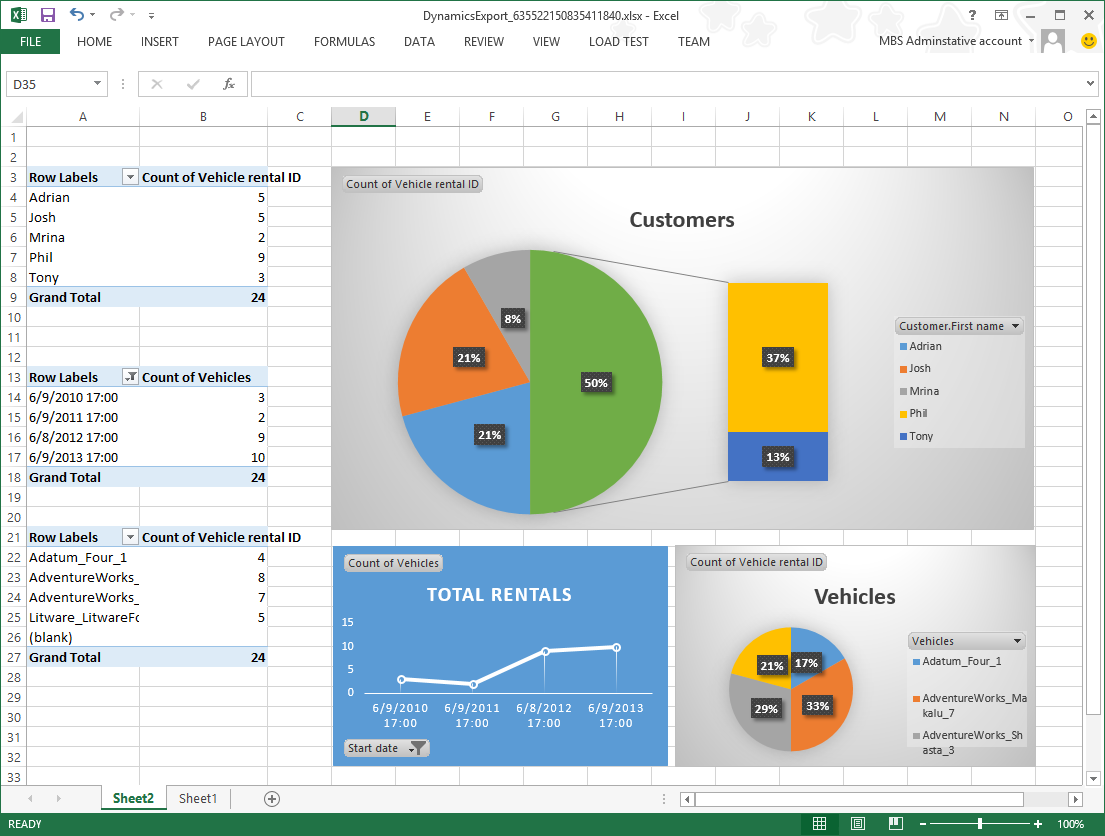
After the data has been exported, you can use the power and flexibility of the Excel tools to create reports for presentation or additional analysis. The following is an example of a self-service report authored with Excel.
Close the browser session and the exported Excel file.
Advantages of List Pages
- Flexible source for accessing transactional business data using external reporting and analytical tools like Excel
- Allows end-users to model the data sets they need without requiring a developer
- Direct access to real-time business information
Expand predefined views and add navigation to charts
Business Intelligence can be useful at every level of an organization. Use embedded controls to elevate the most relevant information based on the target persona. Native controls offer users an intuitive and convenient way of interacting with aggregate data allowing for informed decision making.
Create development project
On the Desktop, right-click the Visual Studio shortcut, and select Run as administrator to open the development environment.
On the toolbar, click View, and then select Application Explorer
Use the Application Explorer to search for the FMReservationsReport form in the Fleet Management module.
In the Application Explorer's search results, right-click FMReservationsReport form, and then select Add to new project.
Select the finance and operations Project template, and then click OK to create the project.
In Solution Explorer, right-click FMReservationsReport menu item, and then select Set as startup object.
Press Ctrl+Shift+B to save and build the project.
Press Ctrl+F5 to load the form containing the report.
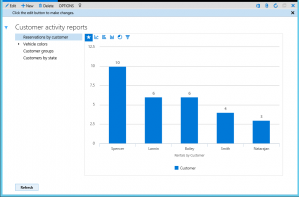
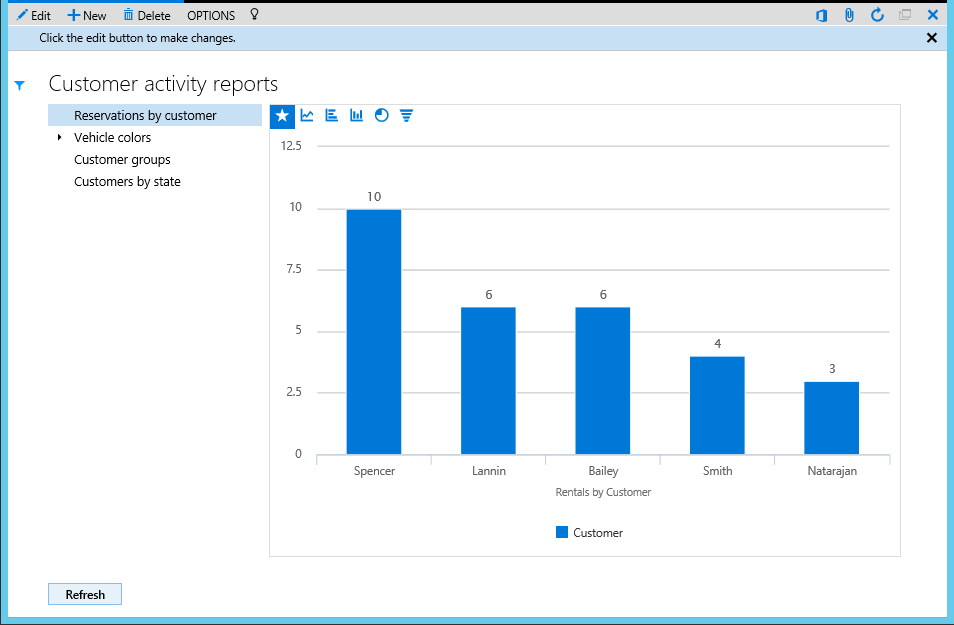
At this point, you have a collection of pre-defined chart visualizations of Aggregate data. The controls offer basic interactive features like hover text, series filtering, and touch expansion. However, it is often appropriate that a greater degree of user interactivity is required.
Change the default chart type for the visualization
- Close the browser session and return to the Visual Studio project.
- Open the Application Explorer, locate the FMReservationsByCustPart form, right-click, and then select Add to project.
- Open the FMReservationsByCustPart form designer.
- Access the Series collection in the ReservationsByCust chart definition.
- Select the SysBuildChatMeasure1 series definition
- Locate the Appearance section in the Properties window.
- Update the Chart type value and select Pie
- Press Ctrl+Shift+B to save and rebuild the project.
- Press Ctrl+F5 to run the report.
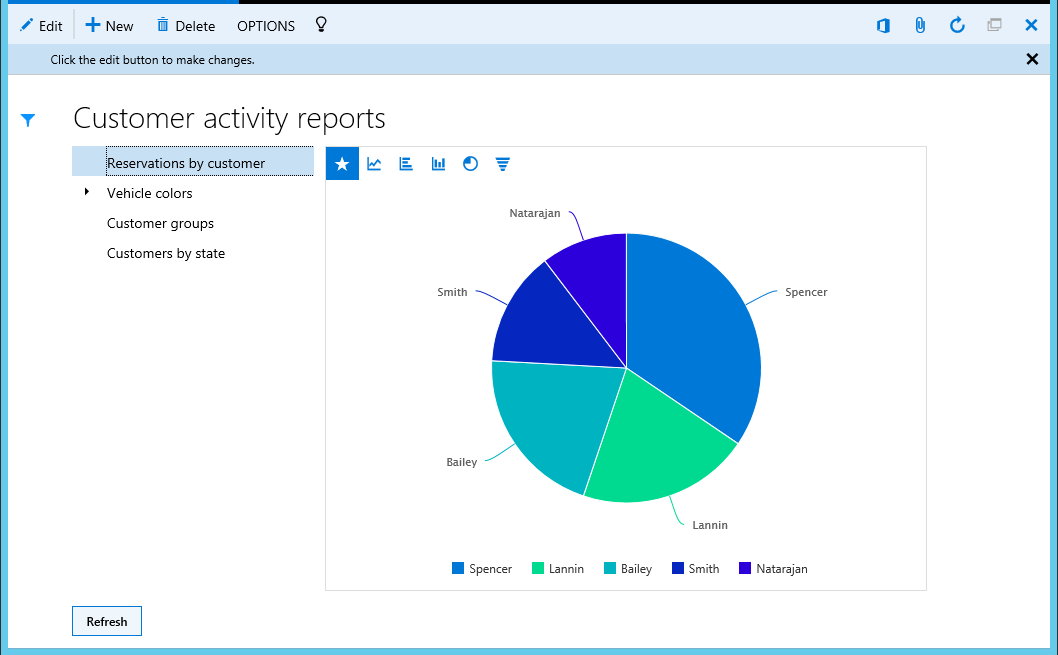
The Reservations by customer view now visualizes the aggregate data set using a Pie chart to simplify the task of comparing rental activity across customers.
Additional functions include:
- Define contextual drill-through navigations using modeled properties
- Manage drill-through links using X++ form logic
Advantages of embedded aggregate visualizations
- Designed to be simple and intuitive to promote informed decisions at every level of the organization
- Pre-defined views tailored to meet the needs of the consumer
- Augments the user's ability to recognize key performance trends in the data
Using the freeform report designer
SSRS continues to be the platform for producing advanced Business Document solutions for your ERP application. The hosted service is designed for high volume and heavily transactional reports with an integrated parameter experience. Backed by the Document Printing & Distribution Services, these solutions are ideal for producing precision documents which are intended for email, printing, archive, and bulk distribution.
Open the Precision Designer
- Close the browser session and return to the Visual Studio project.
- Click File > Close Solution, to close the active project.
- Use the Application Explorer to search for objects with FMRentalsByCust in the name
- In the Application Explorer's search results, select all Classes, the Output Menu Item, and the FMRentalsByCustomer report
- Right-click and then select Add to new project.
- Select the Dynamics 365 template, and then click OK to create the project.
- In Solution Explorer, double-click on the FMRentalsByCustomer report to open the designer.
- Expand the Designs collection in the designer to view the list of design definitions
- Double-click on the Report design to view the report definition using the Precision Designer
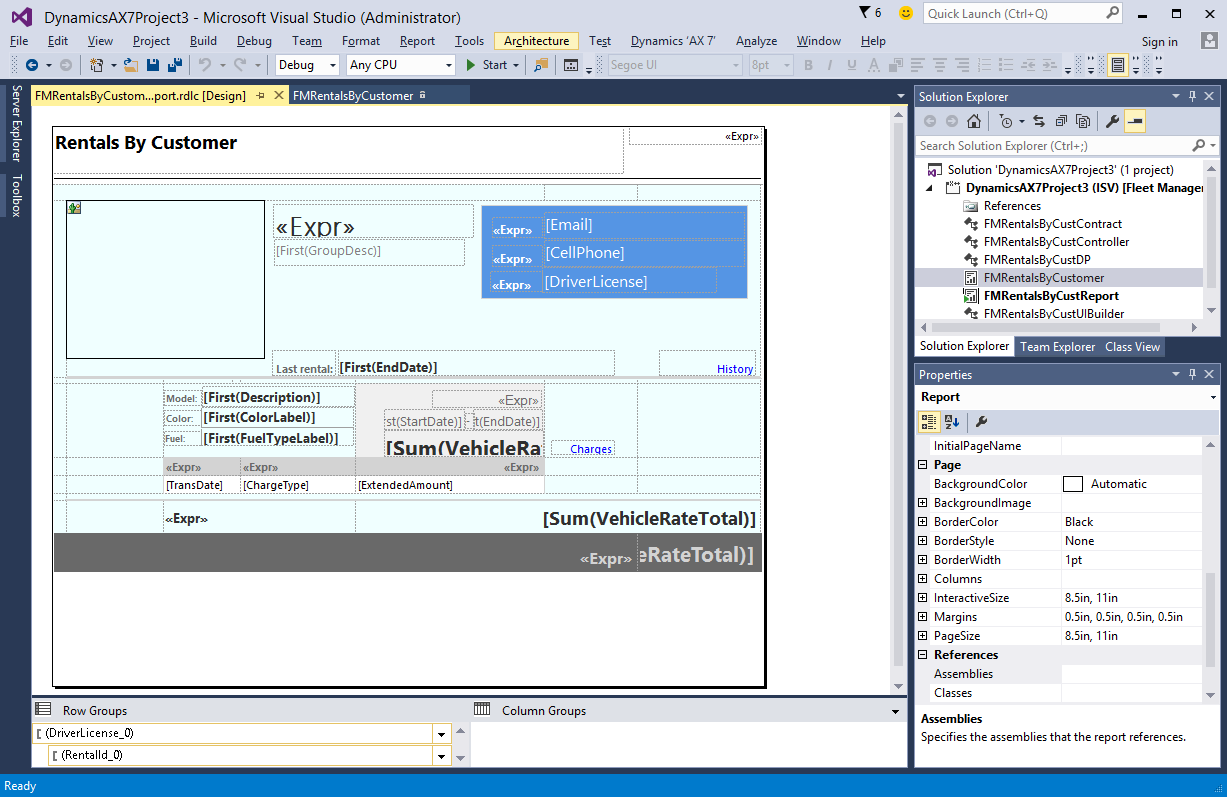
The above is a screen-shot of the FMRentalsByCustomer report design definition as viewed using the Visual Studio Precision Designer. The Precision Designer offers a free-form design surface with built-in tools that allow you to customize the content and layout of the report. You can also take advantage of embedded VB code to create run-time design manipulations and support user interactions. As an integrated tool, developers are able to reference AX labels and public APIs to format data in the report body based on AX EDTs. MSDN offers a rich collection of developer documentation related to SSRS formatting capabilities. See the article Reporting Services Reports (SSRS) on for a good primer on designing effective SSRS reports.
Customizing the parameter experience
The Reporting Framework offers flexibility through service extensions to facilitate advanced solutions with requirements that cannot be addressed using a modeled solution. Use the VS designer to add basic parameter formatting, grouping, and input validation. X++ based data contract validation is available for more advanced scenarios. Consider adding User Interface (UI) Builder Classes to customize the parameter pane used to prompt for session inputs before running a report. These custom extensions are effective for addressing the following functions:
- Overriding dialog field events
- Validating report parameters inline
- Adding customized lookups to dialog fields
- Changing the layout of the dialog controls
- Adding custom controls including images
Defining parameters defaulting using code
In Solution Explorer, double-click on the FMRentalsByCustUIBuilder class to open the designer.
Locate the class build method and update the initialization code as follows
public void build()
{
    Dialog dialogLocal = this.dialog();
    contract = this.dataContractObject() as FMRentalsByCustContract;// associate dialog field with data contract method
    this.addDialogField(methodStr(FMRentalsByCustContract, parmCustGroupId), contract);dialogLocal.addGroup("@SYS41297");
    fromDateField = this.addDialogField(methodStr(FMRentalsByCustContract, parmFromDate), contract);
    toDateField = this.addDialogField(methodStr(FMRentalsByCustContract, parmToDate), contract);// set the default date range values
    fromDateField.value(today() - 365);
    toDateField.value(today());
}
Press Ctrl+Shift+B to save and rebuild the project.
Press Ctrl+F5 to run the report.
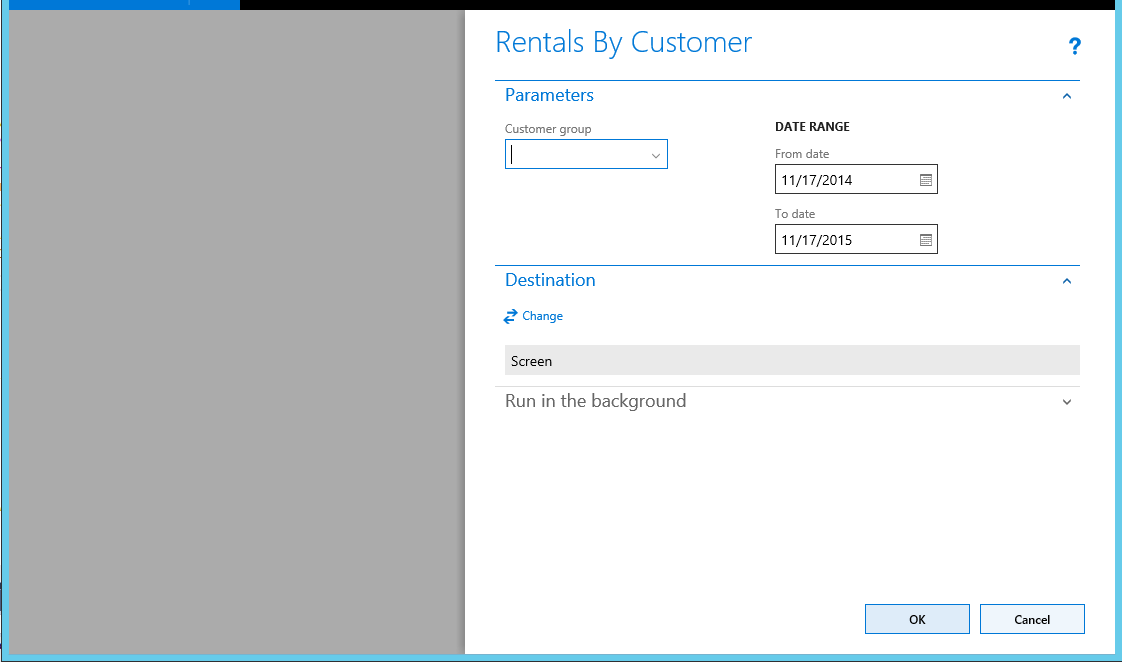
The parameter initialization code above sets the default values of the report execution relative to today's date. Use the classes UIBuilder to override the framework's default handling of report parameters. Additional extension scenarios supported:
- Automatically set query ranges based on session context using Controller classes
- Select report designs at runtime using a shared menu item
- Modify report data contract values using business logic
Note
This example demonstrates a UIBuilder extension with an RDP-based based report. For a Query based example that includes a UIBuilder extension, view the FMCustomerList report.
Using VB code to manage running balances
The Reporting Framework offers flexibility through service extensions to facilitate advanced solutions with requirements that cannot be addressed using a modeled solution. Use the VS designer to add basic parameter formatting, grouping, and input validation. X++ based data contract validation is available for more advanced scenarios. Consider adding User Interface (UI) Builder Classes to customize the parameter pane used to prompt for session inputs before running a report. These custom extensions are effective for addressing the following functions:
- Overriding dialog field events
- Validating report parameters inline
- Adding customized lookups to dialog fields
- Changing the layout of the dialog controls
- Adding custom controls including images
Import the section resources
- Close the browser session and return to the Visual Studio project.
- On the toolbar, click DYNAMICS AX, and then select Import Project…
- In the File name window, browse to C:\FmLab\Lab10-3, select FMRentalDetailsReport.axpp, and then click Open.
- In the Project file location text box, enter C:\FmLab\Lab10-3.
- Select the Current solution radio button.
- Click OK to close. Wait for the project to be imported and opened.
- In the Solution Explorer, select the new project, right-click, and then select Set as startup project.
- In the Solution Explorer, right-click FMRentalDetails menu item, and then select Set as startup object.
- Select the Project in Solution Explorer, right-click, and then select Deploy Reports
- Press Ctrl+F5 to view the report.

This report uses embedded VB script to keep track of running totals so that the balances from the previous page can be referenced on the active page. To inspect report's VB code, load the report design in the Precision Designer, access the Report Properties, and then select the Code section. Here you'll see several functions referenced by the report designs to surface running balances within the report headers and footers.
Advantages of SSRS reports
- Built-in back office document management capabilities including email support, scheduled executions via Batch, and Print Archive
- Parameterized views with drill-through navigations to forms and other reports
- Used to produce precision documents for compliance with local regulatory business practices
Váš názor
Připravujeme: V průběhu roku 2024 budeme postupně vyřazovat problémy z GitHub coby mechanismus zpětné vazby pro obsah a nahrazovat ho novým systémem zpětné vazby. Další informace naleznete v tématu: https://aka.ms/ContentUserFeedback.
Odeslat a zobrazit názory pro