Tutorial: Create a basic table report (Report Builder)
This tutorial teaches you to create a basic table report based on sample sales data. The following illustration shows the report you create in this tutorial.
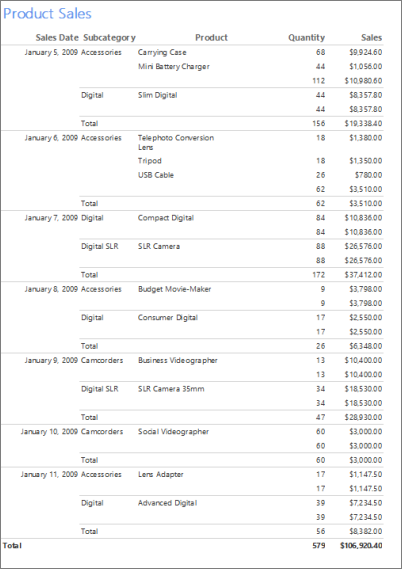
Estimated time to complete this tutorial: 20 minutes.
Requirements
For more information about requirements, see Prerequisites for tutorials (Report Builder).
1. Create a report by using a wizard
Create a table report with the Table or Matrix wizard. There are two modes: report design and shared dataset design. In report design mode, you specify data in the Report Data pane and the report layout on the design surface. In shared dataset design mode, you create dataset queries to share with others. In this tutorial, you use report design mode.
Create a report
Start Report Builder either from your computer, the Reporting Services web portal, or SharePoint integrated mode.
The New Report or Dataset dialog box opens.
If you don't see the New Report or Dataset dialog box, on the File menu > New.
In the left pane, verify that New Report is selected.
In the right pane, select Table or Matrix Wizard.
1a. Specify a data connection in the Table Wizard
A data connection contains the information to connect to an external data source such as a SQL Server database. Usually, you get the connection information and the type of credentials to use from the data source owner. To specify a data connection, you can use a shared data source from the report server or create an embedded data source that is used only in this report.
In this tutorial, you use an embedded data source. To learn more about using a shared data source, see Alternative ways to get a data connection (Report Builder).
Create an embedded data source
On the Choose a dataset page, select Create a dataset, and then choose Next. The Choose a connection to a data source page opens.
Select New. The Data Source Properties dialog box opens.
In Name, enter Product_Sales a name for the data source.
In Select a connection type, verify that Microsoft SQL Server is selected.
In Connection string, enter the following text, where <servername> is the name of an instance of SQL Server:
Data Source=<servername>Because you use a query that contains the data instead of retrieving the data from a database, the connection string doesn't include the database name. For more information, see Prerequisites for tutorials (Report Builder).
Select the Credentials tab. Enter the credentials that you need to access the external data source.
Select the General tab again. To verify that you can connect to the data source, choose Test Connection.
The message "Connection created successfully" appears.
Select OK.
You're back on the Choose a connection to a data source page, with your new data source selected.
Select Next.
1b. Create a query in the Table Wizard
In a report, you can use a shared dataset that has a predefined query, or you can create an embedded dataset for use only in this one report. In this tutorial, you create an embedded dataset.
Note
In this tutorial, the query contains the data values, so that it does not need an external data source. This makes the query quite long. In a business environment, a query would not contain the data. This is for learning purposes only.
Create a query
On the Design a query page, the relational query designer is open. For this tutorial, you use the text-based query designer.
Select Edit As Text. The text-based query designer displays a query pane and a results pane.
Paste the following Transact-SQL query into the blank upper box.
SELECT CAST('2009-01-05' AS date) as SalesDate, 'Accessories' as Subcategory,
   'Carrying Case' as Product, CAST(9924.60 AS money) AS Sales, 68 as Quantity
UNION SELECT CAST('2009-01-06' AS date) as SalesDate, 'Accessories' as Subcategory,
   'Tripod' as Product, CAST(1350.00 AS money) AS Sales, 18 as Quantity
UNION SELECT CAST('2009-01-11' AS date) as SalesDate, 'Accessories' as Subcategory,
   'Lens Adapter' as Product, CAST(1147.50 AS money) AS Sales, 17 as Quantity
UNION SELECT CAST('2009-01-05' AS date) as SalesDate, 'Accessories' as Subcategory,
   'Mini Battery Charger' as Product, CAST(1056.00 AS money) AS Sales, 44 as Quantity
UNION SELECT CAST('2009-01-06' AS date) as SalesDate,  'Accessories' as Subcategory,
   'Telephoto Conversion Lens' as Product, CAST(1380.00 AS money) AS Sales, 18 as Quantity
UNION SELECT CAST('2009-01-06' AS date) as SalesDate,'Accessories' as Subcategory,
   'USB Cable' as Product, CAST(780.00 AS money) AS Sales, 26 as Quantity
UNION SELECT CAST('2009-01-08' AS date) as SalesDate, 'Accessories' as Subcategory,
   'Budget Movie-Maker' as Product, CAST(3798.00 AS money) AS Sales, 9 as Quantity
UNION SELECT CAST('2009-01-09' AS date) as SalesDate, 'Camcorders' as Subcategory,
   'Business Videographer' as Product, CAST(10400.00 AS money) AS Sales, 13 as Quantity
UNION SELECT CAST('2009-01-10' AS date) as SalesDate, 'Camcorders' as Subcategory,
   'Social Videographer' as Product, CAST(3000.00 AS money) AS Sales, 60 as Quantity
UNION SELECT CAST('2009-01-11' AS date) as SalesDate,  'Digital' as Subcategory,
   'Advanced Digital' as Product, CAST(7234.50 AS money) AS Sales, 39 as Quantity
UNION SELECT CAST('2009-01-07' AS date) as SalesDate,  'Digital' as Subcategory,
   'Compact Digital' as Product, CAST(10836.00 AS money) AS Sales, 84 as Quantity
UNION SELECT CAST('2009-01-08' AS date) as SalesDate,  'Digital' as Subcategory,
   'Consumer Digital' as Product, CAST(2550.00 AS money) AS Sales, 17 as Quantity
UNION SELECT CAST('2009-01-05' AS date) as SalesDate, 'Digital' as Subcategory,
   'Slim Digital' as Product, CAST(8357.80 AS money) AS Sales, 44 as Quantity
UNION SELECT CAST('2009-01-09' AS date) as SalesDate, 'Digital SLR' as Subcategory,
   'SLR Camera 35mm' as Product, CAST(18530.00 AS money) AS Sales, 34 as Quantity
UNION SELECT CAST('2009-01-07' AS date) as SalesDate, 'Digital SLR' as Subcategory,
   'SLR Camera' as Product, CAST(26576.00 AS money) AS Sales, 88 as Quantity
On the query designer toolbar, select Run (!).
The query runs and displays the result set for the fields SalesDate, Subcategory, Product, Sales, and Quantity.
In the result set, the column headings are based on the names in the query. In the dataset, the column headings become the field names, and are saved in the report. After you complete the wizard, you can use the Report Data pane to view the collection of dataset fields.
Select Next.
1c. Organize data into groups in the Table Wizard
When you select fields to group on, you design a table that has rows and columns that display detail data and aggregated data.
Organize data into groups
On the Arrange fields page, drag Product to Values.
Drag Quantity to Values and place it after Product.
The Sum function automatically aggregates Quantity, the default aggregate for numeric fields. The value is [Sum(Quantity)].
Select the arrow next to [Sum(Quantity)] to view the other aggregate functions available. Don't change the aggregate function.
Drag Sales to Values, and place it after [Sum(Quantity)].
The Sum function aggregates Sales. The value is [Sum(Sales)].
Steps 1, 2, and 3 specify the data to display in the table.
Drag SalesDate to Row groups.
Drag Subcategory to Row groups, and place it after SalesDate.
Steps 4 and 5 organize the values for the fields first by date, and then by product subcategory for that date.
Select Next.
1d. Add subtotal and total rows in the Table Wizard
After you create groups, you can add and format rows on which to display aggregate values for the fields. You can choose whether to show all the data or to let a user expand and collapse grouped data interactively.
Add subtotals and totals
On the Choose the layout page, under Options, verify that Show subtotals and grand totals is selected.
Verify that Blocked, subtotal below is selected.
The wizard Preview pane displays a table with five rows. When you run the report, each row displays in the following way:
The first row repeats once for the table to show column headings.
The second row repeats once for each line item in the sales order and displays the product name, order quantity, and line total.
The third row repeats once for each sales order category to display subtotals per category.
The fourth row repeats once for each order date to display the subtotals per day.
The fifth row repeats once for the table to display the grand totals.
Clear the option Expand/collapse groups. In this tutorial, the report you create doesn't use the drilldown feature that lets a user expand a parent group hierarchy to display child group rows and detail rows.
Select Next to preview the table, then choose Finish.
The table is added to the design surface. The table has five columns and five rows. The Row Groups pane shows three row groups: SalesDate, Subcategory, and Details. Detail data is all the data that the dataset query retrieves.
2. Format data as currency
By default, the summary data for the Sales field displays a general number. Format it to display the number as currency.
Format a currency field
To see formatted text boxes and placeholder text as sample values in Design View, on the Home tab, in the Number group, select the arrow next to the Placeholder Styles icon > Sample Values.
Select the cell in the second row (under the column headings row) in the Sales column and drag down to select all cells that contain
[Sum(Sales)].On the Home tab, in the Number group, select the Currency button. The cells change to show the formatted currency.
If your regional setting is English (United States), the default sample text is [$12,345.00]. If you don't see an example currency value, on the Home tab, in the Number group, select the arrow next to the Placeholder Styles icon > Sample Values.
Select Run to preview your report.
The summary values for Sales display as currency.
3. Format data as date
By default, the SalesDate field displays both date and time. You can format them to display only the date.
Format a date field as the default format
Select Design to return to design view.
Select the cell that contains
[SalesDate].On the Ribbon, on the Home tab, in the Number group, select the arrow and choose Date.
The cell displays the example date [1/31/2000]. If you don't see an example date, on the Home tab, in the Number group, select the arrow next to the Placeholder Styles icon > Sample Values.
Select Run to preview the report.
The SalesDate values display in the default date format.
Change the date format to a custom format
Select Design to return to design view.
Select the cell that contains
[SalesDate].On the Home tab, in the Number group, select the arrow in the lower-right corner to open the dialog box.
The Text Box Properties dialog box opens.
In the Category pane, verify that Date is selected.
In the Type pane, select January 31, 2000.
Select OK.
The cell displays the example date [January 31, 2000].
Select Run to preview your report.
The SalesDate value displays the name of the month instead of the number for the month.
4. Change column widths
By default, each cell in a table contains a text box. A text box expands vertically to accommodate text when the page is rendered. In the rendered report, each row expands to the height of the tallest rendered text box in the row. The height of the row on the design surface has no effect on the height of the row in the rendered report.
To reduce the amount of vertical space each row takes, expand the column width to accommodate the expected contents of the text boxes in the column on one line.
Change the width of table columns
Select Design to return to design view.
Select the table so that column and row handles appear above the table and next it
The gray bars along the top and side of the table are the column and row handles.
Point to the line between column handles so that the cursor changes into a double arrow. Drag the columns to the width you want. For example, expand the column for Product so that the product name displays on one line.
Select Run to preview your report.
5. Add a report title
A report title appears at the top of the report. You can place the report title in a report header or if the report doesn't use one, in a text box at the top of the report body. In this tutorial, you use the text box that is automatically placed at the top of the report body.
The text can be further enhanced by applying different font styles, sizes, and colors to phrases and individual characters of the text. For more information, see Format text in a text box in paginated reports (Report Builder).
Add a report title
On the design surface, select Click to add title.
Enter Product Sales, and then select outside the text box.
Right-click the text box that contains Product Sales and select Text Box Properties.
In the Text Box Properties dialog box, select Font.
In the Size list, select 18pt.
In the Color list, select Cornflower Blue.
Select Bold.
Select OK.
6. Save the report
Save the report to a report server or your computer. If you don't save the report to the report server, many Reporting Services features such as subreports aren't available.
Save the report on a report server
Select File > Save As.
Select Recent Sites and Servers.
Select or enter the name of the report server where you have permission to save reports.
The message "Connecting to report server" appears. When the connection is complete, you see the contents of the report folder that the report server administrator specified as the default location for reports.
In Name, replace Untitled with Product_Sales.
Select Save.
The report is saved to the report server. The name of the report server that you're connected to appears in the status bar at the bottom of the window.
Save the report on your computer
Select File > Save As.
Select Desktop, My Documents, or My computer, and browse to the folder where you want to save the report.
In Name, replace Untitled with Product Sales.
Select Save.
7. Export the report
Reports can be exported to different formats such Microsoft Excel and comma separated value (CSV) files. For more information, see Export paginated reports (Report Builder).
In this tutorial, you export the report to Excel and set a property on the report to provide a custom name for the workbook tab.
Specify the workbook tab name
Select Design to return to design view.
Select anywhere on the design surface, outside the report.
In the Properties pane, locate the InitialPageName property and enter Product Sales Excel.
Note
If the Properties pane is not visible, on the View tab, select Properties.
If you don't see a property in the Properties pane, try selecting the Alphabetical button at the top of the pane to order all the properties alphabetically.
Export a report to Excel
Select Run to preview the report.
On the ribbon, select Export > Excel.
In the Save As dialog box, browse to where you want to save the file.
In the File name box, enter Product_Sales_Excel.
Verify that the file type is Excel (*.xlsx).
Select Save.
View the report in Excel
Open the folder where you save the workbook and double-click Product_Sales_Excel.xlsx.
Verify that the name of the workbook tab is Product Sales Excel.
Next step
You successfully completed the tutorial for how to create a basic table report. For more information about tables, see Tables, matrices, and lists in paginated reports (Report Builder).
Related content
Váš názor
Připravujeme: V průběhu roku 2024 budeme postupně vyřazovat Problémy GitHubu jako mechanismus zpětné vazby pro obsah a nahradíme ho novým systémem zpětné vazby. Další informace najdete tady: https://aka.ms/ContentUserFeedback.
Odeslat a zobrazit názory pro