Monitor applications from the Configuration Manager console
Applies to: Configuration Manager (current branch)
Applications in Configuration Manager support state-based monitoring, which enables you to track the last application deployment state for users and devices. These state messages display information about individual devices. For example, if an application is deployed to a collection of users, you can view the compliance state of the deployment and the deployment purpose in the Configuration Manager console.
Monitor application deployments by using the Monitoring workspace in the Configuration Manager console or by using reports.
About compliance states
An application deployment state has one of the following compliance states:
Success: The client successfully deployed the application or it's already deployed. A deployment can install or uninstall an application.
In progress: The client is currently running the application deployment.
Unknown: Configuration Manager can't determine the state of the application deployment. This state isn't applicable for deployments with a purpose of Available. The console typically displays this state when the site hasn't yet received state messages from the client.
Requirements not met: The client didn't run the application deployment because it wasn't compliant with a dependency or a requirement rule. For example, the OS on the device isn't applicable.
Error: The client failed to deploy the application because of an error.
For each compliance state, you can view additional information, such as the number of users and devices in this category. The compliance states also include subcategories. For example, the Error compliance state includes the following subcategories:
Error evaluating requirements
Content related errors
Installation errors
When more than one compliance state applies for an application deployment, you can see the aggregate state that represents the lowest compliance. For example:
A user signs in to two devices. The application successfully installs on one device but fails to install on the other. The aggregate deployment state of the application for this user displays as Error.
You deploy an application to all users that sign in to a computer. Configuration Manager displays multiple deployment results for that computer. If one of the deployments fails, the aggregate deployment state for the computer displays as Error.
Use these subcategories to help you to quickly identify any important issues with an application deployment. You can also view additional information about the devices that fall into a particular subcategory of a compliance state.
Application monitoring reports
Application management in Configuration Manager includes many built-in reports to monitor information about applications and deployments. These reports have the report category of Software Distribution – Application Monitoring. For more information, see List of reports.
For more information about how to configure reporting in Configuration Manager, see Introduction to reporting.
Monitor app state in the console
In the Configuration Manager console, go to the Monitoring workspace, and select the Deployments node.
If your site has numerous deployments, filter the list to just application deployments.
- At the top of the list next to the Search field, select Add Criteria. Choose Feature Type and then select Add.
- The search area adds the default criteria, AND Feature Type Content Distribution. Select Content Distribution and choose Application instead.
- Select Search to refresh the list.
Select a deployment for the app to monitor.
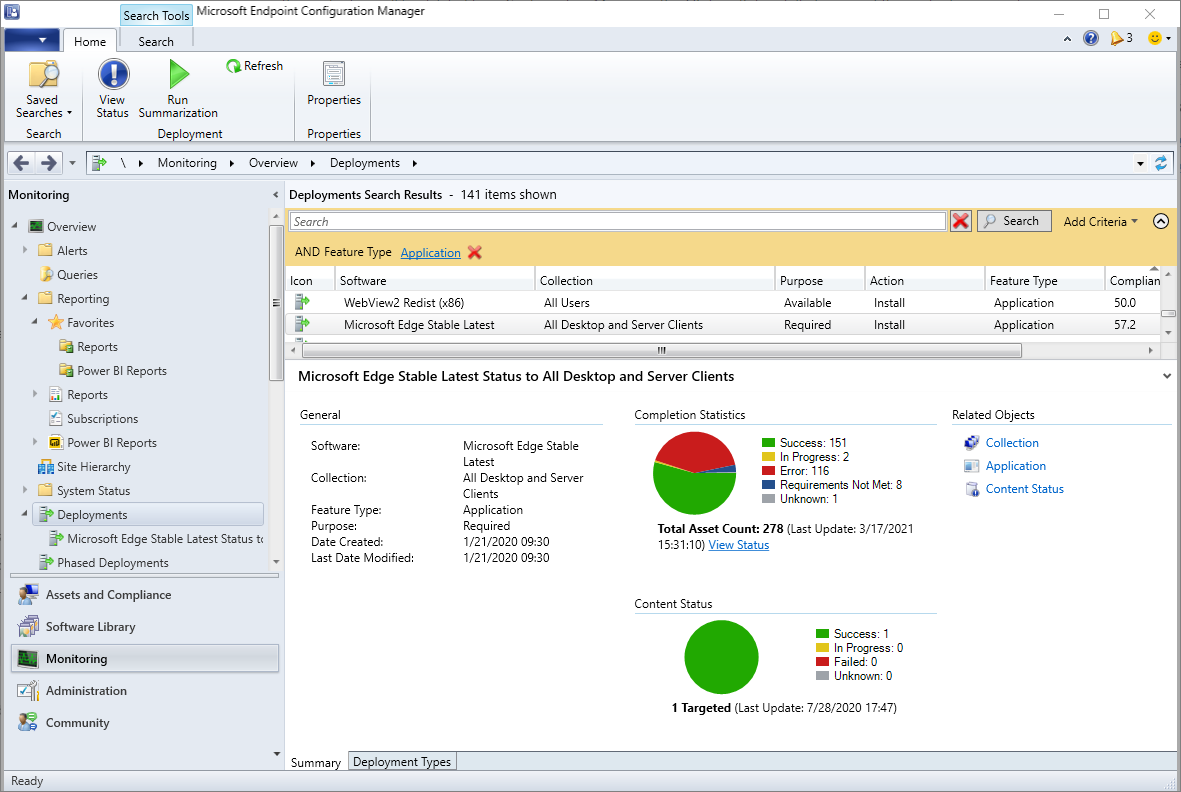

The following two tabs in the details pane are populated for the selected deployment:
- Summary: Displays general status information about an application deployment.
- Deployment Types: Displays status for the application's deployment types.
Review deployment details
From the Deployments node, you can review deployment details for each compliance state and the resources in that state. To review the deployment details, select View status on the Home tab of the ribbon. This action opens the Deployment Status pane. Here you can review the assets in each compliance state. To display Details list. Then select More Details on the right side of the window.
The maximum number of items that the Deployment Status pane can display is 20,000. If you need to see more items, use Configuration Manager reports to review application status data.
The status of deployment types is aggregated in the Deployment Status pane. To display more detailed information about the deployment types, use the Application Infrastructure Errors report.
Starting in version 2203, you can perform client notification actions, including Run Scripts, from the Deployment Status view. Use the right-click menu on either a group of clients in a Category or a single client in the Asset details pane to display the client notification actions.


Summarized data
The information on the Summary and Deployment Types tabs is summarized data. When you select View Status, the console displays current data from the site database. If these data don't match, select Run Summarization.
To configure the default application deployment summarization interval:
In the Configuration Manager console, go to the Administration workspace, expand Site Configuration, and select the Sites node.
Select the site for which you want to configure the summarization interval. Then in the Settings group of the ribbon, choose Status Summarizers.
Select Application Deployment Summarizer, and the select Edit.
Configure the summarization intervals:
- Frequency of status updates for a deployment that was modified in the last 30 days: By default, this value is 60 minutes.
- Frequency of status updates for a deployment that was modified in the last 31 to 90 days: By default, this value is 24 hours.
- Frequency of status updates for a deployment that was last modified over 90 days ago: By default this value is 7 days.
Note
These values apply to application, task sequence, and package deployments.
The site calculates the period of time based on the deployment start time.
Next steps
Feedback
Kommer snart: I hele 2024 udfaser vi GitHub-problemer som feedbackmekanisme for indhold og erstatter det med et nyt feedbacksystem. Se https://aka.ms/ContentUserFeedback for at få flere oplysninger.
Indsend og få vist feedback om