Enable Azure Monitor on your Azure Stack Edge Pro GPU device
APPLIES TO:  Azure Stack Edge Pro - GPU
 Azure Stack Edge Pro 2
 Azure Stack Edge Pro R
 Azure Stack Edge Mini R
Monitoring containers on your Azure Stack Edge Pro GPU device is critical, specially when you are running multiple compute applications. Azure Monitor lets you collect container logs and memory and processor metrics from the Kubernetes cluster running on your device.
This article describes the steps required to enable Azure Monitor on your device and gather container logs in Log Analytics workspace. The Azure Monitor metrics store is currently not supported with your Azure Stack Edge Pro GPU device.
Note
If Azure Arc is enabled on the Kubernetes cluster on your device, follow the steps in Azure Monitor Container Insights for Azure Arc-enabled Kubernetes clusters to set up container monitoring.
Prerequisites
Before you begin, you'll need:
- An Azure Stack Edge Pro device. Make sure that the device is activated as per the steps in Tutorial: Activate your device.
- You've completed Configure compute step as per the Tutorial: Configure compute on your Azure Stack Edge Pro device on your device. Your device should have an associated IoT Hub resource, an IoT device, and an IoT Edge device.
Create Log Analytics workspace
Take the following steps to create a log analytics workspace. A log analytics workspace is a logical storage unit where the log data is collected and stored.
In the Azure portal, select + Create a resource and search for Log Analytics Workspace and then select Create.
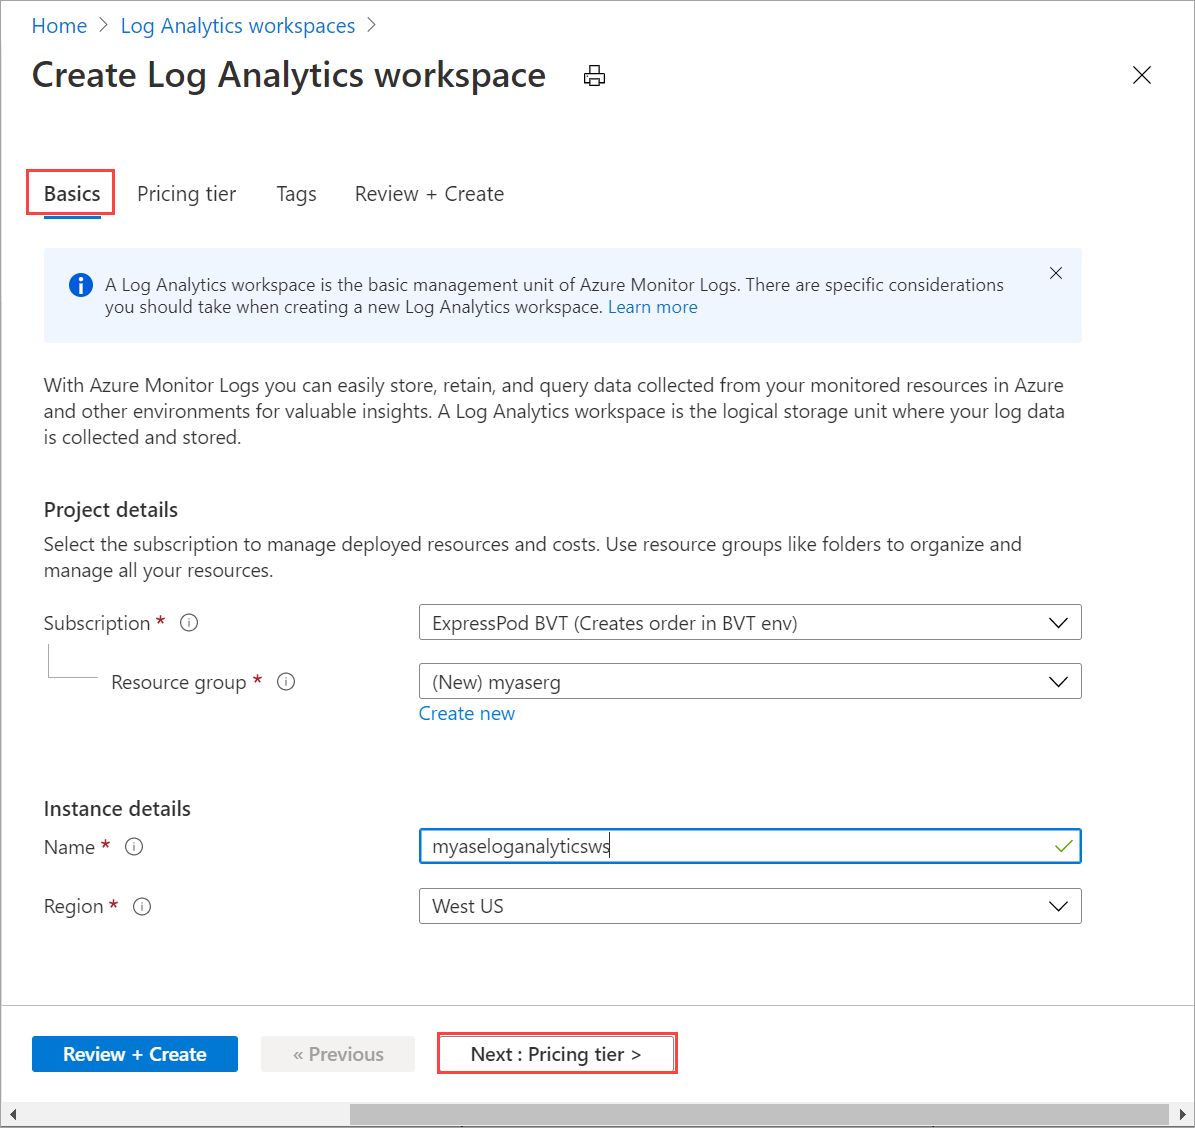
In the Create Log Analytics workspace, configure the following settings. Accept the remainder as default.
On the Basics tab, provide the subscription, resource group, name, and region for the workspace.
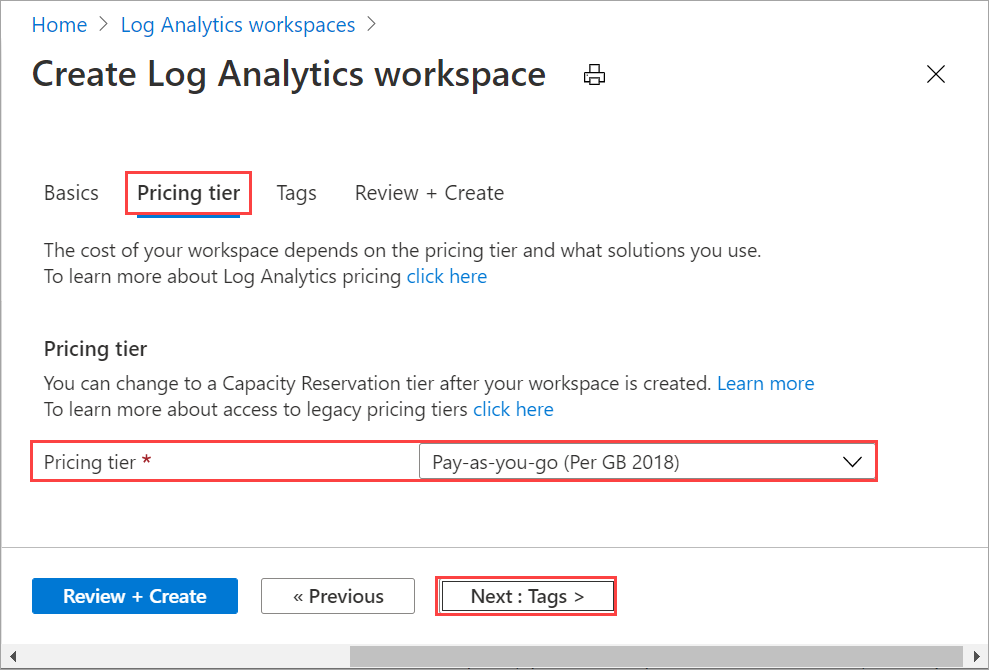
On the Pricing tier tab, accept the default Pay-as-you-go plan.
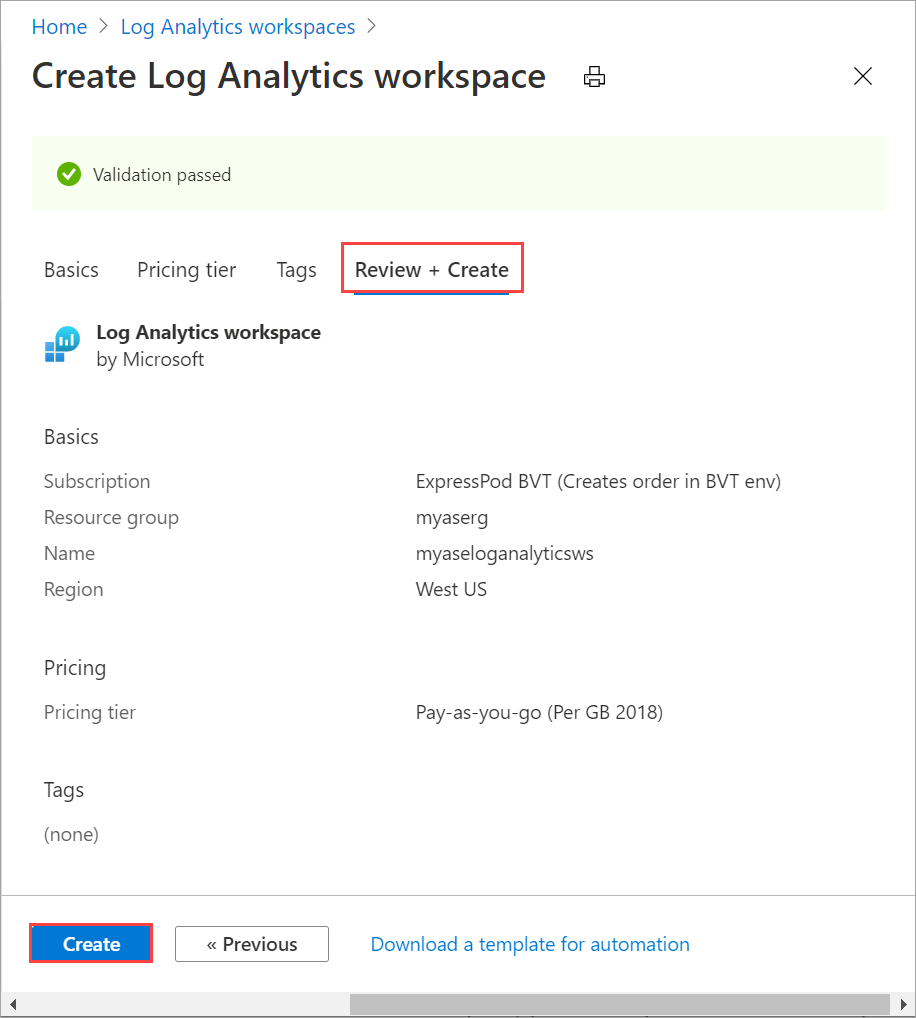
On the Review + Create tab, review the information for your workspace and select Create.
For more information, see the detailed steps in Create a Log Analytics workspace via Azure portal.
Enable container insights
Take the following steps to enable Container Insights on your workspace.
Follow the detailed steps in Add the Azure Monitor Containers solution. Use the following template file
containerSolution.json:{ "$schema": "https://schema.management.azure.com/schemas/2015-01-01/deploymentTemplate.json#", "contentVersion": "1.0.0.0", "parameters": { "workspaceResourceId": { "type": "string", "metadata": { "description": "Azure Monitor Log Analytics Workspace Resource ID" } }, "workspaceRegion": { "type": "string", "metadata": { "description": "Azure Monitor Log Analytics Workspace region" } } }, "resources": [ { "type": "Microsoft.Resources/deployments", "name": "[Concat('ContainerInsights', '-', uniqueString(parameters('workspaceResourceId')))]", "apiVersion": "2017-05-10", "subscriptionId": "[split(parameters('workspaceResourceId'),'/')[2]]", "resourceGroup": "[split(parameters('workspaceResourceId'),'/')[4]]", "properties": { "mode": "Incremental", "template": { "$schema": "https://schema.management.azure.com/schemas/2015-01-01/deploymentTemplate.json#", "contentVersion": "1.0.0.0", "parameters": {}, "variables": {}, "resources": [ { "apiVersion": "2015-11-01-preview", "type": "Microsoft.OperationsManagement/solutions", "location": "[parameters('workspaceRegion')]", "name": "[Concat('ContainerInsights', '(', split(parameters('workspaceResourceId'),'/')[8], ')')]", "properties": { "workspaceResourceId": "[parameters('workspaceResourceId')]" }, "plan": { "name": "[Concat('ContainerInsights', '(', split(parameters('workspaceResourceId'),'/')[8], ')')]", "product": "[Concat('OMSGallery/', 'ContainerInsights')]", "promotionCode": "", "publisher": "Microsoft" } } ] }, "parameters": {} } } ] }Get the resource ID and location. Go to
Your Log Analytics workspace > General > Properties. Copy the following information:- resource ID, which is the fully qualified Azure resource ID of the Azure Log Analytics workspace.
- location, which is the Azure region.
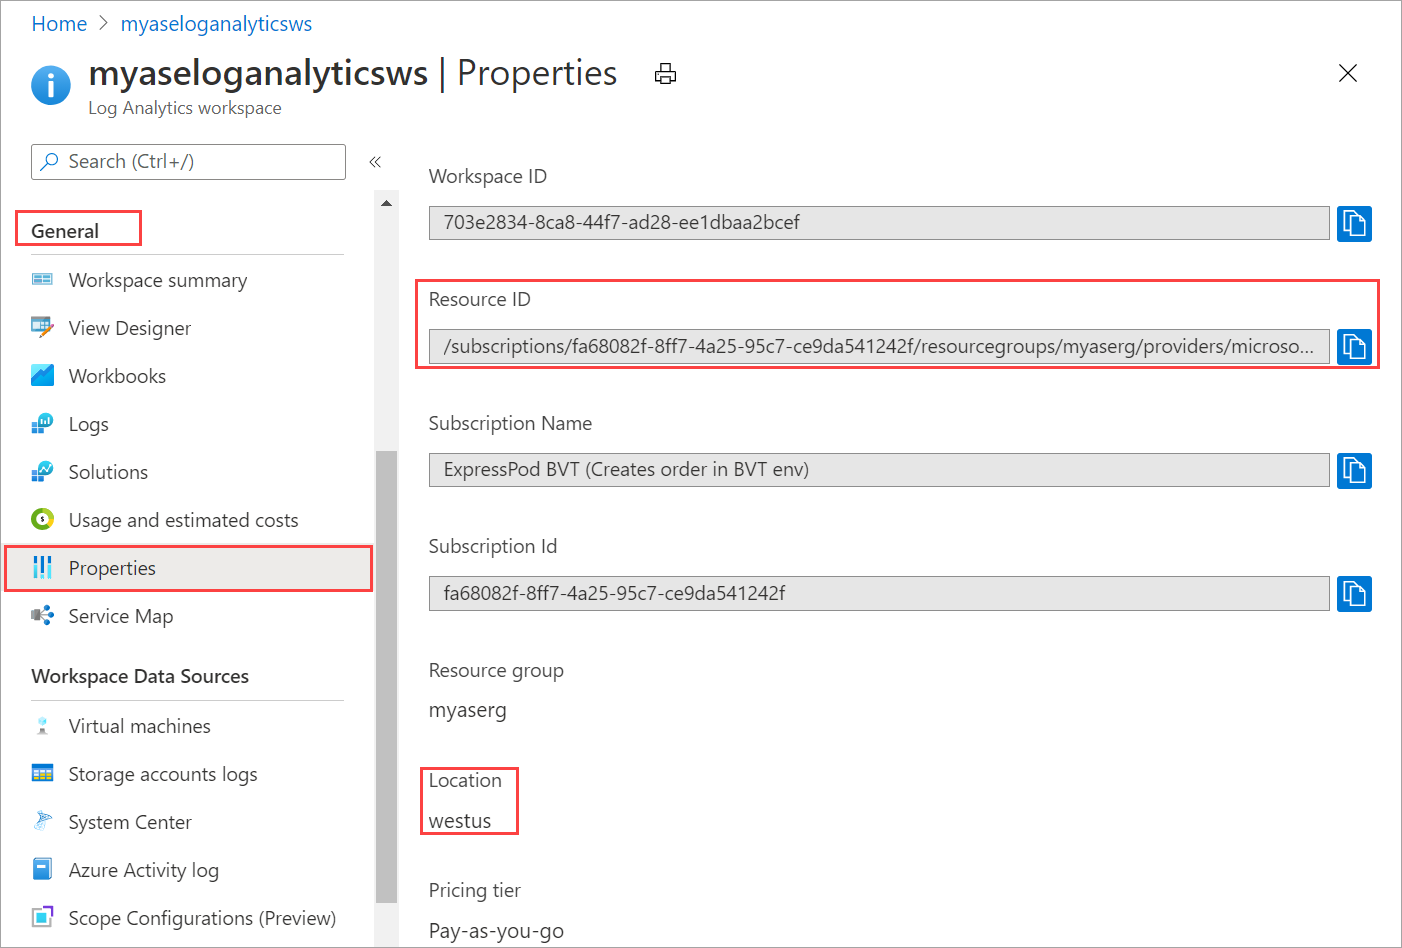
Use the following parameters file
containerSolutionParams.json. ReplaceworkspaceResourceIdwith the resource ID andworkspaceRegionwith the location copied in the earlier step.{ "$schema": "https://schema.management.azure.com/schemas/2015-01-01/deploymentParameters.json#", "contentVersion": "1.0.0.0", "parameters": { "workspaceResourceId": { "value": "/subscriptions/fa68082f-8ff7-4a25-95c7-ce9da541242f/resourcegroups/myaserg/providers/microsoft.operationalinsights/workspaces/myaseloganalyticsws" }, "workspaceRegion": { "value": "westus" } } }Here is a sample output of a Log Analytics workspace with Container Insights enabled:
Requesting a Cloud Shell.Succeeded.
Connecting terminal...
MOTD: Switch to Bash from PowerShell: bash
VERBOSE: Authenticating to Azure ...
VERBOSE: Building your Azure drive ...

PS /home/myaccount> az account set -s fa68082f-8ff7-4a25-95c7-ce9da541242f
PS /home/myaccount> ls
clouddrive  containerSolution.json
PS /home/myaccount> ls
clouddrive  containerSolution.json  containerSolutionParams.json
PS /home/myaccount> az deployment group create --resource-group myaserg --name Testdeployment1 --template-file containerSolution.json --parameters containerSolutionParams.json
{- Finished ..
    "id": "/subscriptions/fa68082f-8ff7-4a25-95c7-ce9da541242f/resourceGroups/myaserg/providers/Microsoft.Resources/deployments/Testdeployment1",
    "location": null,
    "name": "Testdeployment1",
    "properties": {
    "correlationId": "3a9045fe-2de0-428c-b17b-057508a8c575",
    "debugSetting": null,
    "dependencies": [],
    "duration": "PT11.1588316S",
    "error": null,
    "mode": "Incremental",
    "onErrorDeployment": null,
    "outputResources": [
        {
        "id": "/subscriptions/fa68082f-8ff7-4a25-95c7-ce9da541242f/resourceGroups/myaserg/providers/Microsoft.OperationsManagement/solutions/ContainerInsights(myaseloganalyticsws)",
        "resourceGroup": "myaserg"
        }
    ],
    "outputs": null,
    "parameters": {
        "workspaceRegion": {
        "type": "String",
        "value": "westus"
        },
        "workspaceResourceId": {
        "type": "String",
        "value": "/subscriptions/fa68082f-8ff7-4a25-95c7-ce9da541242f/resourcegroups/myaserg/providers/microsoft.operationalinsights/workspaces/myaseloganalyticsws"
        }
    },
    "parametersLink": null,
    "providers": [
        {
        "id": null,
        "namespace": "Microsoft.Resources",
        "registrationPolicy": null,
        "registrationState": null,
        "resourceTypes": [
            {
            "aliases": null,
            "apiProfiles": null,
            "apiVersions": null,
            "capabilities": null,
            "defaultApiVersion": null,
            "locations": [
                null
            ],
            "properties": null,
            "resourceType": "deployments"
            }
        ]
        }
    ],
    "provisioningState": "Succeeded",
    "templateHash": "10500027184662969395",
    "templateLink": null,
    "timestamp": "2020-11-06T22:09:56.908983+00:00",
    "validatedResources": null
    },
    "resourceGroup": "myaserg",
    "tags": null,
    "type": "Microsoft.Resources/deployments"
}
PS /home/myaccount>
Configure Azure Monitor on your device
Go to the newly created Log Analytics Resource and copy the Workspace ID and Primary key (workspace key).
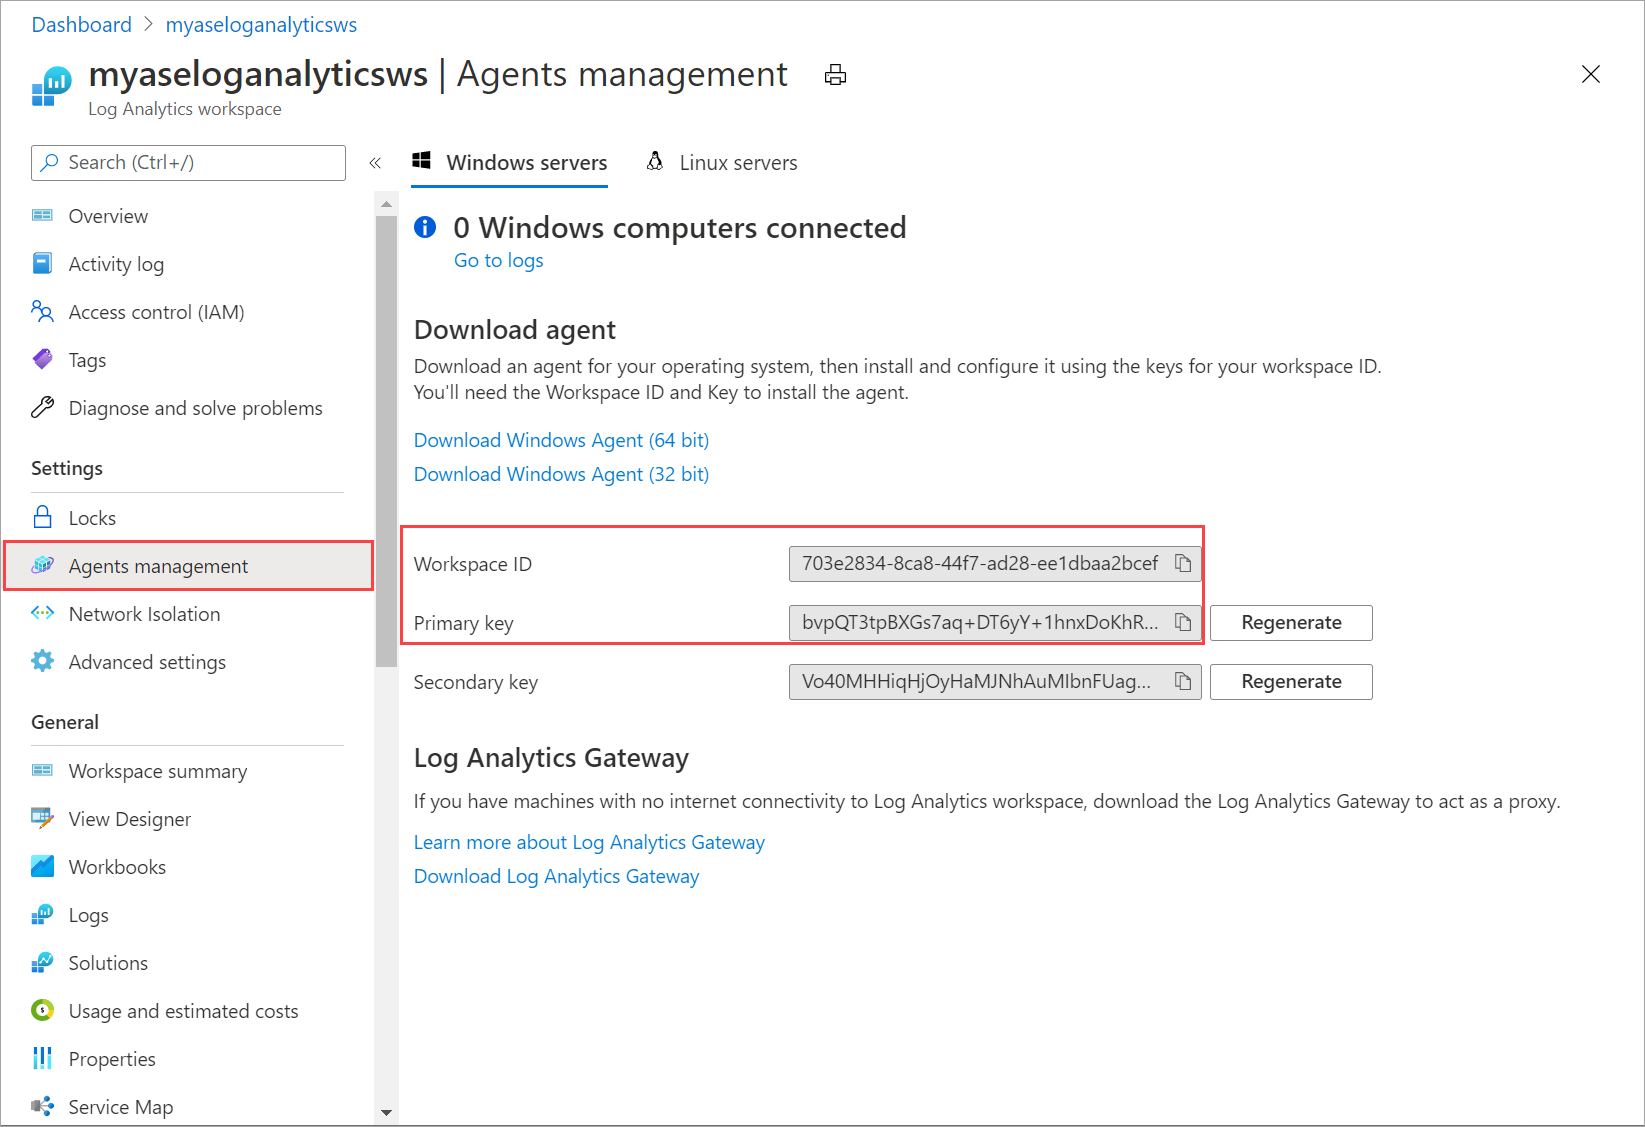
Save this information as you will use it in a later step.
Use the log analytics Workspace ID and Workspace key with the following cmdlet:
Set-HcsKubernetesAzureMonitorConfiguration -WorkspaceId <> -WorkspaceKey <>Note
By default, this cmdlet configures the Azure public cloud. To configure a government cloud or non-public cloud, use the parameter
AzureCloudDomainName.After the Azure Monitor is enabled, you should see logs in the Log Analytics workspace. To view the status of the Kubernetes cluster deployed on your device, go to Azure Monitor > Insights > Containers. For the environment option, select All.

Next steps
- Learn how to Monitor Kubernetes workloads via the Kubernetes Dashboard.
- Learn how to Manage device event alert notifications.
Feedback
Kommer snart: I hele 2024 udfaser vi GitHub-problemer som feedbackmekanisme for indhold og erstatter det med et nyt feedbacksystem. Du kan få flere oplysninger under: https://aka.ms/ContentUserFeedback.
Indsend og få vist feedback om