Hinzufügen einer Polygonextrusionsebene zur Karte (Android SDK)
In diesem Artikel erfahren Sie, wie Sie mithilfe der Polygonextrusionsebene Bereiche von Polygon- und MultiPolygon-Featuregeometrien als extrudierte Formen darstellen.
Hinweis
Auslauf des Azure Maps Android SDK
Das Azure Maps Native SDK für Android ist jetzt veraltet und wird am 31.03.2025 eingestellt. Um Dienstunterbrechungen zu vermeiden, migrieren Sie bis zum 31.03.2025 zum Azure Maps Web SDK. Weitere Informationen finden Sie im Migrationshandbuch zum Azure Maps iOS SDK.
Verwenden einer Polygonextrusionsebene
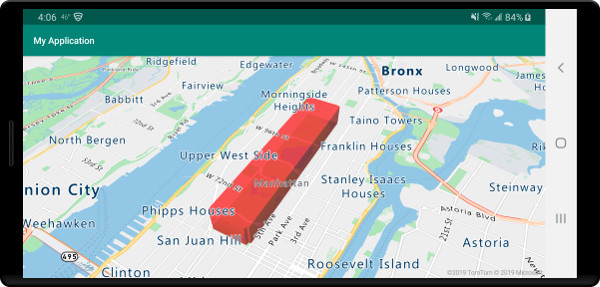
Verbinden Sie die Polygonextrusionsebene mit einer Datenquelle. Laden Sie sie anschließend auf die Karte. Die Polygonextrusionsebene stellt die Bereiche eines Polygon- und MultiPolygon-Features als extrudierte Formen dar. Die Eigenschaften height und base der Polygonextrusionsebene definieren den Basisabstand vom Boden und die Höhe der extrudierten Form in Metern. Der folgende Code zeigt, wie Sie ein Polygon erstellen, dieses einer Datenquelle hinzufügen und dann mit einer Klasse für die Polygonextrusionsebene rendern.
Hinweis
Der in der Polygonextrusionsebene definierte Wert base sollte kleiner oder gleich dem Wert von height sein.
//Create a data source and add it to the map.
DataSource source = new DataSource();
map.sources.add(source);

//Create a polygon.
source.add(Polygon.fromLngLats(
    Arrays.asList(
        Arrays.asList(
            Point.fromLngLat(-73.958383, 40.800279),
            Point.fromLngLat(-73.981547, 40.768459),
            Point.fromLngLat(-73.981246, 40.767761),
            Point.fromLngLat(-73.973618, 40.764616),
            Point.fromLngLat(-73.973060, 40.765128),
            Point.fromLngLat(-73.972599, 40.764908),
            Point.fromLngLat(-73.949446, 40.796584),
            Point.fromLngLat(-73.949661, 40.797088),
            Point.fromLngLat(-73.957815, 40.800523),
            Point.fromLngLat(-73.958383, 40.800279)
        )
    )
));

//Create and add a polygon extrusion layer to the map below the labels so that they are still readable.
PolygonExtrusionLayer layer = new PolygonExtrusionLayer(source,
    fillColor("#fc0303"),
    fillOpacity(0.7f),
    height(500f)
);

//Create and add a polygon extrusion layer to the map below the labels so that they are still readable.
map.layers.add(layer, "labels");
//Create a data source and add it to the map.
val source = DataSource()
map.sources.add(source)

//Create a polygon.
source.add(
    Polygon.fromLngLats(
        Arrays.asList(
            Arrays.asList(
                Point.fromLngLat(-73.958383, 40.800279),
                Point.fromLngLat(-73.981547, 40.768459),
                Point.fromLngLat(-73.981246, 40.767761),
                Point.fromLngLat(-73.973618, 40.764616),
                Point.fromLngLat(-73.973060, 40.765128),
                Point.fromLngLat(-73.972599, 40.764908),
                Point.fromLngLat(-73.949446, 40.796584),
                Point.fromLngLat(-73.949661, 40.797088),
                Point.fromLngLat(-73.957815, 40.800523),
                Point.fromLngLat(-73.958383, 40.800279)
            )
        )
    )
)

//Create and add a polygon extrusion layer to the map below the labels so that they are still readable.
val layer = PolygonExtrusionLayer(
    source,
    fillColor("#fc0303"),
    fillOpacity(0.7f),
    height(500f)
)

//Create and add a polygon extrusion layer to the map below the labels so that they are still readable.
map.layers.add(layer, "labels")
Der folgende Screenshot veranschaulicht, wie durch den oben aufgeführten Code ein vertikal gestrecktes Polygon mithilfe einer Polygonextrusionsebene gerendert wird.
Hinzufügen von datengesteuerten Polygonen
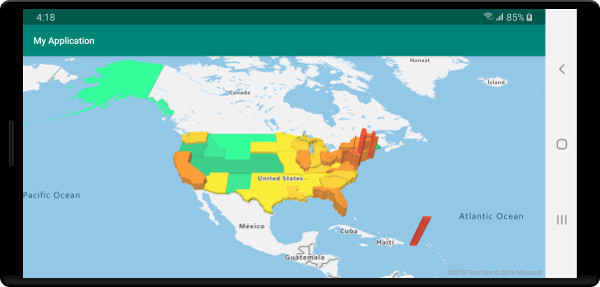
Eine Choroplethenkarte kann mithilfe der Polygonextrusionsebene gerendert werden. Legen Sie die Eigenschaften height und fillColor der Extrusionsebene auf die Messung der statistischen Variablen in den Featuregeometrien Polygon und MultiPolygon fest. Das folgende Codebeispiel zeigt eine extrudierte Choroplethenkarte der USA basierend auf der Messung der Bevölkerungsdichte nach Bundesstaat.
//Create a data source and add it to the map.
DataSource source = new DataSource();

//Import the geojson data and add it to the data source.
source.importDataFromUrl("https://samples.azuremaps.com/data/geojson/US_States_Population_Density.json");

//Add data source to the map.
map.sources.add(source);

//Create and add a polygon extrusion layer to the map below the labels so that they are still readable.
PolygonExtrusionLayer layer = new PolygonExtrusionLayer(source,
    fillOpacity(0.7f),
    fillColor(
        step(
            get("density"),
            literal("rgba(0, 255, 128, 1)"),
            stop(10, "rgba(9, 224, 118, 1)"),
            stop(20, "rgba(11, 191, 103, 1)"),
            stop(50, "rgba(247, 227, 5, 1)"),
            stop(100, "rgba(247, 199, 7, 1)"),
            stop(200, "rgba(247, 130, 5, 1)"),
            stop(500, "rgba(247, 94, 5, 1)"),
            stop(1000, "rgba(247, 37, 5, 1)")
        )
    ),
    height(
        interpolate(
            linear(),
            get("density"),
            stop(0, 100),
            stop(1200, 960000)
        )
    )
);

//Create and add a polygon extrusion layer to the map below the labels so that they are still readable.
map.layers.add(layer, "labels");
//Create a data source and add it to the map.
val source = DataSource()

//Import the geojson data and add it to the data source.
source.importDataFromUrl("https://samples.azuremaps.com/data/geojson/US_States_Population_Density.json")

//Add data source to the map.
map.sources.add(source)

//Create and add a polygon extrusion layer to the map below the labels so that they are still readable.
val layer = PolygonExtrusionLayer(
    source,
    fillOpacity(0.7f),
    fillColor(
        step(
            get("density"),
            literal("rgba(0, 255, 128, 1)"),
            stop(10, "rgba(9, 224, 118, 1)"),
            stop(20, "rgba(11, 191, 103, 1)"),
            stop(50, "rgba(247, 227, 5, 1)"),
            stop(100, "rgba(247, 199, 7, 1)"),
            stop(200, "rgba(247, 130, 5, 1)"),
            stop(500, "rgba(247, 94, 5, 1)"),
            stop(1000, "rgba(247, 37, 5, 1)")
        )
    ),
    height(
        interpolate(
            linear(),
            get("density"),
            stop(0, 100),
            stop(1200, 960000)
        )
    )
)

//Create and add a polygon extrusion layer to the map below the labels so that they are still readable.
map.layers.add(layer, "labels")
Der folgende Screenshot zeigt eine Choroplethenkarte der US-Bundesstaaten, die als extrudierte Polygone basierend auf der Bevölkerungsdichte mit Farben versehen und vertikal gestreckt wurde.
Nächste Schritte
In den folgenden Artikeln finden Sie weitere Codebeispiele, die Sie Ihren Karten hinzufügen können: