Beispielszenario für Office-Skripts: Abrufen und Graphen von Daten auf Wasserebene aus NOAA
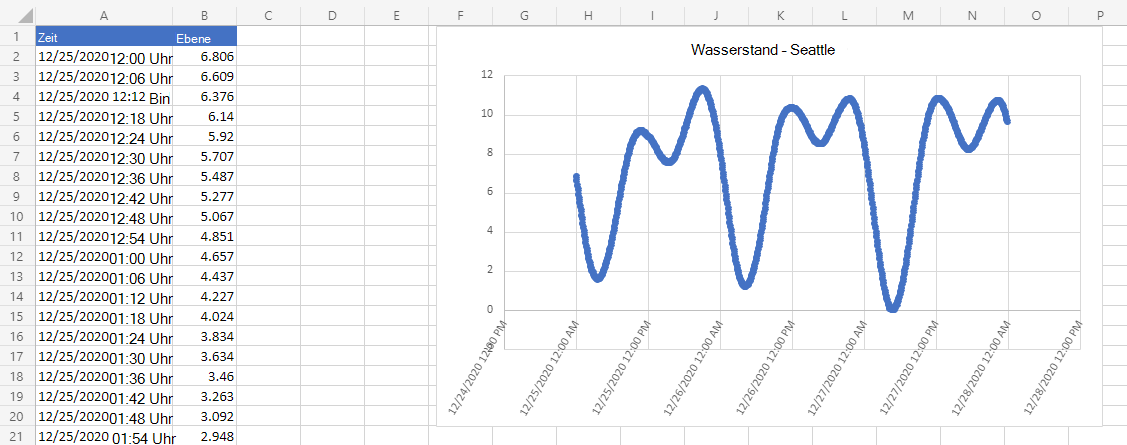
In diesem Szenario müssen Sie den Wasserstand in der Seattle-Station der National Oceanic and Atmospheric Administration zeichnen. Sie verwenden externe Daten, um ein Arbeitsblatt aufzufüllen und ein Diagramm zu erstellen.
Sie entwickeln ein Skript, das den fetch Befehl verwendet, um die NOAA Tides and Currents-Datenbank abzufragen. Dadurch wird der über einen bestimmten Zeitraum aufgezeichnete Wasserstand abgerufen. Die Informationen werden als JSON zurückgegeben, sodass ein Teil des Skripts dies in Bereichswerte übersetzt. Sobald sich die Daten in der Kalkulationstabelle befinden, werden sie zum Erstellen eines Diagramms verwendet.
Weitere Informationen zum Arbeiten mit JSON finden Sie unter Verwenden von JSON zum Übergeben von Daten an und aus Office-Skripts.
Behandelte Skriptfähigkeiten
- Externe API-Aufrufe (
fetch) - JSON-Analyse
- Diagramme
Setupanweisungen
Öffnen Sie die Arbeitsmappe in Excel.
Wählen Sie auf der Registerkarte Automatisierendie Option Neues Skript aus, und fügen Sie das folgende Skript in den Editor ein.
/**
 * Gets data from the National Oceanic and Atmospheric Administration's Tides and Currents database.
 * That data is used to make a chart.
 */
async function main(workbook: ExcelScript.Workbook) {
  // Get the current sheet.
  let currentSheet = workbook.getActiveWorksheet();

  // Create selection of parameters for the fetch URL.
  // More information on the NOAA APIs is found here:
  // https://api.tidesandcurrents.noaa.gov/api/prod/
  const option = "water_level";
  const startDate = "20201225"; /* yyyymmdd date format */
  const endDate = "20201227";
  const station = "9447130"; /* Seattle */

  // Construct the URL for the fetch call.
  const strQuery = `https://api.tidesandcurrents.noaa.gov/api/prod/datagetter?product=${option}&begin_date=${startDate}&end_date=${endDate}&datum=MLLW&station=${station}&units=english&time_zone=gmt&application=NOS.COOPS.TAC.WL&format=json`;

  console.log(strQuery);

  // Resolve the Promises returned by the fetch operation.
  const response = await fetch(strQuery);
  const rawJson: string = await response.json();

  // Translate the raw JSON into a usable state.
  const stringifiedJson = JSON.stringify(rawJson);

  // Note that we're only taking the data part of the JSON and excluding the metadata.
  const noaaData: NOAAData[] = JSON.parse(stringifiedJson).data;

  // Create table headers and format them to stand out.
  let headers = [["Time", "Level"]];
  let headerRange = currentSheet.getRange("A1:B1");
  headerRange.setValues(headers);
  headerRange.getFormat().getFill().setColor("#4472C4");
  headerRange.getFormat().getFont().setColor("white");

  // Insert all the data in rows from JSON.
  let noaaDataCount = noaaData.length;
  let dataToEnter = [[], []]
  for (let i = 0; i < noaaDataCount; i++) {
    let currentDataPiece = noaaData[i];
    dataToEnter[i] = [currentDataPiece.t, currentDataPiece.v];
  }

  let dataRange = currentSheet.getRange("A2:B" + String(noaaDataCount + 1)); /* +1 to account for the title row */
  dataRange.setValues(dataToEnter);

  // Format the "Time" column for timestamps.
  dataRange.getColumn(0).setNumberFormatLocal("[$-en-US]mm/dd/yyyy hh:mm AM/PM;@");

  // Create and format a chart with the level data.
  let chart = currentSheet.addChart(ExcelScript.ChartType.xyscatterSmooth, dataRange);
  chart.getTitle().setText("Water Level - Seattle");
  chart.setTop(0);
  chart.setLeft(300);
  chart.setWidth(500);
  chart.setHeight(300);
  chart.getAxes().getValueAxis().setShowDisplayUnitLabel(false);
  chart.getAxes().getCategoryAxis().setTextOrientation(60);
  chart.getLegend().setVisible(false);

  // Add a comment with the data attribution.
  currentSheet.addComment(
    "A1",
    `This data was taken from the National Oceanic and Atmospheric Administration's Tides and Currents database on ${new Date(Date.now())}.`
  );

  /**
   * An interface to wrap the parts of the JSON we need.
   * These properties must match the names used in the JSON.
   */
  interface NOAAData {
    t: string; // Time
    v: number; // Level
  }
}
Benennen Sie das Skript in NOAA Water Level Chart um, und speichern Sie es.
Ausführen des Skripts
Führen Sie auf einem beliebigen Arbeitsblatt das Noaa-Wasserstandsdiagramm-Skript aus. Das Skript ruft die Wasserstandsdaten vom 25. Dezember 2020 bis zum 27. Dezember 2020 ab. Die const Variablen am Anfang des Skripts können geändert werden, um unterschiedliche Datumsangaben zu verwenden oder unterschiedliche Stationsinformationen abzurufen. Die CO-OPS-API für den Datenabruf beschreibt, wie sie all diese Daten abrufen.
Nach dem Ausführen des Skripts
Office Scripts
Feedback
Bald verfügbar: Im Laufe des Jahres 2024 werden wir GitHub-Issues stufenweise als Feedbackmechanismus für Inhalte abbauen und durch ein neues Feedbacksystem ersetzen. Weitere Informationen finden Sie unter https://aka.ms/ContentUserFeedback.
Feedback senden und anzeigen für