Microsoft 365 data
Important
This article is for the legacy Workplace Analytics app and does not reflect functionality available on the updated Viva Insights platform. Access current documentation for Viva Insights advanced insights here: advanced insights documentation.
Important
Advanced insights in Viva Insights doesn't currently support mailboxes in Sweden go-local. To get updated data for advanced insights, you cannot have licenses assigned to users with mailboxes in Sweden go-local.
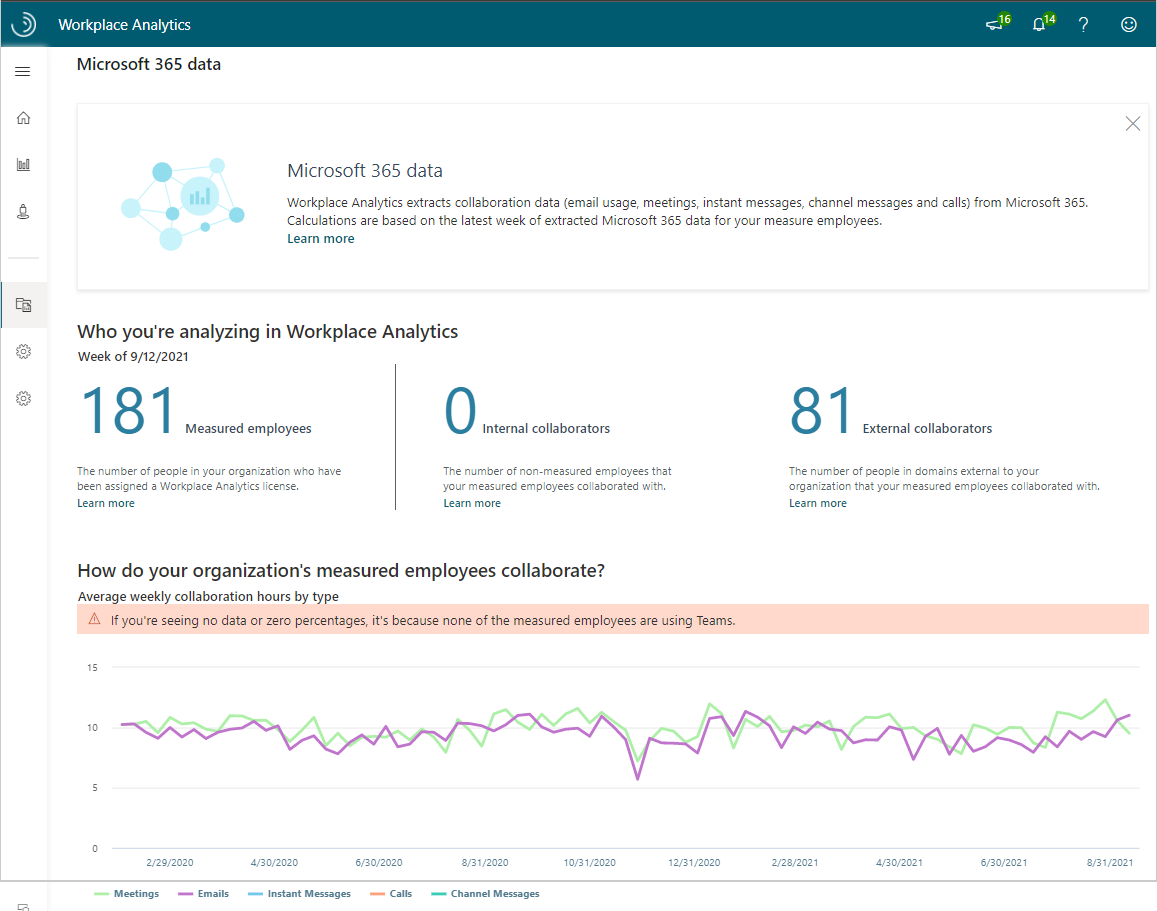
As an admin or an analyst, you can use this page to confirm that your Microsoft 365 data is up-to-date. Use this page to look for date ranges that have unexpected gaps in activity, inconsistent or degraded data, or activity levels that are higher or lower than what might be considered normal for your organization.
Microsoft 365 data includes the following:
Measured employees - The employees to whom your Viva Insights admin assigned licenses during setup. After license assignments, the advanced insights app extracts Microsoft 365 data about meetings, email, unscheduled calls, and instant messages for these people. When the data extraction process is successful for these employees, they are included in your measured population. If extraction errors occur and Viva Insights didn't get data for a person, that person is licensed but not counted as a measured employee in Viva Insights. If you are an analyst or limited analyst, this is the population that you can analyze within Viva Insights. The number of measured employees can help determine whether you have good data coverage for analysis.
Note
Your admin can assign employees Viva Insights licenses as a group with Microsoft Entra ID. If this number seems inaccurate, confirm with your admin that only active employees are assigned licenses through Microsoft Entra ID. For more details, see Assign licenses.
Internal collaborators - These are unmeasured employees who were included in extractions of Microsoft 365 data with whom the measured employees collaborated. These people are not part of your measured population but are internal to your organization. Internal collaborators can include employees from other groups, vendors, or contractors that are working with your team and are included in the same internal domain as your team, but are not in your measured population.
External collaborators - These are people outside of your company or external to your email domain with whom your measured employees collaborated. For more information about external collaboration, see External collaboration.
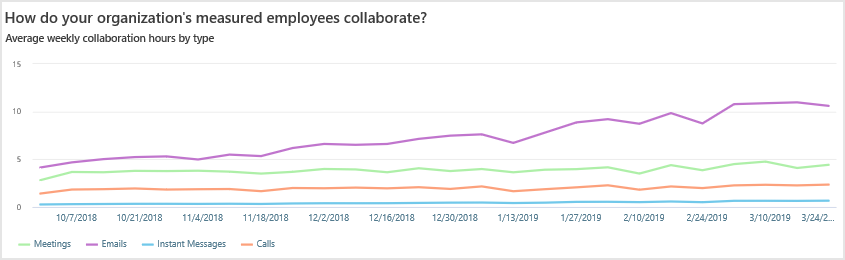
Average weekly collaboration chart - This chart shows the last refreshed on weekly collaboration hours for measured employees by type, which can include hours spent on email, in meetings, in unscheduled calls, and on instant messages. The Last refreshed date shows when Office 365 Exchange and Teams data was most recently processed for this chart.
Hover your cursor over the chart data to get more details and use the chart legend to change what data (meetings, email, instant messages, and calls) the chart shows.
Origin of data counts
In Sources > Microsoft 365 data, you can see the current count of three categories of data. Most of this data originates with people in your organization, who might or might not have Viva Insights licenses. However, some data originates outside of your organization or comes from mailboxes of other types.
Determining the origins of data also determines how to categorize it, as shown in the following flow chart.

The following shows where each appears in Microsoft 365 data.

Possible causes of inconsistent data
The following are examples of where you might encounter instances of inconsistency in the volume of email, meetings, calls, and instant messages data.
Major holidays - Drops in email and meeting activity around major holidays are typical and can potentially impact analysis. You can remove these weeks from your outputs to reduce its impact.
Email archive policies - Business policies can impact historical data processed during initial setup. As you view historical data, if you see a steady decline or point-in-time drop-off in email and/or meeting activity, it might be due to archiving. By using the Average weekly collaboration chart (see the preceding illustration), you can select a date range to analyze your collaboration data where the mail volume is stable.
Recurring meetings - When a recurring meeting series is removed from a calendar, all past instances of this meeting are removed. As you view historical data, if you see a steady decline in meeting activity, it might be due to recurring meetings having been removed from calendars. By using the Average weekly collaboration chart (see the preceding illustration), you can select a date range to analyze your collaboration data where the meeting volume is stable.