Chatty I/O antipattern
The cumulative effect of a large number of I/O requests can have a significant impact on performance and responsiveness.
Problem description
Network calls and other I/O operations are inherently slow compared to compute tasks. Each I/O request typically has significant overhead, and the cumulative effect of numerous I/O operations can slow down the system. Here are some common causes of chatty I/O.
Reading and writing individual records to a database as distinct requests
The following example reads from a database of products. There are three tables, Product, ProductSubcategory, and ProductPriceListHistory. The code retrieves all of the products in a subcategory, along with the pricing information, by executing a series of queries:
- Query the subcategory from the
ProductSubcategorytable. - Find all products in that subcategory by querying the
Producttable. - For each product, query the pricing data from the
ProductPriceListHistorytable.
The application uses Entity Framework to query the database. You can find the complete sample here.
public async Task<IHttpActionResult> GetProductsInSubCategoryAsync(int subcategoryId)
{
    using (var context = GetContext())
    {
        // Get product subcategory.
        var productSubcategory = await context.ProductSubcategories
                .Where(psc => psc.ProductSubcategoryId == subcategoryId)
                .FirstOrDefaultAsync();

        // Find products in that category.
        productSubcategory.Product = await context.Products
            .Where(p => subcategoryId == p.ProductSubcategoryId)
            .ToListAsync();

        // Find price history for each product.
        foreach (var prod in productSubcategory.Product)
        {
            int productId = prod.ProductId;
            var productListPriceHistory = await context.ProductListPriceHistory
                .Where(pl => pl.ProductId == productId)
                .ToListAsync();
            prod.ProductListPriceHistory = productListPriceHistory;
        }
        return Ok(productSubcategory);
    }
}
This example shows the problem explicitly, but sometimes an O/RM can mask the problem, if it implicitly fetches child records one at a time. This is known as the "N+1 problem".
Implementing a single logical operation as a series of HTTP requests
This often happens when developers try to follow an object-oriented paradigm, and treat remote objects as if they were local objects in memory. This can result in too many network round trips. For example, the following web API exposes the individual properties of User objects through individual HTTP GET methods.
public class UserController : ApiController
{
    [HttpGet]
    [Route("users/{id:int}/username")]
    public HttpResponseMessage GetUserName(int id)
    {
        ...
    }

    [HttpGet]
    [Route("users/{id:int}/gender")]
    public HttpResponseMessage GetGender(int id)
    {
        ...
    }

    [HttpGet]
    [Route("users/{id:int}/dateofbirth")]
    public HttpResponseMessage GetDateOfBirth(int id)
    {
        ...
    }
}
While there's nothing technically wrong with this approach, most clients will probably need to get several properties for each User, resulting in client code like the following.
HttpResponseMessage response = await client.GetAsync("users/1/username");
response.EnsureSuccessStatusCode();
var userName = await response.Content.ReadAsStringAsync();

response = await client.GetAsync("users/1/gender");
response.EnsureSuccessStatusCode();
var gender = await response.Content.ReadAsStringAsync();

response = await client.GetAsync("users/1/dateofbirth");
response.EnsureSuccessStatusCode();
var dob = await response.Content.ReadAsStringAsync();
Reading and writing to a file on disk
File I/O involves opening a file and moving to the appropriate point before reading or writing data. When the operation is complete, the file might be closed to save operating system resources. An application that continually reads and writes small amounts of information to a file will generate significant I/O overhead. Small write requests can also lead to file fragmentation, slowing subsequent I/O operations still further.
The following example uses a FileStream to write a Customer object to a file. Creating the FileStream opens the file, and disposing it closes the file. (The using statement automatically disposes the FileStream object.) If the application calls this method repeatedly as new customers are added, the I/O overhead can accumulate quickly.
private async Task SaveCustomerToFileAsync(Customer customer)
{
    using (Stream fileStream = new FileStream(CustomersFileName, FileMode.Append))
    {
        BinaryFormatter formatter = new BinaryFormatter();
        byte [] data = null;
        using (MemoryStream memStream = new MemoryStream())
        {
            formatter.Serialize(memStream, customer);
            data = memStream.ToArray();
        }
        await fileStream.WriteAsync(data, 0, data.Length);
    }
}
How to fix the problem
Reduce the number of I/O requests by packaging the data into larger, fewer requests.
Fetch data from a database as a single query, instead of several smaller queries. Here's a revised version of the code that retrieves product information.
public async Task<IHttpActionResult> GetProductCategoryDetailsAsync(int subCategoryId)
{
    using (var context = GetContext())
    {
        var subCategory = await context.ProductSubcategories
                .Where(psc => psc.ProductSubcategoryId == subCategoryId)
                .Include("Product.ProductListPriceHistory")
                .FirstOrDefaultAsync();

        if (subCategory == null)
            return NotFound();

        return Ok(subCategory);
    }
}
Follow REST design principles for web APIs. Here's a revised version of the web API from the earlier example. Instead of separate GET methods for each property, there is a single GET method that returns the User. This results in a larger response body per request, but each client is likely to make fewer API calls.
public class UserController : ApiController
{
    [HttpGet]
    [Route("users/{id:int}")]
    public HttpResponseMessage GetUser(int id)
    {
        ...
    }
}

// Client code
HttpResponseMessage response = await client.GetAsync("users/1");
response.EnsureSuccessStatusCode();
var user = await response.Content.ReadAsStringAsync();
For file I/O, consider buffering data in memory and then writing the buffered data to a file as a single operation. This approach reduces the overhead from repeatedly opening and closing the file, and helps to reduce fragmentation of the file on disk.
// Save a list of customer objects to a file
private async Task SaveCustomerListToFileAsync(List<Customer> customers)
{
    using (Stream fileStream = new FileStream(CustomersFileName, FileMode.Append))
    {
        BinaryFormatter formatter = new BinaryFormatter();
        foreach (var customer in customers)
        {
            byte[] data = null;
            using (MemoryStream memStream = new MemoryStream())
            {
                formatter.Serialize(memStream, customer);
                data = memStream.ToArray();
            }
            await fileStream.WriteAsync(data, 0, data.Length);
        }
    }
}

// In-memory buffer for customers.
List<Customer> customers = new List<Customers>();

// Create a new customer and add it to the buffer
var customer = new Customer(...);
customers.Add(customer);

// Add more customers to the list as they are created
...

// Save the contents of the list, writing all customers in a single operation
await SaveCustomerListToFileAsync(customers);
Considerations
The first two examples make fewer I/O calls, but each one retrieves more information. You must consider the tradeoff between these two factors. The right answer will depend on the actual usage patterns. For example, in the web API example, it might turn out that clients often need just the user name. In that case, it might make sense to expose it as a separate API call. For more information, see the Extraneous Fetching antipattern.
When reading data, do not make your I/O requests too large. An application should only retrieve the information that it is likely to use.
Sometimes it helps to partition the information for an object into two chunks, frequently accessed data that accounts for most requests, and less frequently accessed data that is used rarely. Often the most frequently accessed data is a relatively small portion of the total data for an object, so returning just that portion can save significant I/O overhead.
When writing data, avoid locking resources for longer than necessary, to reduce the chances of contention during a lengthy operation. If a write operation spans multiple data stores, files, or services, then adopt an eventually consistent approach. See Data Consistency guidance.
If you buffer data in memory before writing it, the data is vulnerable if the process crashes. If the data rate typically has bursts or is relatively sparse, it may be safer to buffer the data in an external durable queue such as Event Hubs.
Consider caching data that you retrieve from a service or a database. This can help to reduce the volume of I/O by avoiding repeated requests for the same data. For more information, see Caching best practices.
How to detect the problem
Symptoms of chatty I/O include high latency and low throughput. End users are likely to report extended response times or failures caused by services timing out, due to increased contention for I/O resources.
You can perform the following steps to help identify the causes of any problems:
- Perform process monitoring of the production system to identify operations with poor response times.
- Perform load testing of each operation identified in the previous step.
- During the load tests, gather telemetry data about the data access requests made by each operation.
- Gather detailed statistics for each request sent to a data store.
- Profile the application in the test environment to establish where possible I/O bottlenecks might be occurring.
Look for any of these symptoms:
- A large number of small I/O requests made to the same file.
- A large number of small network requests made by an application instance to the same service.
- A large number of small requests made by an application instance to the same data store.
- Applications and services becoming I/O bound.
Example diagnosis
The following sections apply these steps to the example shown earlier that queries a database.
Load test the application
This graph shows the results of load testing. Median response time is measured in tens of seconds per request. The graph shows very high latency. With a load of 1000 users, a user might have to wait for nearly a minute to see the results of a query.
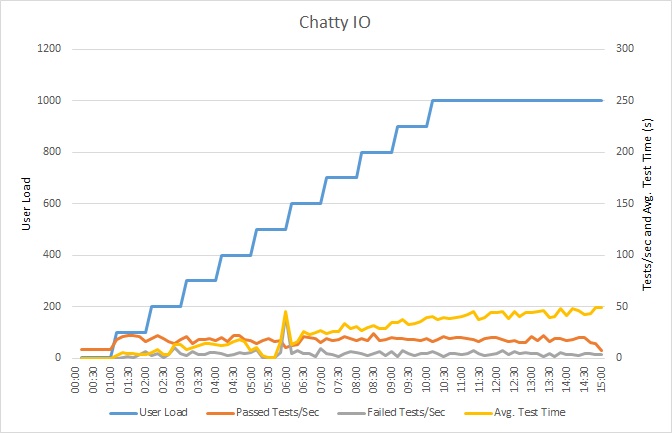
Note
The application was deployed as an Azure App Service web app, using Azure SQL Database. The load test used a simulated step workload of up to 1000 concurrent users. The database was configured with a connection pool supporting up to 1000 concurrent connections, to reduce the chance that contention for connections would affect the results.
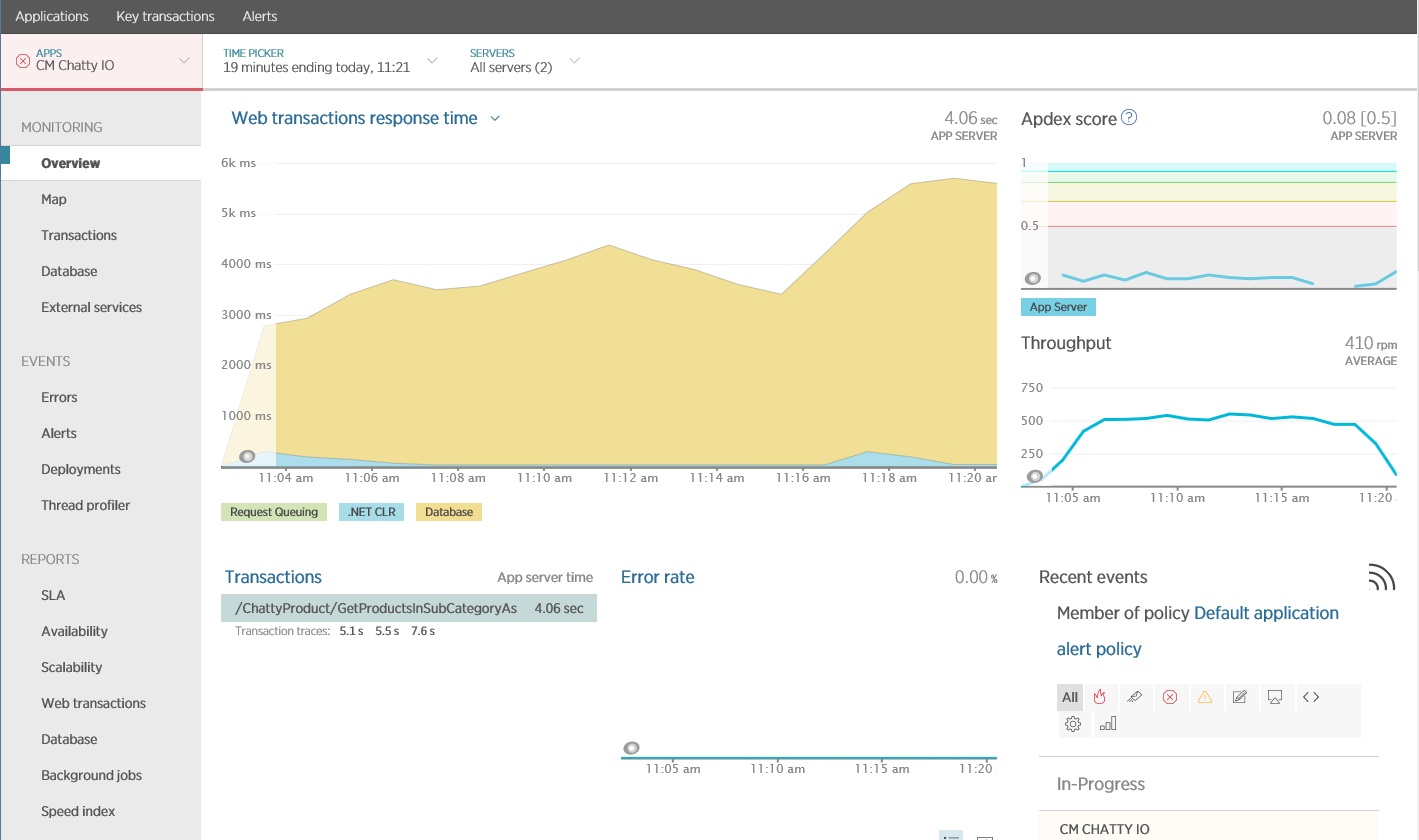
Monitor the application
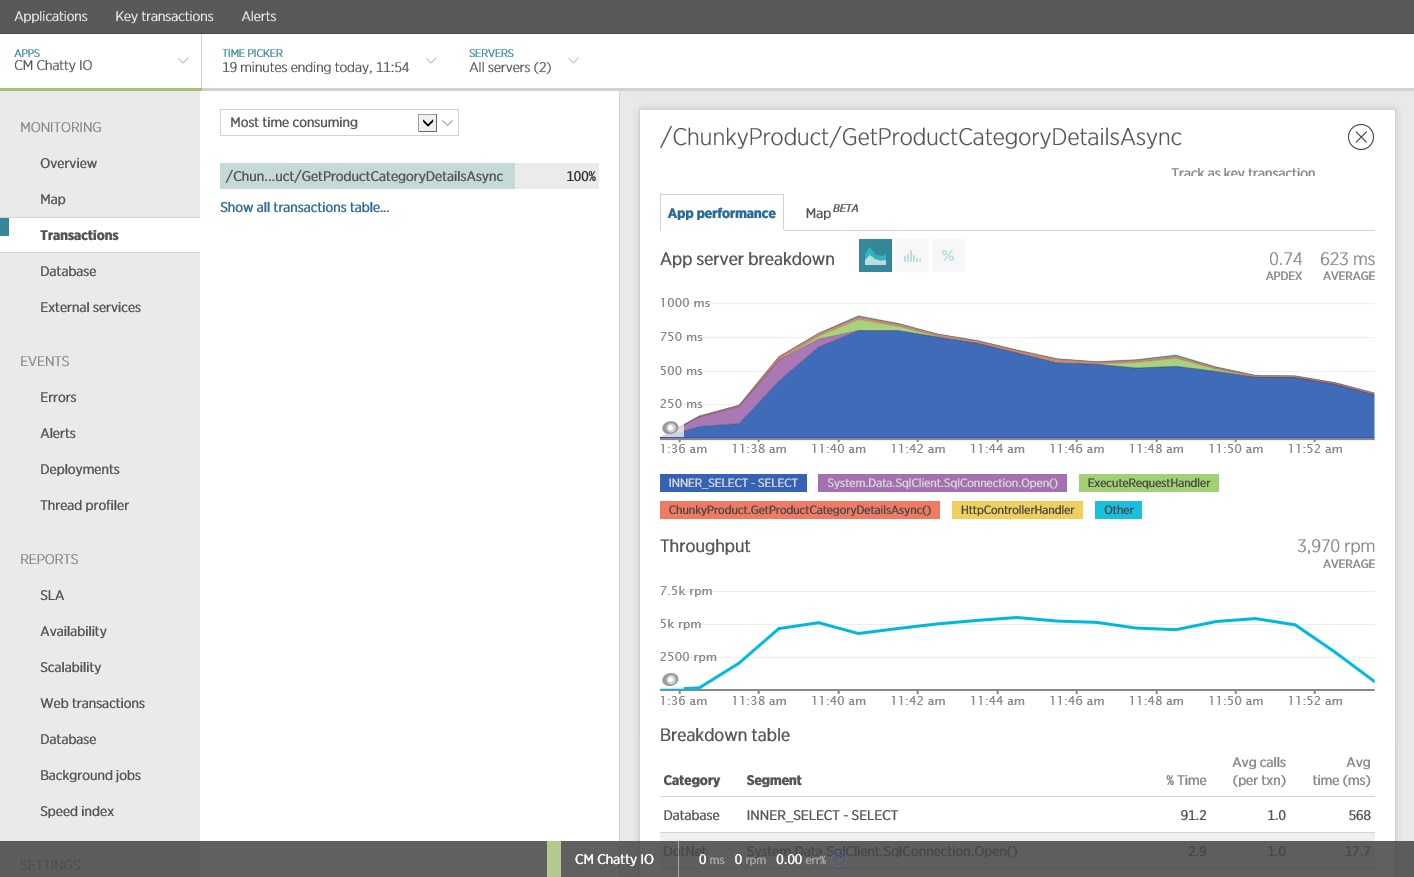
You can use an application performance monitoring (APM) package to capture and analyze the key metrics that might identify chatty I/O. Which metrics are important will depend on the I/O workload. For this example, the interesting I/O requests were the database queries.
The following image shows results generated using New Relic APM. The average database response time peaked at approximately 5.6 seconds per request during the maximum workload. The system was able to support an average of 410 requests per minute throughout the test.
Gather detailed data access information
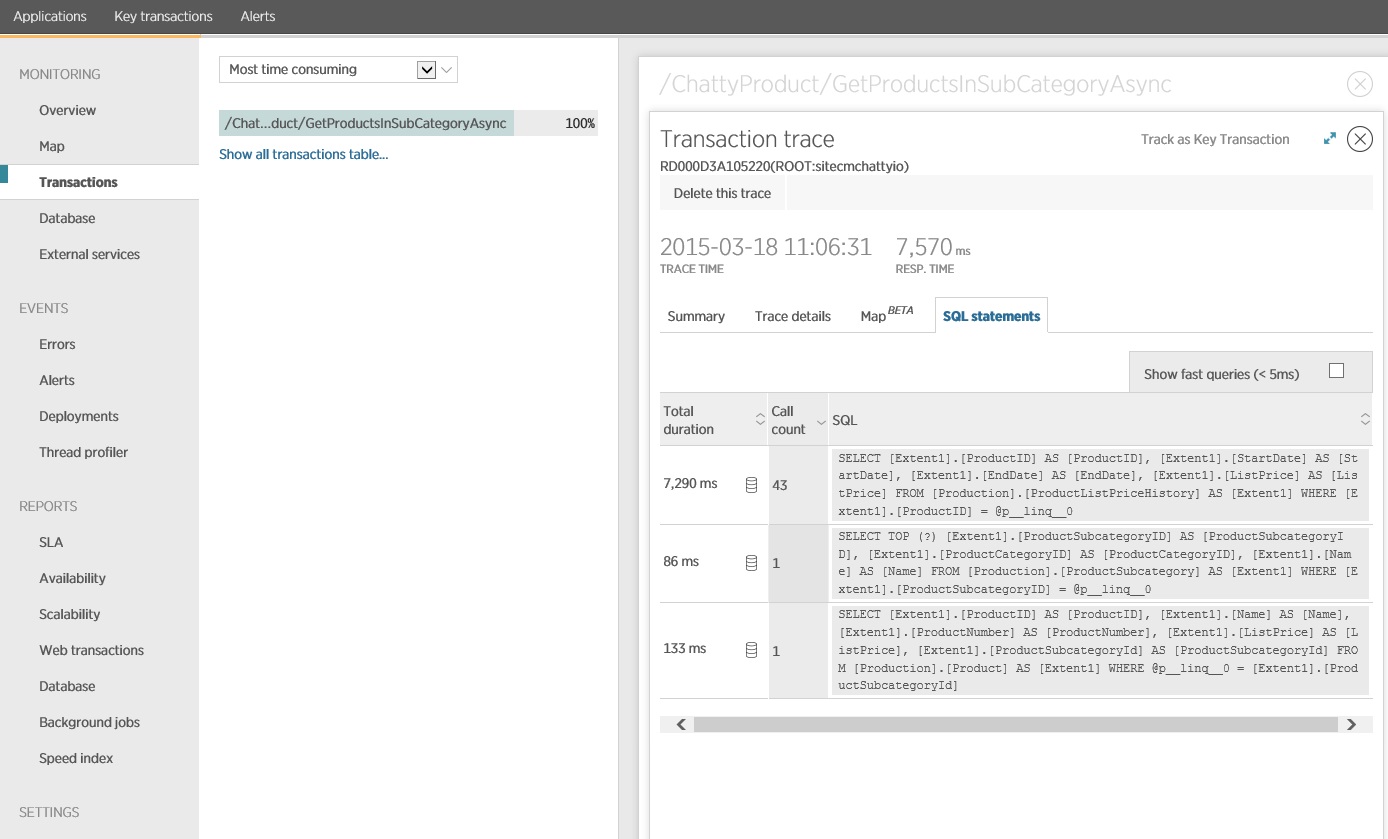
Digging deeper into the monitoring data shows the application executes three different SQL SELECT statements. These correspond to the requests generated by Entity Framework to fetch data from the ProductListPriceHistory, Product, and ProductSubcategory tables. Furthermore, the query that retrieves data from the ProductListPriceHistory table is by far the most frequently executed SELECT statement, by an order of magnitude.
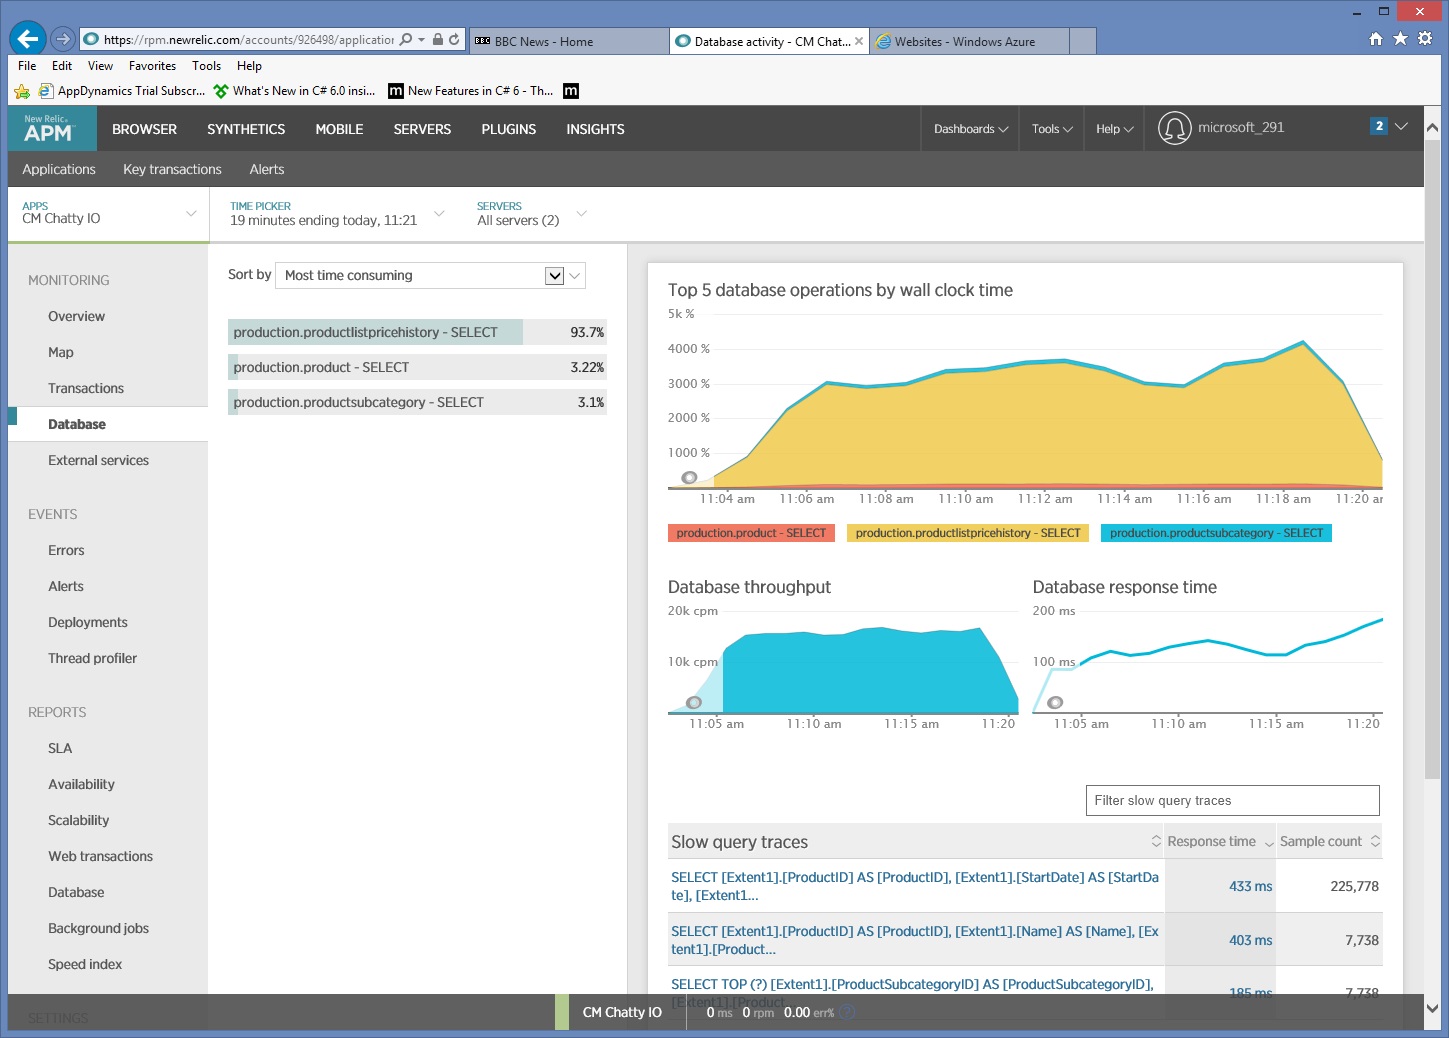
It turns out that the GetProductsInSubCategoryAsync method, shown earlier, performs 45 SELECT queries. Each query causes the application to open a new SQL connection.
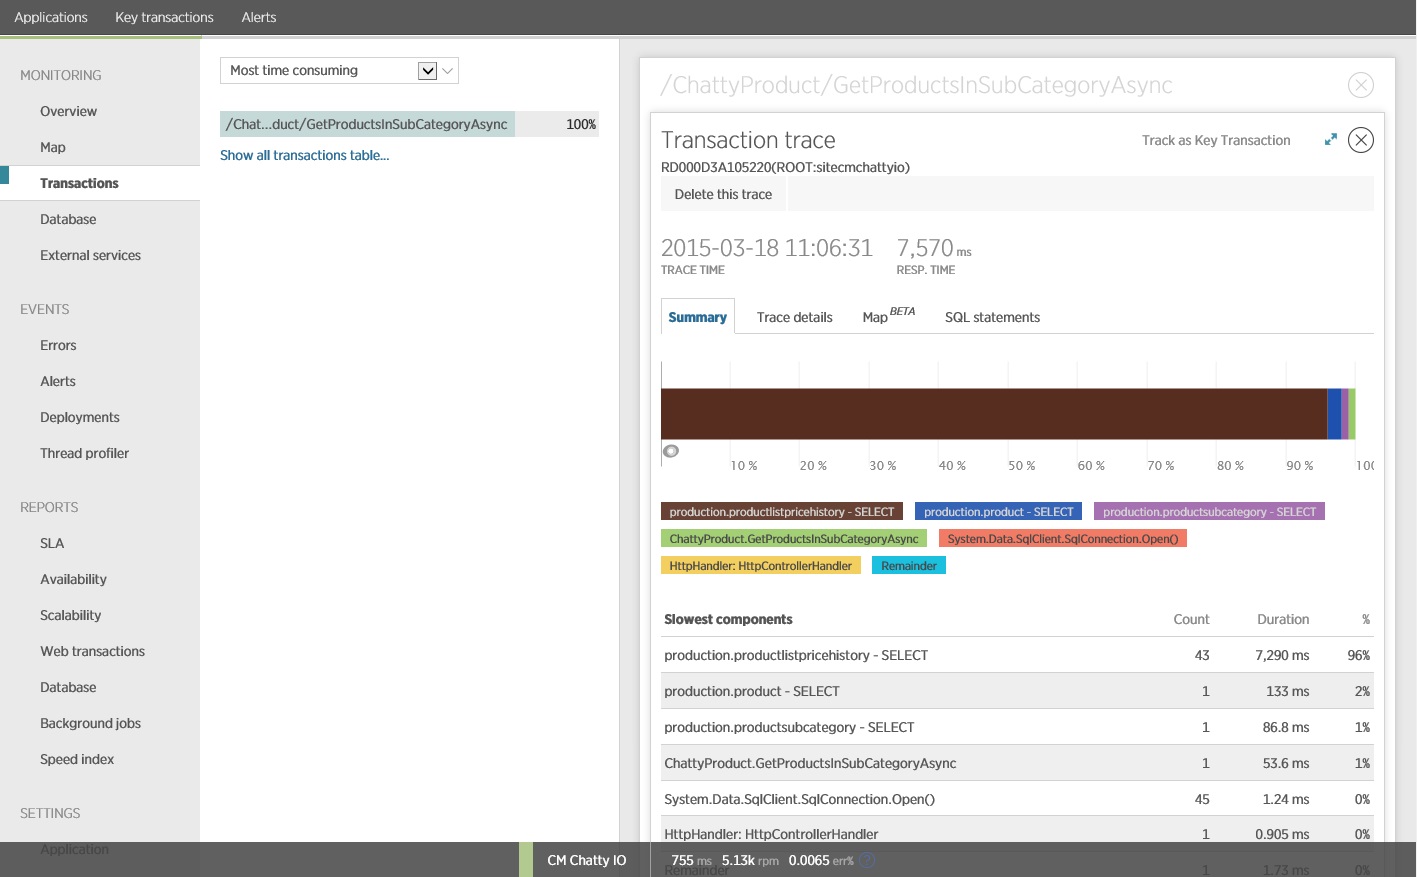
Note
This image shows trace information for the slowest instance of the GetProductsInSubCategoryAsync operation in the load test. In a production environment, it's useful to examine traces of the slowest instances, to see if there is a pattern that suggests a problem. If you just look at the average values, you might overlook problems that will get dramatically worse under load.
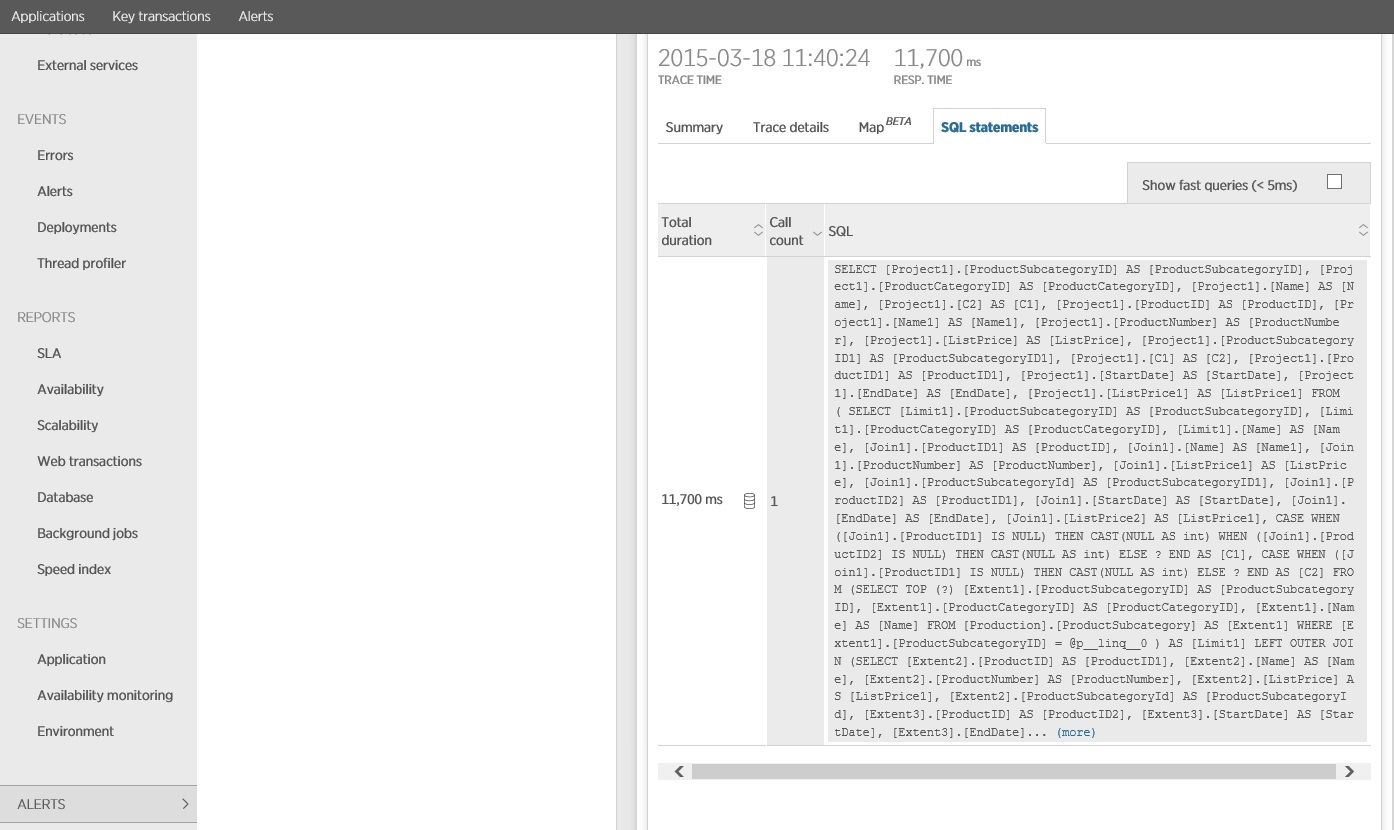
The next image shows the actual SQL statements that were issued. The query that fetches price information is run for each individual product in the product subcategory. Using a join would considerably reduce the number of database calls.
If you are using an O/RM, such as Entity Framework, tracing the SQL queries can provide insight into how the O/RM translates programmatic calls into SQL statements, and indicate areas where data access might be optimized.
Implement the solution and verify the result
Rewriting the call to Entity Framework produced the following results.
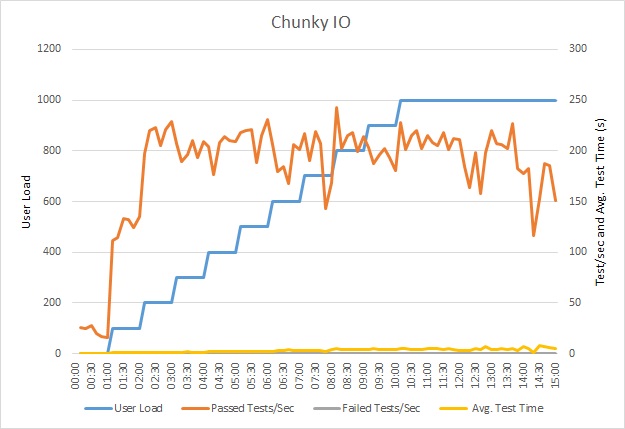
This load test was performed on the same deployment, using the same load profile. This time the graph shows much lower latency. The average request time at 1000 users is between 5 and 6 seconds, down from nearly a minute.
This time the system supported an average of 3,970 requests per minute, compared to 410 for the earlier test.
Tracing the SQL statement shows that all the data is fetched in a single SELECT statement. Although this query is considerably more complex, it is performed only once per operation. And while complex joins can become expensive, relational database systems are optimized for this type of query.
Related resources
Feedback
Coming soon: Throughout 2024 we will be phasing out GitHub Issues as the feedback mechanism for content and replacing it with a new feedback system. For more information see: https://aka.ms/ContentUserFeedback.
Submit and view feedback for