This article describes how to run the Power Systems Computer Aided Design (PSCAD) application on a virtual machine (VM) that's deployed on Azure. It also presents the performance results of running PSCAD.
PSCAD is a powerful and flexible graphical user interface for the Electromagnetic Transients including Direct Current (EMTDC) electromagnetic transient simulation engine. With PSCAD, you can schematically construct a circuit, run a simulation, analyze the results, and manage the data in an integrated, graphical environment.
PSCAD offers the following benefits:
A library of preprogrammed and tested simulation models. PSCAD has simple, passive elements and control functions and also more complex models, such as electric machines, full-on flexible alternating current transmission system (FACTS) devices, and transmission lines and cables.
Online plotting functions, controls, and meters, so you can alter system parameters during a simulation run and view the effects while the simulation is in progress.
You can use PSCAD in many areas of the energy sector, like utilities and wind farms. You can also use it in industries like equipment manufacturing, consulting, research, and academics. Regulators can use PSCAD for functions like planning, operations, design, commissioning, teaching, and research.
Why deploy PSCAD on Azure?
Modern and diverse compute options to align to your workload's needs
The flexibility of virtualization without the need to buy and maintain physical hardware
Rapid provisioning
Cost optimization by using fewer cores for simple simulations and adding more cores for complex simulations
Architecture

Download a Visio file of this architecture.
Components
Azure Virtual Machines is used to create a Windows VM. For information about deploying the VM and installing the drivers, see Windows VMs on Azure.
An Azure Premium SSD is used for OS disk and for storage.
Azure Virtual Network is used to create a private network infrastructure in the cloud.
Network security groups are used to restrict access to the VM.
A public IP address connects the internet to the VM.
Compute sizing and drivers
The performance tests of PSCAD on Azure used HBv3-series and HBv4-series VMs that run on Windows OS.
The following table provides the configuration details of the HBv3-series VM:
| VM size | vCPU | Memory (GiB) | Memory bandwidth (GB/s) | Base CPU frequency (GHz) | All-cores frequency (GHz, peak) | Single-core frequency (GHz, peak) | Remote direct memory access (RDMA) performance (Gb/s) |
|---|---|---|---|---|---|---|---|
| Standard_HB120-16rs_v3 | 16 | 448 | 350 | 1.9 | 3.0 | 3.5 | 200 |
| Standard_HB120-32rs_v3 | 32 | 448 | 350 | 1.9 | 3.0 | 3.5 | 200 |
| Standard_HB120-64rs_v3 | 64 | 448 | 350 | 1.9 | 3.0 | 3.5 | 200 |
| Standard_HB120-96rs_v3 | 96 | 448 | 350 | 1.9 | 3.0 | 3.5 | 200 |
| Standard_HB120-120rs_v3 | 120 | 448 | 350 | 1.9 | 3.0 | 3.5 | 200 |
The following table provides the configuration details for the HBv4-series VM:
| VM size | vCPU | Memory (GiB) | Memory bandwidth (GB/s) | Base CPU frequency (GHz) | Max data disks) | Single-core frequency (GHz, peak) | RDMA performance (Gb/s) |
|---|---|---|---|---|---|---|---|
| Standard_HB176-24rs_v4 | 24 | 704 | 780 | 2.4 | 32 | 3.7 | 400 |
| Standard_HB176-48rs_v4 | 48 | 704 | 780 | 2.4 | 32 | 3.7 | 400 |
| Standard_HB176-96rs_v4 | 96 | 704 | 780 | 2.4 | 32 | 3.7 | 400 |
| Standard_HB176-144rs_v4 | 144 | 704 | 780 | 2.4 | 32 | 3.7 | 400 |
| Standard_HB176rs_v4 | 176 | 704 | 780 | 2.4 | 32 | 3.7 | 400 |
PSCAD installation
Before you install PSCAD, you need to deploy and connect a VM. For information about deploying the VM, see Run a Windows VM on Azure.
Follow these steps to download and install PSCAD:
Register a MyCentre user account if you don't already have one.
Send an email to the PSCAD sales desk requesting the PSCAD software. Use an email with your facility’s email domain.
Sign in to MyCentre and download the software from the Downloads tab. The software downloads and setup instructions are in your MyCentre user account. For more information, see PSCAD Knowledge Base.
PSCAD performance results
The performance tests of PSCAD on Azure used HBv3-series and HBv4-series VMs that run on a Windows 10 OS with a 64-bit architecture.
The Province-80 test case model is used to test the performance of PSCAD on Azure HBv3-series and HBv4-series VMs.
Model details
The Province-80 test case is composed of a large network that covers a geographical area in North America. The network has seven individual zones that serve each of its populous geographical areas. The test case uses multiple EMTDC processes to distribute computational loading across multiple cores, which demonstrates task parallel processing. The model is split into 80 cases of 1D simulations. The complexity of the model is dependent on the number of splits. The following components were used:
| Components | Number of components |
|---|---|
| Buses (AC systems) | 2500 |
| Synchronous and inverter-based generators | 400 |
| Transmission lines and cables | 2500 |
| Transformers | 1500 |
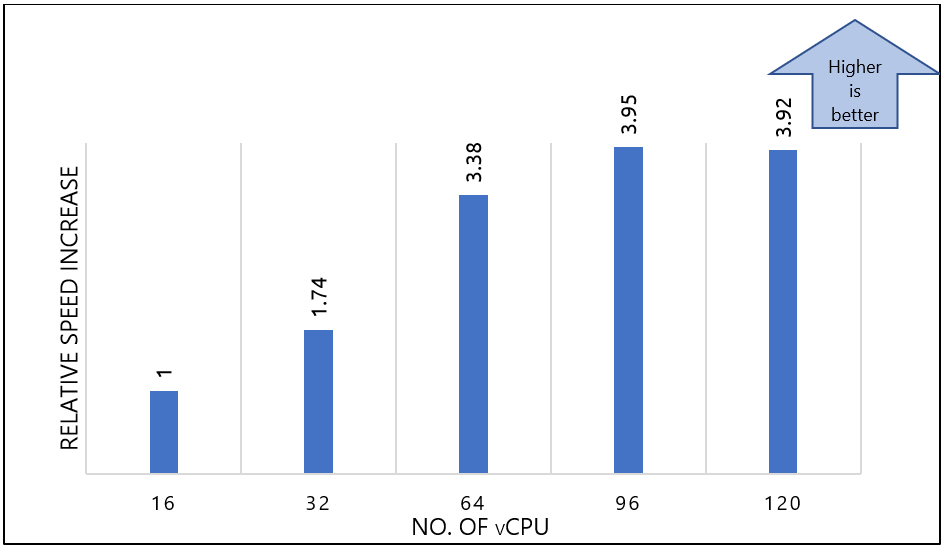
Results on HBv3-series VMs
The following table shows the results of the Province-80 model on HBv3-series VMs:
| VM size | No. of vCPU used | Total elapsed time, in seconds (sec) | Relative speed increase |
|---|---|---|---|
| Standard_HB120-16rs_v3 | 16 | 3031 | 1.00 |
| Standard_HB120-32rs_v3 | 32 | 1743 | 1.74 |
| Standard_HB120-64rs_v3 | 64 | 897 | 3.38 |
| Standard_HB120-96rs_v3 | 96 | 767 | 3.95 |
| Standard_HB120-120rs_v3 | 120 | 774 | 3.92 |
The following chart shows the relative speed increase:
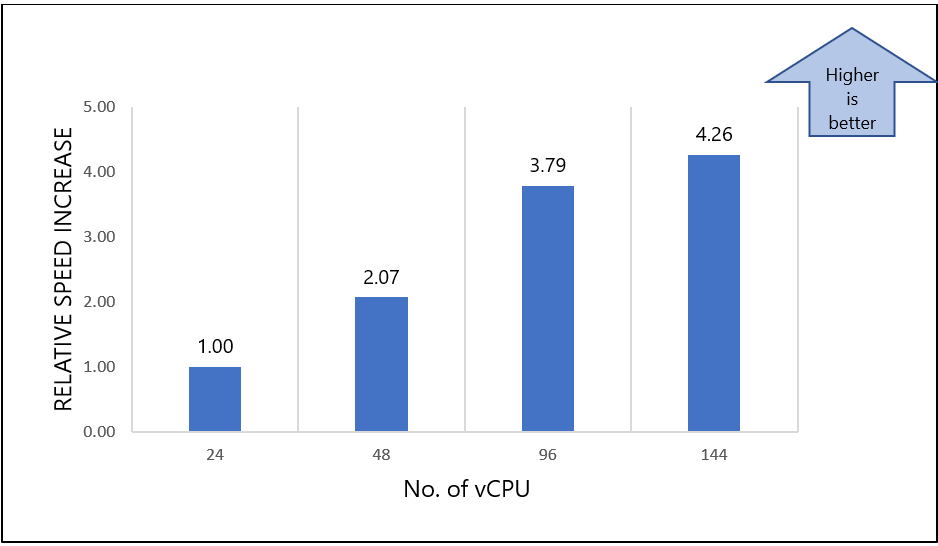
Results on HBv4-series VMs
The following table shows the results of the Province-80 model on HBv4-series VMs:
| VM size | No. of vCPU used | Total elapsed time (sec) | Relative speed increase |
|---|---|---|---|
| Standard_HB176-24rs_v4 | 24 | 2336 | 1.00 |
| Standard_HB176-48rs_v4 | 48 | 1128 | 2.07 |
| Standard_HB176-96rs_v4 | 96 | 617 | 3.79 |
| Standard_HB176-144rs_v4 | 144 | 548 | 4.26 |
The following chart shows the relative speed increase:
Azure cost
For the cost calculations, only the model runtime is considered. Application installation time isn't considered. The calculations are indicative.
The following summary describes the cost consumption on HBv3-series VMs:
To evaluate the cost performance of the configurations, the Standard_HB120-16rs_v3 configuration is used as a baseline.
Azure cost decreases for each increment as the VM size increases from 16 vCPUs to the highest configuration of 120 vCPUs.
Linear scalability occurs in terms of performance. The HBv3 series cost per hour is the same across all VM configurations, so we recommend that you use the higher vCPU size to take advantage of performance.
The following summary describes the cost consumption on HBv4-series VMs:
To evaluate the cost performance of the configurations, the Standard_HB176-24rs_v4 configuration is used as a baseline.
Azure cost decreases for each increment as the size increases from 24 vCPUs to the highest configuration of 144 vCPUs.
Linear scalability occurs in terms of performance. The HBv4 series cost per hour is the same across all VM configurations, so we recommend that you use the higher vCPU size to take advantage of performance.
The HBv4-series VM with 96 vCPUs has about a 24% performance increase compared to the HBv3-series VM with 96 vCPUs.
Summary
PSCAD on Azure provides high scalability when you deploy it on HBv3-series (AMD EPYC™ 7V73X Milan-X CPU cores) and HBv4-series (AMD EPYC™ 9V33X Genoa-X CPU cores) VMs.
For both series' performance evaluations, the lowest VM configuration is the baseline: 16 cores for HBv3-series VMs and 24 cores for HBv4-series VMs. The results are assessed based on the relative performance. Higher values indicate better performance.
On HBv3-series VMs, the model gets more complex as the number of cores doubles, so there's an approximate 2X increase in the relative speed up to 64 cores and moderate increases for more than 64 cores.
Similarly, on HBv4-series VMs, there's a performance increase of approximately 2X to 4.3X between the 48-core and 144-core configurations.
You can achieve higher scalability based on the increased complexity of the model when you have more than 96 cores on HBv3-series VMs and 144 cores on HBv4-series VMs.
Contributors
This article is maintained by Microsoft. It was originally written by the following contributors.
Principal authors:
- Hari Bagudu | Senior Manager
- Gauhar Junnarkar | Principal Program Manager
- Saurabh Parave | HPC Performance Engineer
- Karbasappa Umadi | HPC Performance Engineer
Other contributors:
- Guy Bursell | Business Strategy Director
- Sachin Rastogi | Manager
To see non-public LinkedIn profiles, sign in to LinkedIn.
Next steps
- GPU-optimized VM sizes
- Windows VMs in Azure
- Linux VMs in Azure
- Virtual networks and VMs in Azure
- Learning path: Run HPC applications on Azure