Sources tool overview
Use the Sources tool to view, modify, and debug front-end JavaScript code, and to inspect the resources that make up the current webpage.
Detailed contents:
- The Navigator, Editor, and Debugger panes
- Using the Navigator pane to select files
- Using the Page tab to explore resources that construct the current webpage
- Using the Filesystem tab to define a local Workspace
- Using the Overrides tab to override server files with local files
- Using the Content scripts tab for Microsoft Edge extensions
- Using the Snippets tab to run JavaScript code snippets on any webpage
- Using the Command Menu to open files
- Using the Editor pane to view or edit files
- Editing a JavaScript file
- Reformatting a minified JavaScript file with pretty-print
- Mapping minified code to your source code to show readable code
- Transformations from source code to compiled front-end code
- Editing a CSS file
- Editing an HTML file
- Going to a line number or function
- Displaying source files when using a different tool
- Using the Debugger pane to debug JavaScript code
The Navigator, Editor, and Debugger panes
The Sources tool has three panes:
| Pane | Actions |
|---|---|
| Navigator pane | Navigate among the resources that are returned from the server to construct the current webpage. Select files, images, and other resources, and view their paths. Optionally, set up a local Workspace to save changes directly to source files. |
| Editor pane | View JavaScript, HTML, CSS, and other files that are returned from the server. Make experimental edits to JavaScript or CSS. Your changes are preserved until you refresh the page, or are preserved after page refresh if you save to a local file with Workspaces. When you use Workspaces or Overrides, you can edit HTML files as well. |
| Debugger pane | Use the JavaScript Debugger to set breakpoints, pause running JavaScript, and step through the code, including any edits you have made, while watching any JavaScript expressions you specify. Watch and manually change the values of variables that are in-scope for the current line of code. |
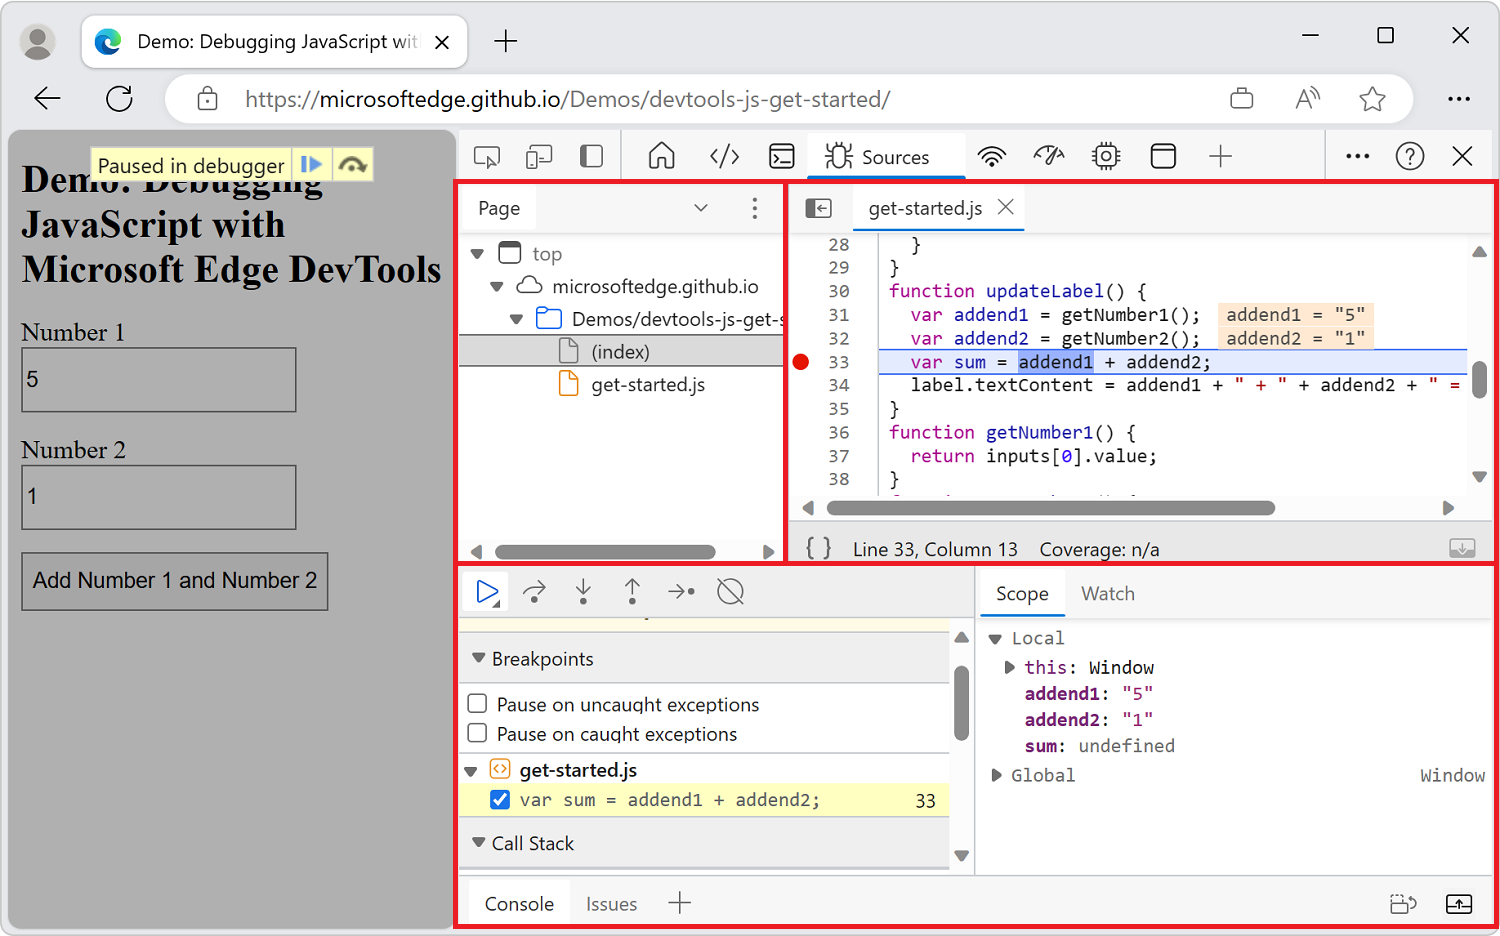
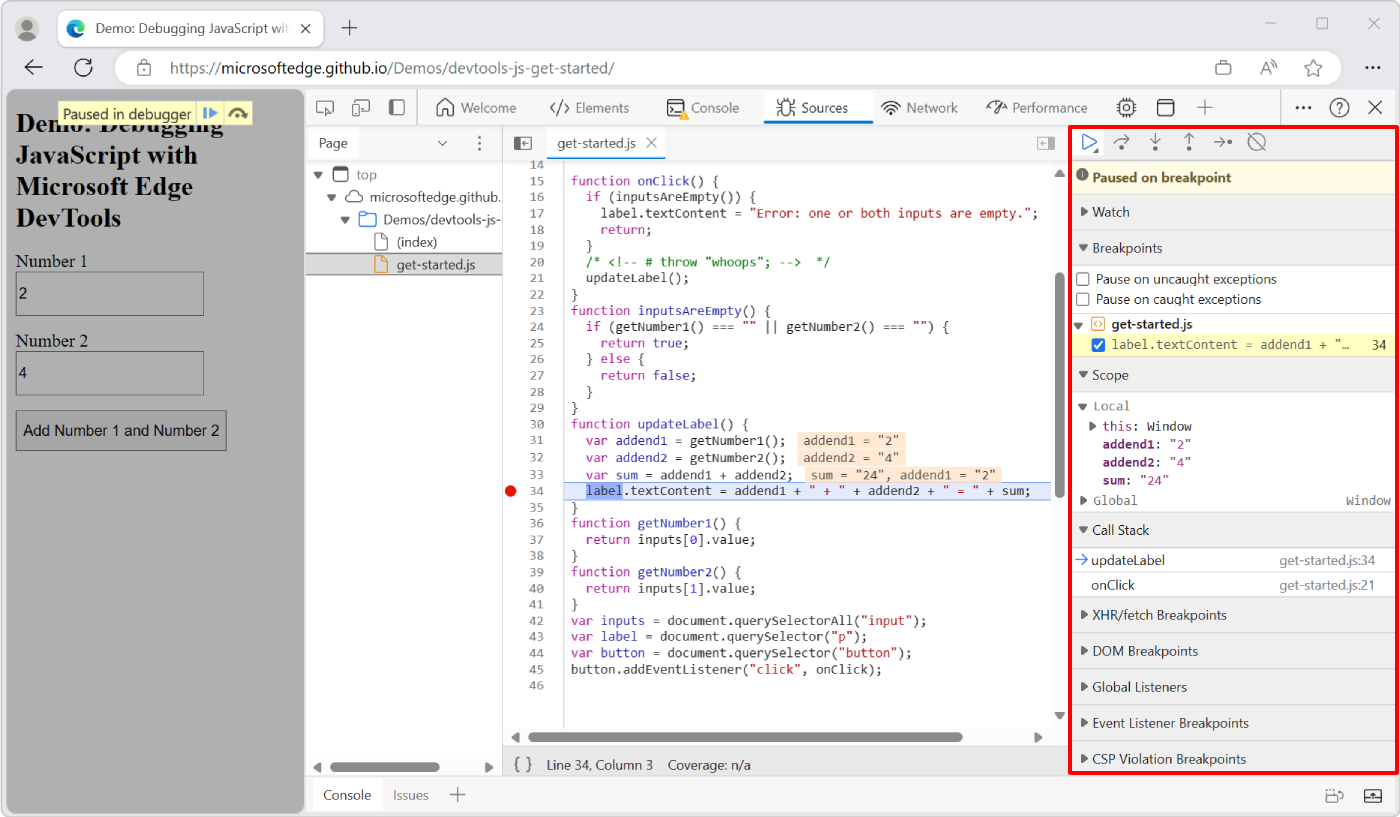
The following figure shows the Navigator pane highlighted with a red box in the upper left corner of DevTools, the Editor pane highlighted in the upper right, and the Debugger pane highlighted on the bottom. On the far left side is the main part of the browser window, showing the rendered webpage grayed-out because the debugger is paused on a breakpoint:
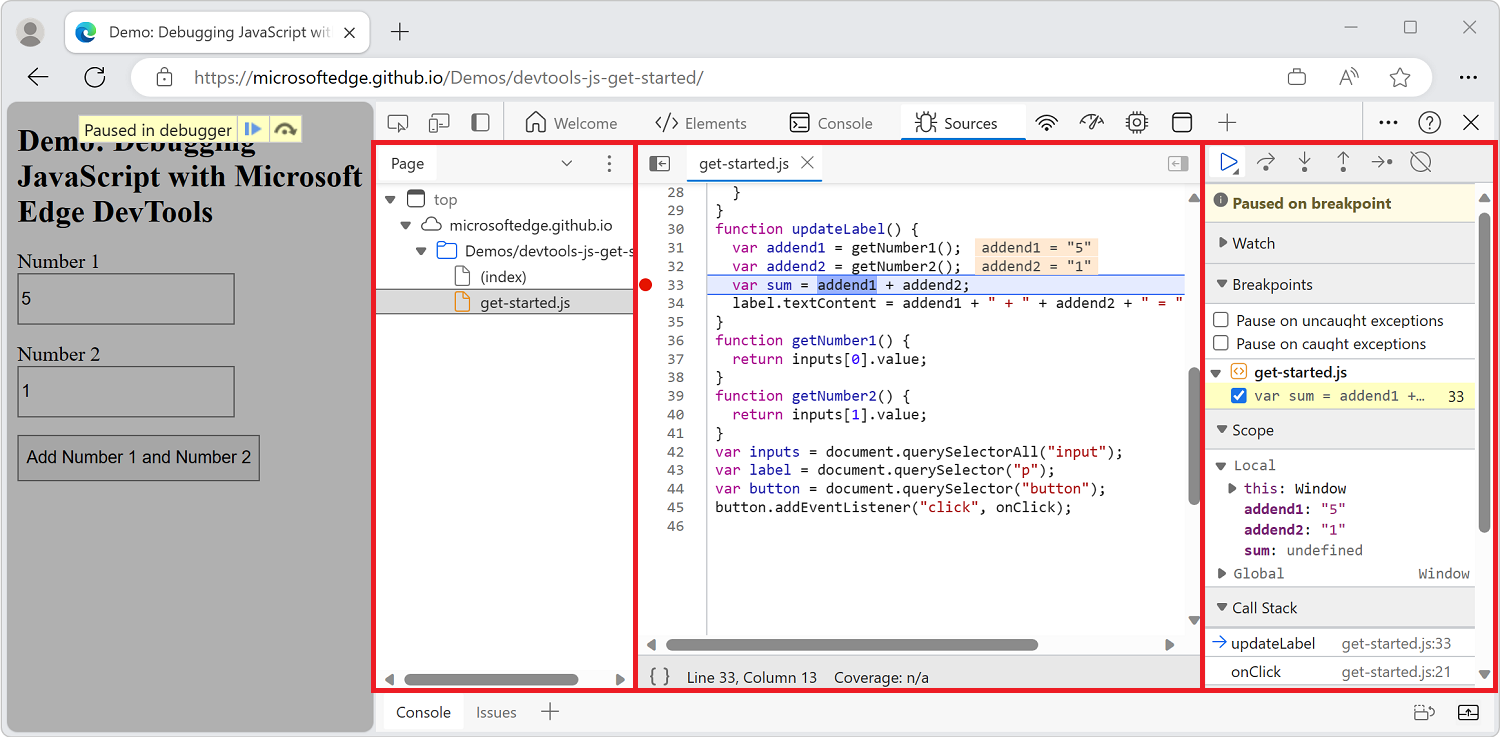
When DevTools is wide, the Debugger pane is placed on the right, and includes Scope and Watch:
To maximize the size of the Sources tool, undock DevTools into a separate window, and optionally move the DevTools window to a separate monitor. See Change DevTools placement (Undock, Dock to bottom, Dock to left).
To load the debugging demo webpage that's shown above, see The basic approach to using a debugger, below.
Using the Navigator pane to select files
Use the Navigator pane (on the left) to navigate among the resources that are returned from the server to construct the current webpage. Select files, images, and other resources, and view their paths.
To access any hidden tabs of the Navigator pane, click the More tabs (![]() ) button.
) button.
The following subsections cover the Navigator pane:
- Using the Page tab to explore resources that construct the current webpage
- Using the Filesystem tab to define a local Workspace
- Using the Overrides tab to override server files with local files
- Using the Content scripts tab for Microsoft Edge extensions
- Using the Snippets tab to run JavaScript code snippets on any page
- Using the Command Menu to open files
Using the Page tab to explore resources that construct the current webpage
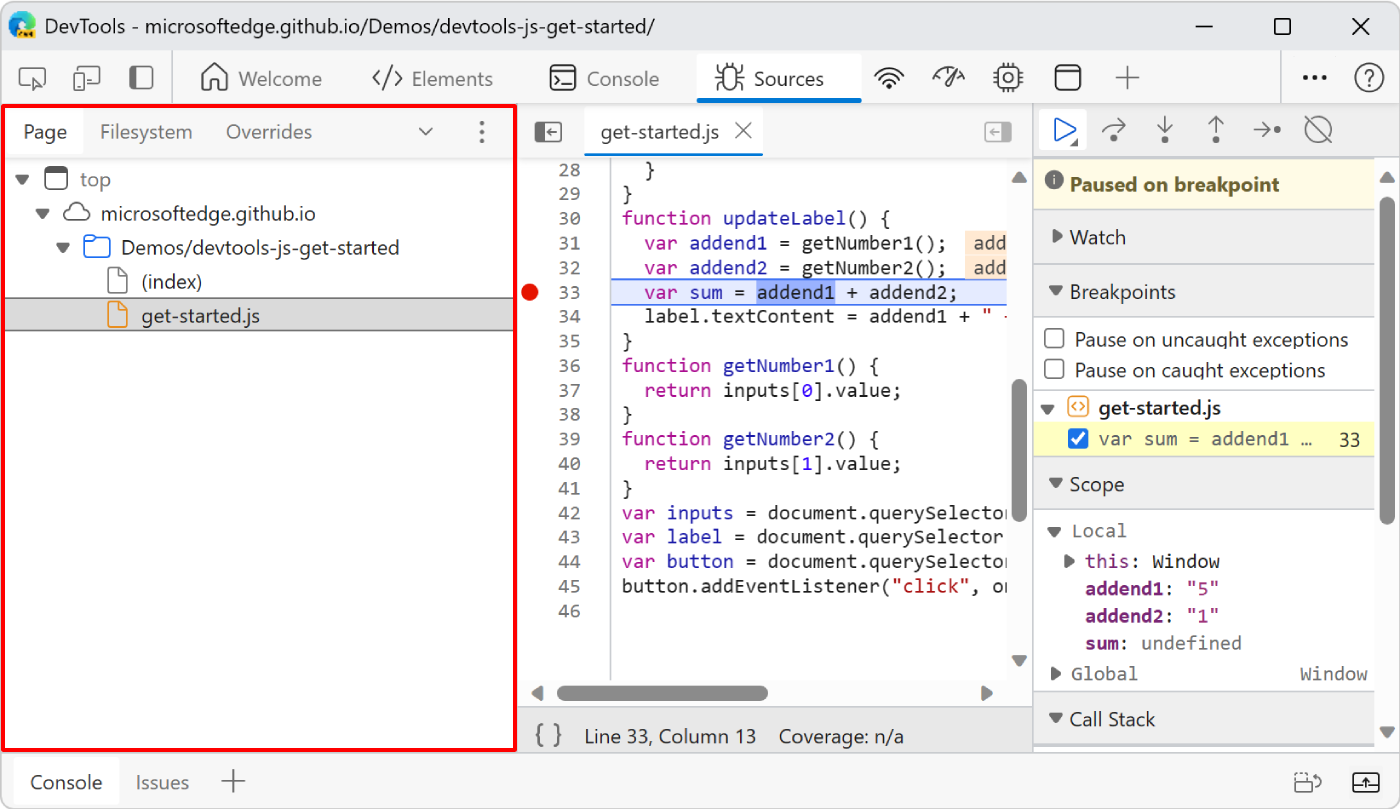
Use the Page tab of the Navigator pane to explore the file system that's returned from the server to construct the current webpage. Select a JavaScript file to view, edit, and debug it. The Page tab lists all of the resources that the page has loaded.

To display a file in the Editor pane, select a file in the Page tab. For an image, a preview of the image is displayed.
To display the URL or path for a resource, hover over the resource.
To load a file into a new tab of the browser, or to display other actions, right-click on the file name.
Icons in the Page tab
The Page tab uses the following icons:
- The window icon, along with the label
top, represents the main document frame, which is an HTML frame:
- The cloud icon represents an origin:

- The folder icon represents a directory:

- The page icon represents a resource:

Group files by folder or as a flat list
The Page tab displays files or resources grouped by server and directory, or as a flat list.
To change how resources are grouped:
- Next to the tabs on the Navigator pane (on the left), select the ... (More options) button. A menu appears.
- Select or clear the Group by folder option.
Using the Filesystem tab to define a local Workspace
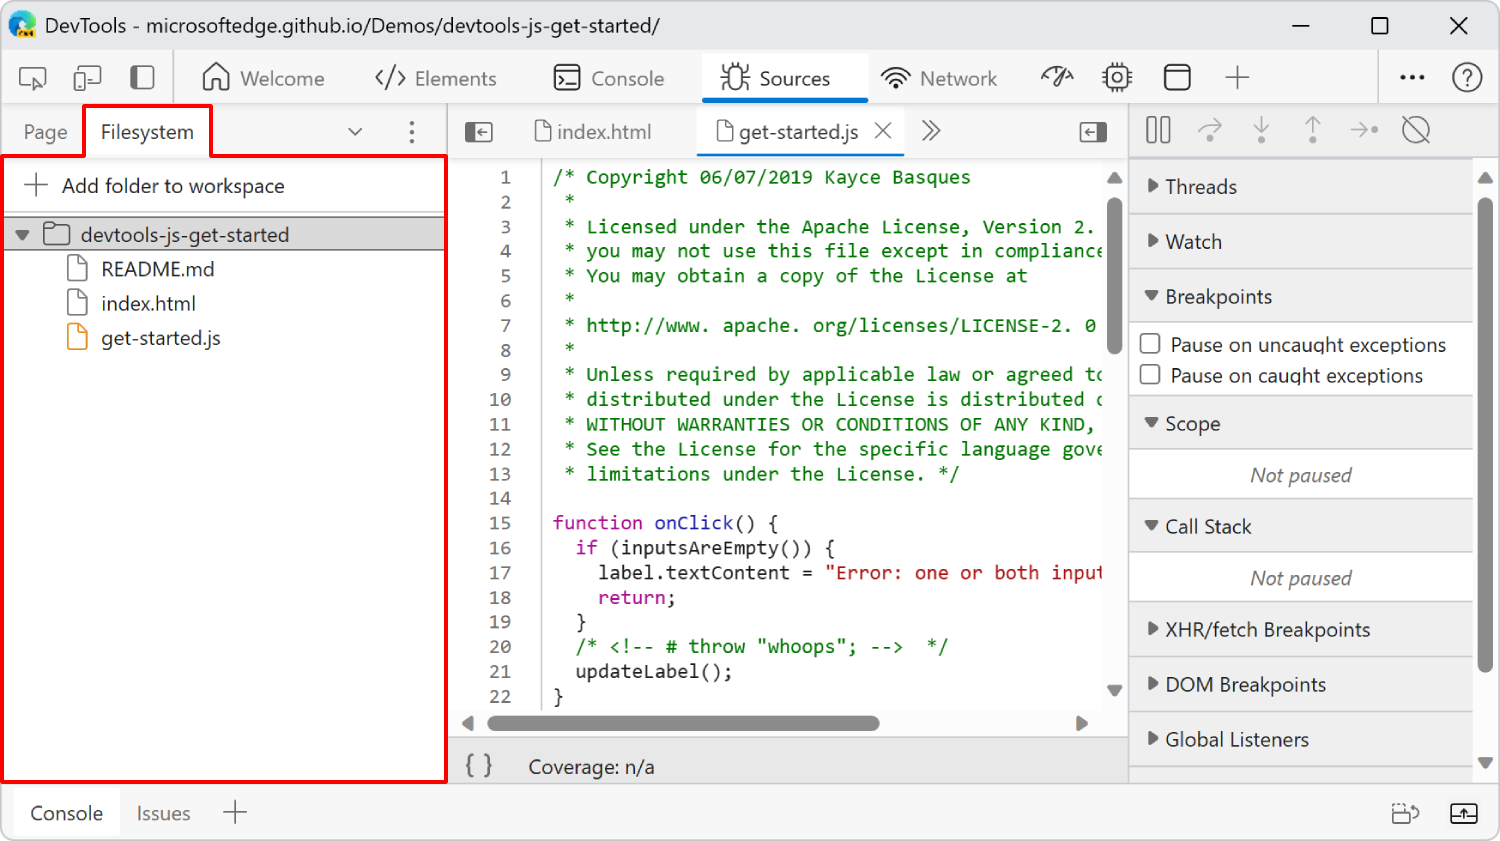
Use the Filesystem tab of the Navigator pane to add files to a Workspace, so that changes you make in DevTools get saved to your local file system.
By default, when you edit a file in the Sources tool, your changes are discarded when you refresh the webpage. The Sources tool works with a copy of the front-end resources that are returned by the web server. When you modify these front-end files that are returned by the server, the changes don't persist, because you didn't change the source files. You need to also apply your edits in your actual source code, and then re-deploy to the server.
In contrast, when you use a Workspace, changes that you make to your front-end code are preserved when you refresh the webpage. With a Workspace, when you edit the front-end code that's returned by the server, the Sources tool also applies your edits to your local source code. Then for other users to see your changes, you only need to redeploy your changed source files to the server.
Workspaces work well when the JavaScript code that's returned by the server is the same as your local JavaScript source code. Workspaces don't work as well when your workflow involves transformations on your source code, such as minification or TypeScript compilation.
See also:
- Edit files with Workspaces (Filesystem tab)
- Open a demo folder in the Sources tool and edit a file in Sample code for DevTools.
Using the Overrides tab to override server files with local files
Use the Overrides tab of the Navigator pane to override page assets (such as images) with files from a local folder.
Items in this tab override what the server sends to the browser, even after the server has sent the assets.
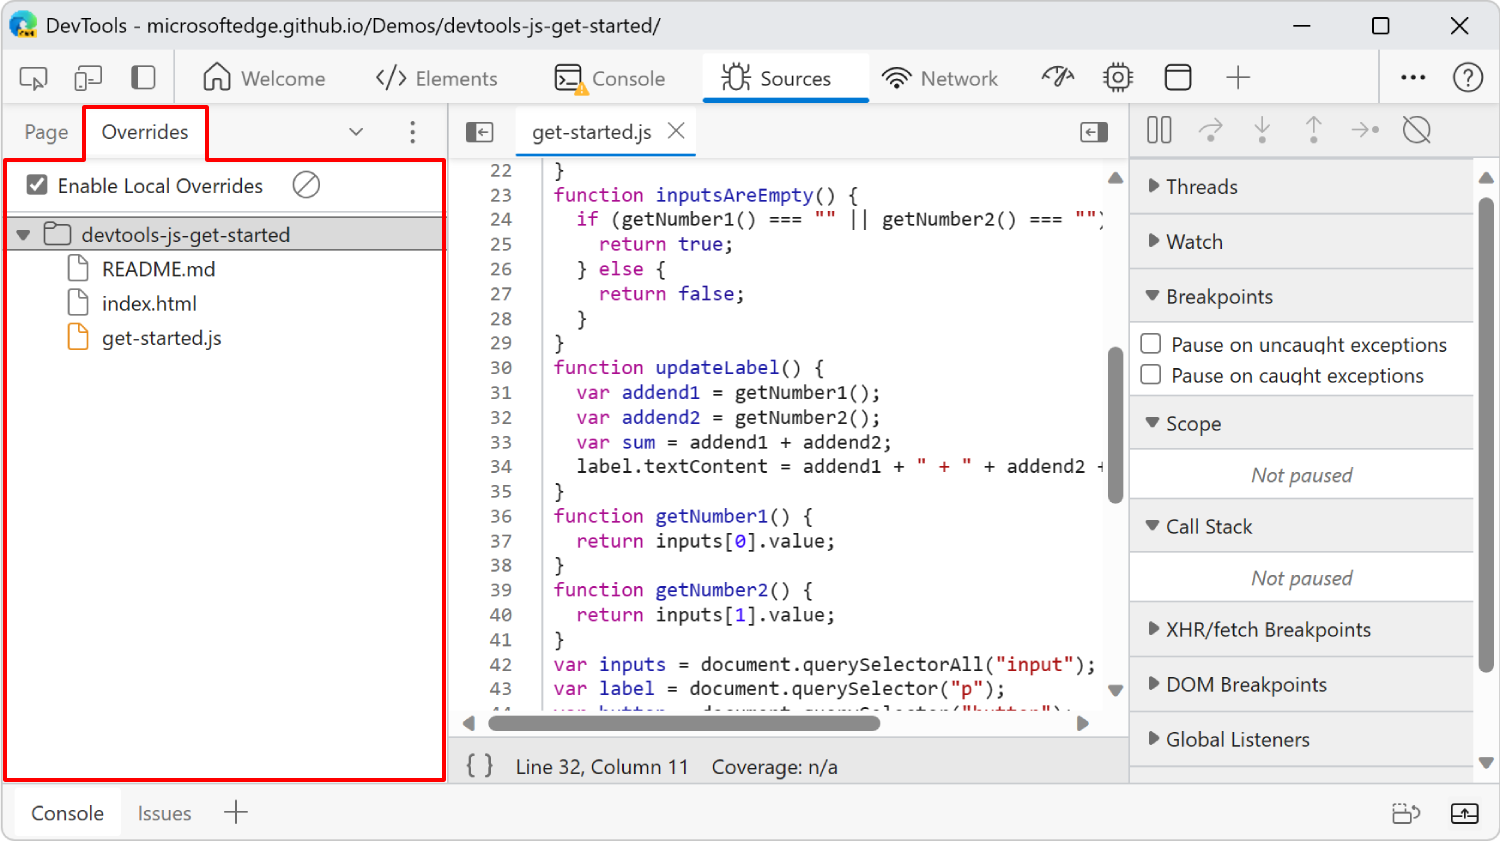
The Overrides feature is similar to Workspaces. Use Overrides when you want to experiment with changes to a webpage, and you need to keep the changes after you refresh the webpage, but you don't care about mapping your changes to the source code of the webpage.
A file that overrides a file that is returned by the server is indicated by a purple dot next to the file name, throughout DevTools.
See also:
- Override webpage resources with local copies (Overrides tab)
- Map the processed code to your original source code, for debugging
- Sources tool keyboard shortcuts in Keyboard shortcuts
Using the Content scripts tab for Microsoft Edge extensions
Use the Content scripts tab of the Navigator pane to view any content scripts that were loaded by a Microsoft Edge extension that you installed.

When the debugger steps into code that you don't recognize, you might want to add that code to the Ignore List, to avoid stepping into that code. See Add content scripts to the Ignore List.
See also:
Using the Snippets tab to run JavaScript code snippets on any webpage
Use the Snippets tab of the Navigator pane to create and save JavaScript code snippets, so that you can easily run these snippets on any webpage.
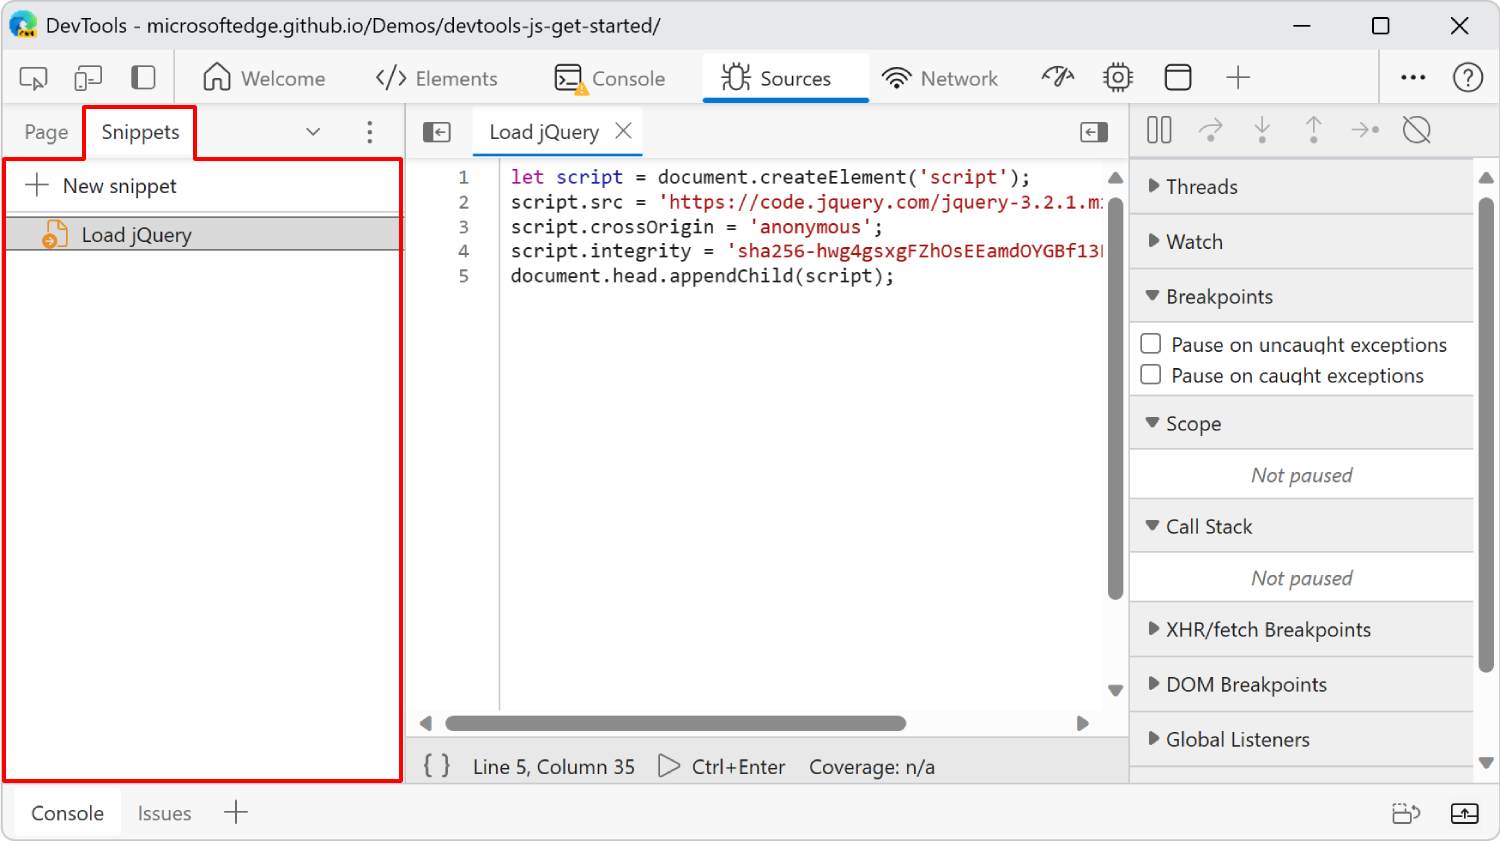
For example, suppose you frequently enter the following code in the Console, to insert the jQuery library into a page so that you can run jQuery commands from the Console:
let script = document.createElement('script');
script.src = 'https://code.jquery.com/jquery-3.2.1.min.js';
script.crossOrigin = 'anonymous';
script.integrity = 'sha256-hwg4gsxgFZhOsEEamdOYGBf13FyQuiTwlAQgxVSNgt4=';
document.head.appendChild(script);
Instead, you can save this code in a Snippet and then easily run it whenever you need to. When you press Ctrl+S (Windows, Linux) or Command+S (macOS), DevTools saves the Snippet to your file system.
There are multiple ways to run a Snippet:
- In the Navigator pane, select the Snippets tab, and then select the snippets file to open it. Then at the bottom of the Editor pane, select Run (
 ).
). - When DevTools has focus, press Ctrl+P (Windows, Linux) or Command+P (macOS) to open the Command Menu, and then type !.
Snippets are similar to bookmarklets.
See also:
Using the Command Menu to open files
To open a file, in addition to using the Navigator pane within the Sources tool, you can use the Command Menu from anywhere within DevTools.
- From anywhere in DevTools, press Ctrl+P on Windows/Linux or Command+P on macOS. The Command Menu appears, and lists all the resources that are in the tabs of the Navigator pane of the Sources tool.
- Or, next to the tabs of the Navigator pane in the Sources tool, select the ... (More options) button, and then select Open File.
To display and pick from a list of all .js files, type .js.
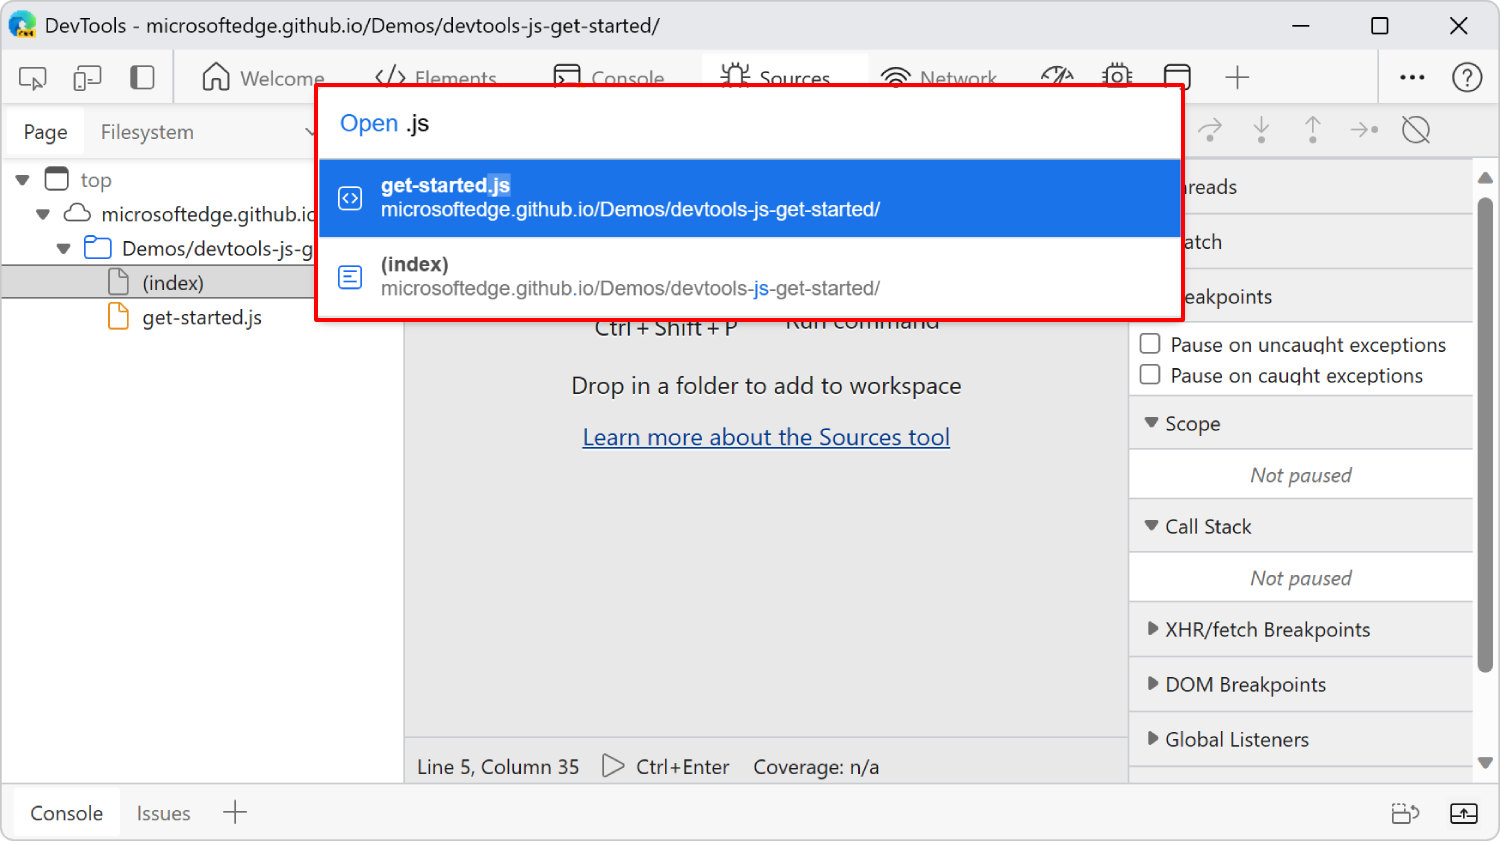
If you type ?, the Command Menu shows several commands, including ... Open file. If you press Backspace to clear the Command Menu, a list of files is shown.
For more information, see Run commands with the Microsoft Edge DevTools Command Menu.
Using the Editor pane to view or edit files
Use the Editor pane to view the front-end files that are returned from the server to compose the current webpage, including JavaScript, HTML, CSS, and image files. When you edit the front-end files in the Editor pane, DevTools updates the webpage to run the modified code.
The Editor pane has the following level of support for various file types:
| File Type | Supported Actions |
|---|---|
| JavaScript | View, edit, and debug. |
| CSS | View and edit. |
| HTML | View and edit. |
| Images | View. |
By default, edits are discarded when you refresh the webpage. For information about how to save the changes to your file system, see Using the Filesystem tab to define a local Workspace, above.
The following subsections cover the Editor pane:
- Editing a JavaScript file
- Reformatting a minified JavaScript file with pretty-print
- Mapping minified code to your source code to show readable code
- Transformations from source code to compiled front-end code
- Editing a CSS file
- Editing an HTML file
- Going to a line number or function
- Displaying source files when using a different tool
See also:
- Open a demo folder in the Sources tool and edit a file in Sample code for DevTools.
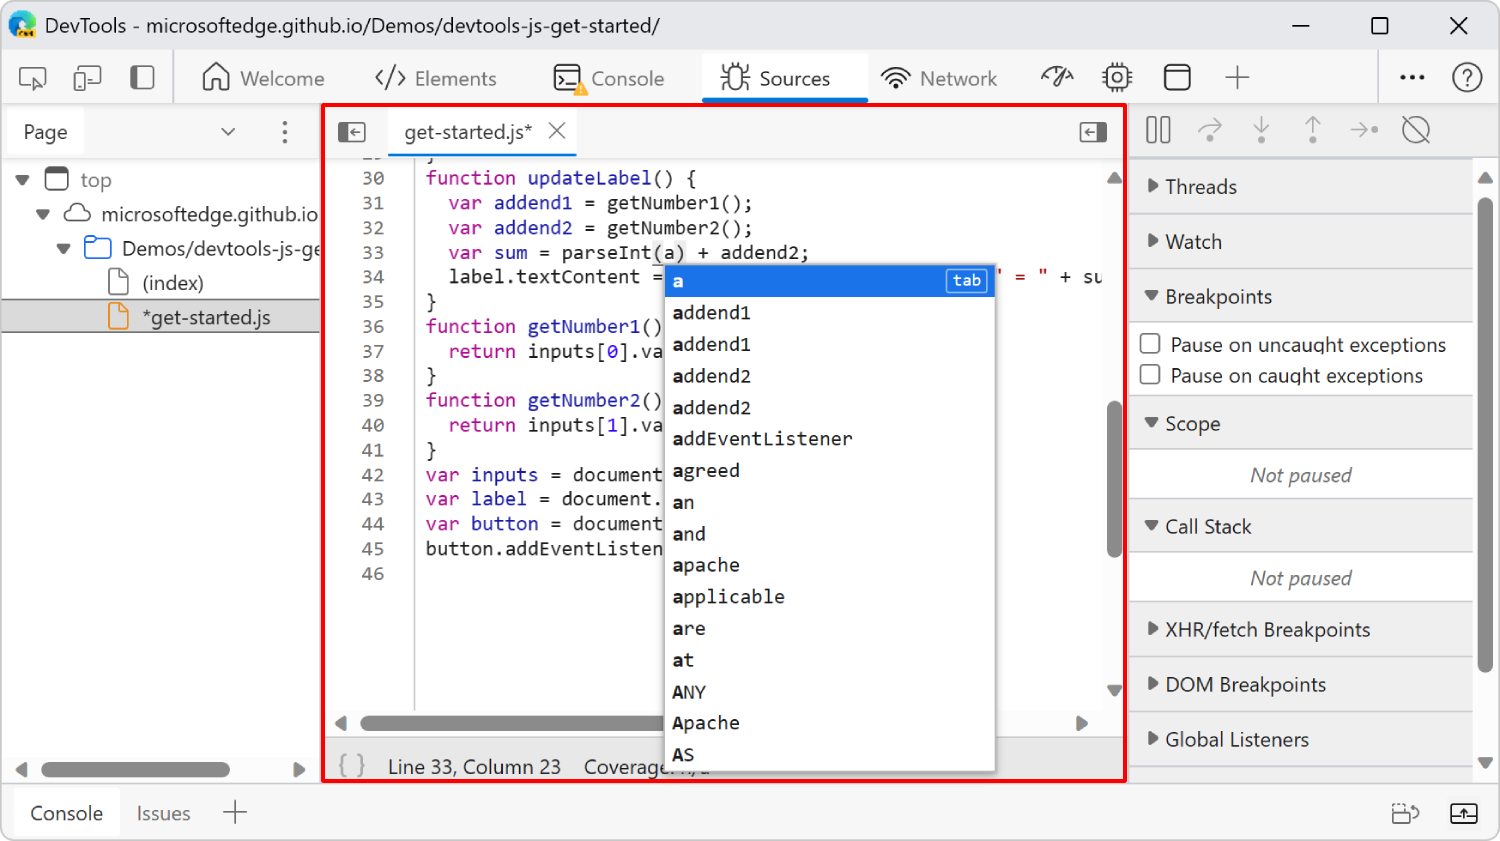
Editing a JavaScript file
To edit a JavaScript file in DevTools, use the Editor pane, within the Sources tool.
To load a file into the Editor pane, use the Page tab in the Navigator pane (on the left). Or use the Command Menu, as follows: in the upper right of DevTools, select Customize and control DevTools (...) and then select Open File.
See also:
- Open a demo folder in the Sources tool and edit a file in Sample code for DevTools.
Save and Undo
For JavaScript changes to take effect, press Ctrl+S (Windows, Linux) or Command+S (macOS).
If you change a file, an asterisk appears next to the file name.
- To save changes, press Ctrl+S on Windows/Linux or Command+S on macOS.
- To undo a change, press Ctrl+Z on Windows/Linux or Command+Z on macOS.
By default, your edits are discarded when you refresh the webpage. For more information about how to save the changes in your local file system, see Edit files with Workspaces (Filesystem tab).
Find and Replace
To find text in the current file, select the Editor pane to give it focus, and then press Ctrl+F on Windows/Linux, or Command+F on macOS.
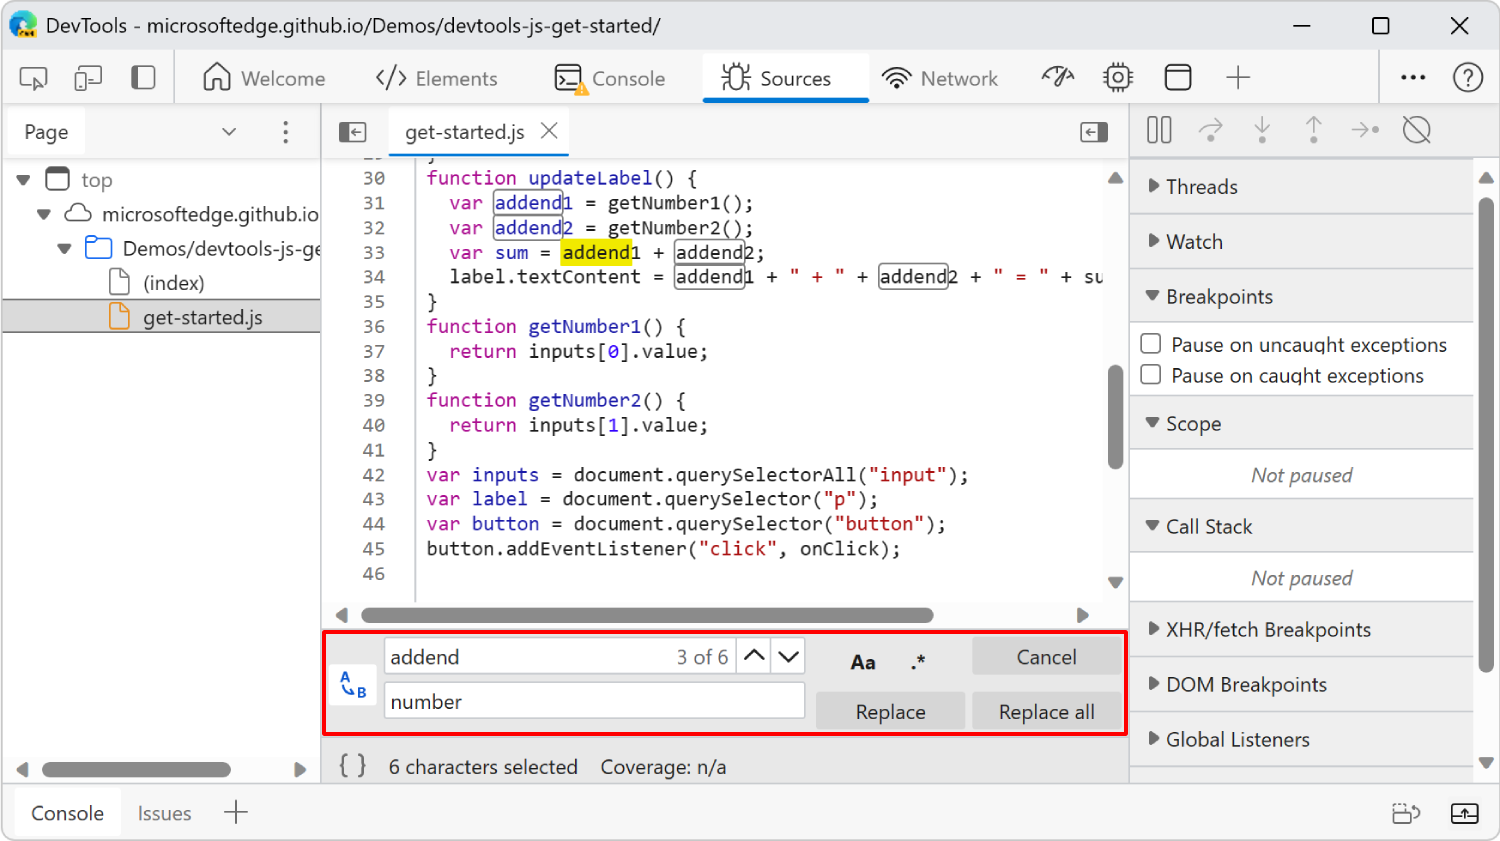
To find and replace text, select the Replace (A->B) button to the left of the Find text box. The Replace (A->B) button appears when viewing an editable file.
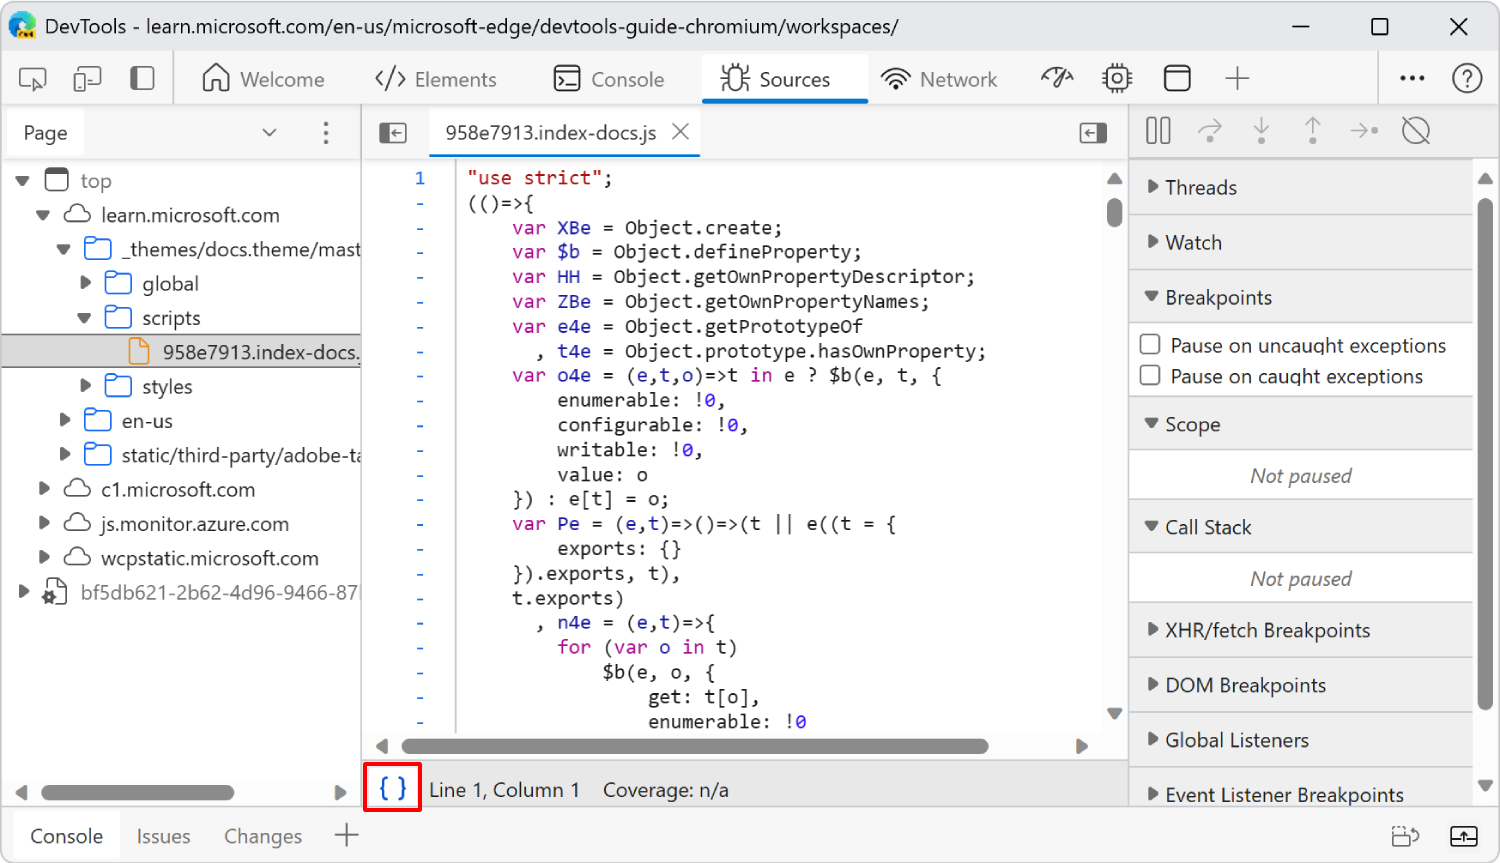
Reformatting a minified JavaScript file with pretty-print
Minified files are automatically reformatted when you open them in the Editor pane.
To revert the file to its original minified state, click the Pretty print button (![]() ), which is shown as braces, at the bottom of the Editor pane.
), which is shown as braces, at the bottom of the Editor pane.
For more information, see Reformat a minified JavaScript file with pretty-print.
Mapping minified code to your source code to show readable code
Source maps from pre-processors cause DevTools to load your original JavaScript source files in addition to your minified, transformed JavaScript files that are returned by the server. You then view your original source files while you set breakpoints and step through code. Meanwhile, Microsoft Edge is actually running your minified code.
In the Editor pane, if you right-click a JavaScript file and then select Add source map, a popup box appears, with a Source map URL text box and an Add button.
The source-mapping approach keeps your front-end code human-readable and debuggable even after you combine, minify, or compile it. For more information, see Map the processed code to your original source code, for debugging.
Transformations from source code to compiled front-end code
If you use a framework that transforms your JavaScript files, such as React, your local source JavaScript might be different than the front-end JavaScript that's returned by the server. Workspaces aren't supported in this scenario, but source code mapping is supported in this scenario.
In a development environment, your server might include your source maps and your original .ts or .jsx files for React. The Sources tool displays these files, but doesn't allow you to edit these files. When you set breakpoints and use the debugger, DevTools displays your original .ts or .jsx files, but actually steps-through the minified version of your JavaScript files.
In this scenario, the Sources tool is useful for inspecting and stepping-through the transformed, front-end JavaScript that's returned from the server. Use the debugger to define Watch expressions, and use the Console to enter JavaScript expressions to manipulate data that's in-scope.
Editing a CSS file
There are two ways to edit CSS in DevTools:
- In the Elements tool, you work with one CSS property at a time, through user interface controls. This approach is recommended in most cases. For more information, see Get started viewing and changing CSS.
- In the Sources tool, you use a text editor to edit CSS files.
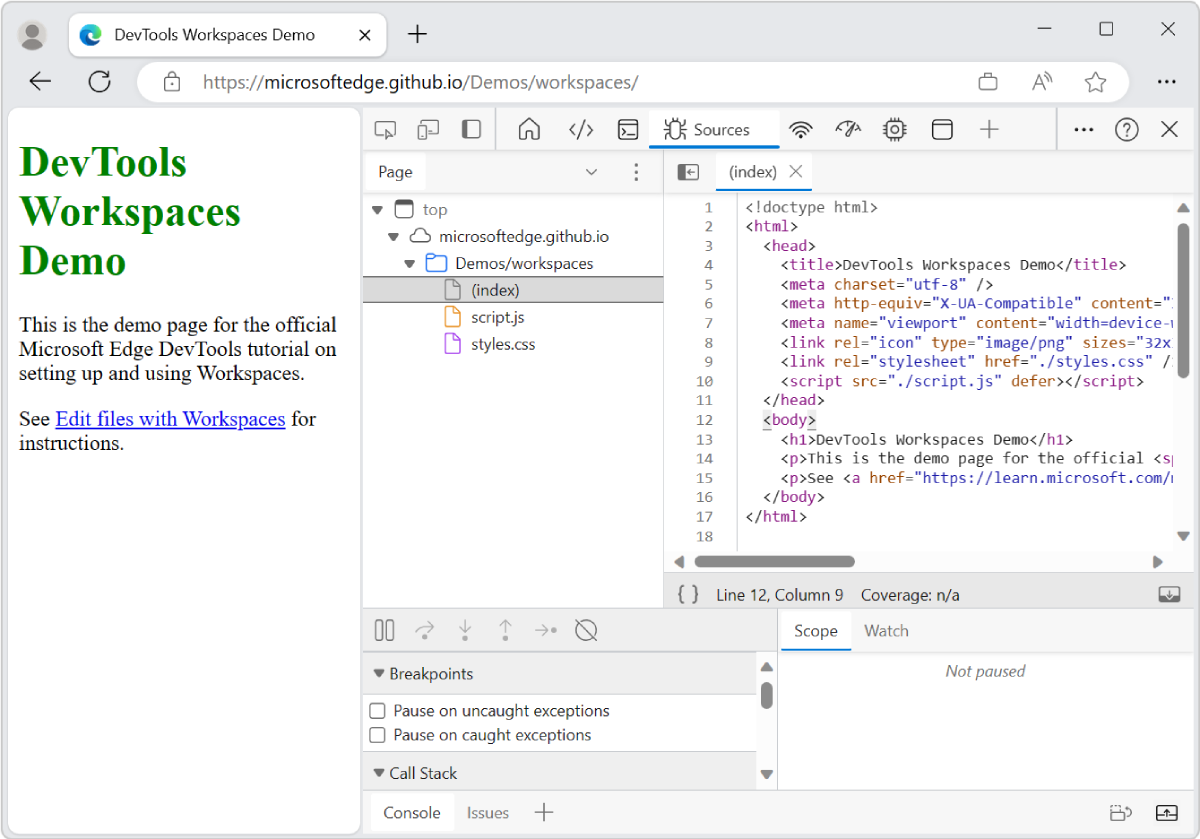
The Sources tool supports directly editing a CSS file. For example, if you edit the CSS file from the tutorial Edit files with Workspaces (Filesystem tab) to match the style rule below, the H1 element in the upper left of the rendered webpage changes to green:
h1 {
  color: green;
}

CSS changes take effect immediately; you don't need to manually save the changes.
See also:
- Edit CSS font styles and settings in the Styles pane
- Sources tool keyboard shortcuts in Keyboard shortcuts
- Open a demo folder in the Sources tool and edit a file in Sample code for DevTools.
Editing an HTML file
There are two ways to edit HTML in DevTools:
- In the Elements tool, you work with one HTML element at a time, through user interface controls.
- In the Sources tool, you use a text editor.
Unlike a JavaScript or CSS file, an HTML file that is returned by the web server cannot be directly edited in the Sources tool. To edit an HTML file using the Editor of the Sources tool, the HTML file must be in a Workspace or on the Overrides tab. See these subsections of the current article:
- Using the Filesystem tab to define a local Workspace
- Using the Overrides tab to override server files with local files
To save changes, press Ctrl+S on Windows/Linux or Command+S on macOS. An edited file is marked by an asterisk.
To find text, press Ctrl+F on Windows/Linux or Command+F on macOS.
To undo an edit, press Ctrl+Z on Windows/Linux or Command+Z on macOS.
To view other commands while editing an HTML file, in the Editor pane, right-click the HTML file.
See also:
- Open a demo folder in the Sources tool and edit a file in Sample code for DevTools.
Going to a line number or function
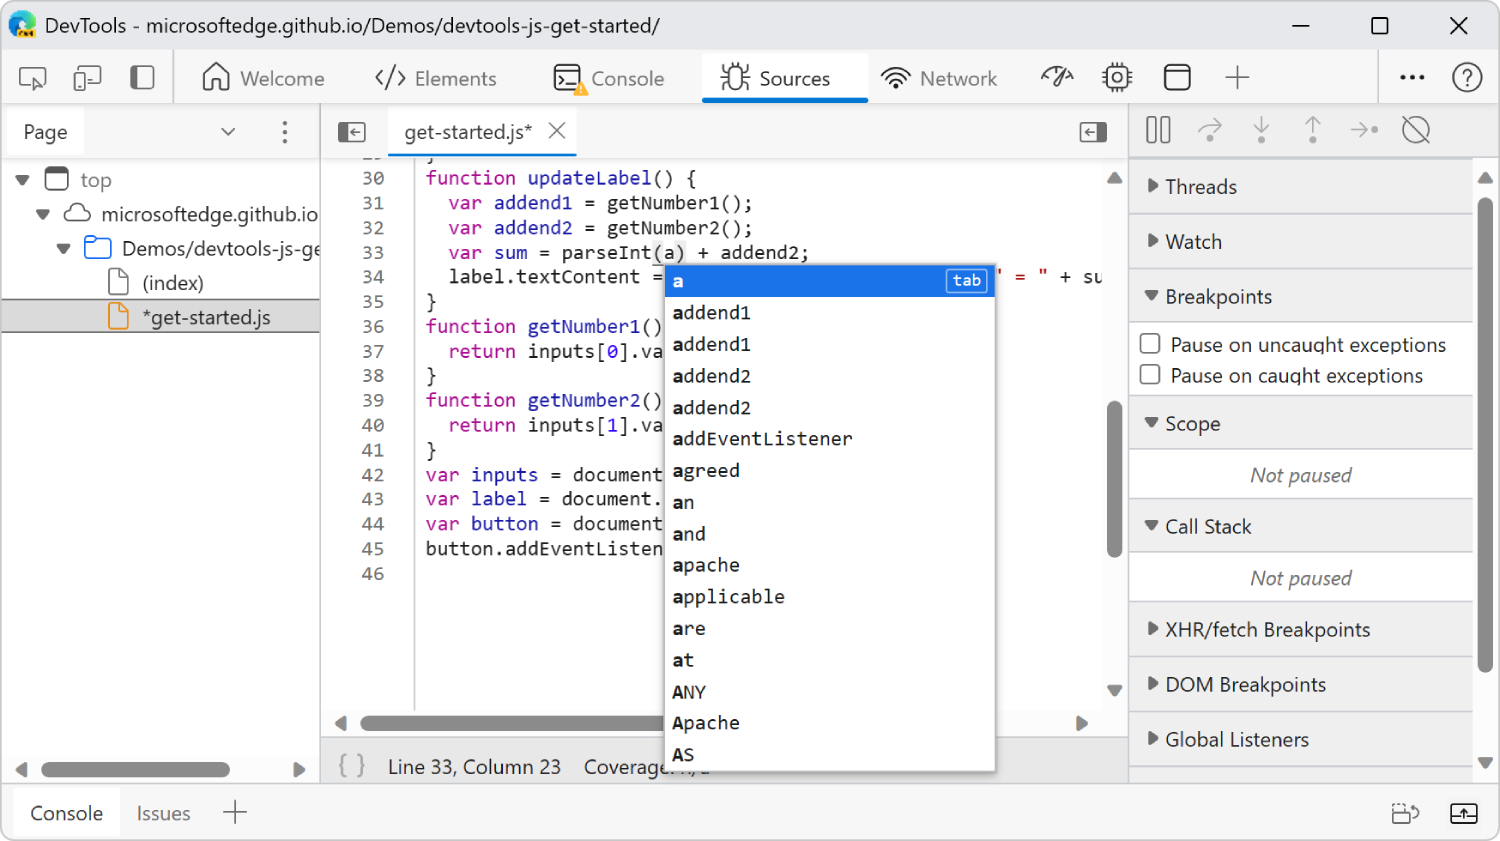
To go to a line number or symbol (such as a function name) in the file which is open in the Editor pane, you can use the Command Menu, rather than scrolling through the file.
- In the Navigator pane, select the ellipses (...) (More options), and then select Open File. The Command Menu appears.
- Type one of the following characters:
| Character | Command name | Purpose |
|---|---|---|
| : | Go to line | Go to a line number. |
| @ | Go to symbol | Go to a function. When you type @, the Command Menu lists the functions that are found in the JavaScript file which is open in the Editor pane. |
For more information, see Run commands with the Microsoft Edge DevTools Command Menu.
Displaying source files when using a different tool
The main place to view source files in the DevTools is within the Sources tool. But sometimes you need to access other tools, such as Elements or Console, while viewing or editing your source files. You use the Quick source tool in the Drawer, which appears at the bottom of DevTools.
To use the Quick source tool:
Select a tool other than the Sources tool, such as the Elements tool.
Press Ctrl+Shift+P (Windows, Linux) or Command+Shift+P (macOS). The Command Menu opens.
Type quick, and then select Show Quick source.
At the bottom of the DevTools window, the Drawer appears, with the Quick source tool selected. The Quick source tool contains the last file you edited in the Sources tool, within a compact version of the DevTools code editor.
Press Ctrl+P (Windows, Linux) or Command+P (macOS) to open the Open File dialog.
Using the Debugger pane to debug JavaScript code
Use the JavaScript debugger to step through the JavaScript code that's returned by the server. The debugger includes the Debugger pane, along with breakpoints that you set on lines of code in the Editor pane.
With the debugger, you step through the code, while watching any JavaScript expressions you specify. Watch and manually change variable values, and automatically show which variables are in-scope for the current statement.
The debugger supports standard debugging actions, such as:
- Setting breakpoints, to pause code.
- Stepping through code.
- Viewing and editing properties and variables.
- Watching the values of JavaScript expressions.
- Viewing the call stack (the sequence of function calls so far).
The debugger in DevTools is designed to look, feel, and work like the debugger in Visual Studio Code and the debugger in Visual Studio.
The following subsections cover debugging:
- The basic approach to using a debugger
- Advantages of the debugger's Watch and Scope over console.log
- Debug from Visual Studio Code directly
- Articles about debugging
The basic approach to using a debugger
To troubleshoot JavaScript code, you can insert console.log() statements in your code. Another, more powerful approach is to use the debugger of Microsoft Edge DevTools. Using a debugger can actually be simpler than console.log(), once you're familiar with the debugger approach.
To use a debugger on a webpage, you typically set a breakpoint and then send a form from the webpage, as follows:
Open the Demo: Get Started Debugging JavaScript with Microsoft Edge DevTools webpage in a new window or tab.
Right-click anywhere in the webpage, and then select Inspect. Or, press F12. The DevTools window opens, next to the demo webpage.
In DevTools, select the Sources tab.
In the Navigator pane (on the left), select the Page tab, and then select the JavaScript file, such as
get-started.js.In the Editor pane, select a line number near a suspect line of code, to set a breakpoint on that line. In the figure below, a breakpoint is set on the line
var sum = addend1 + addend2;.In the webpage, enter values and submit the form. For example, enter numbers, such as 5 and 1, then select the button Add Number 1 and Number 2.
The debugger runs the JavaScript code and then pauses at the breakpoint. The debugger is now in Paused mode, so you can inspect the values of the properties that are in-scope, and step through the code.
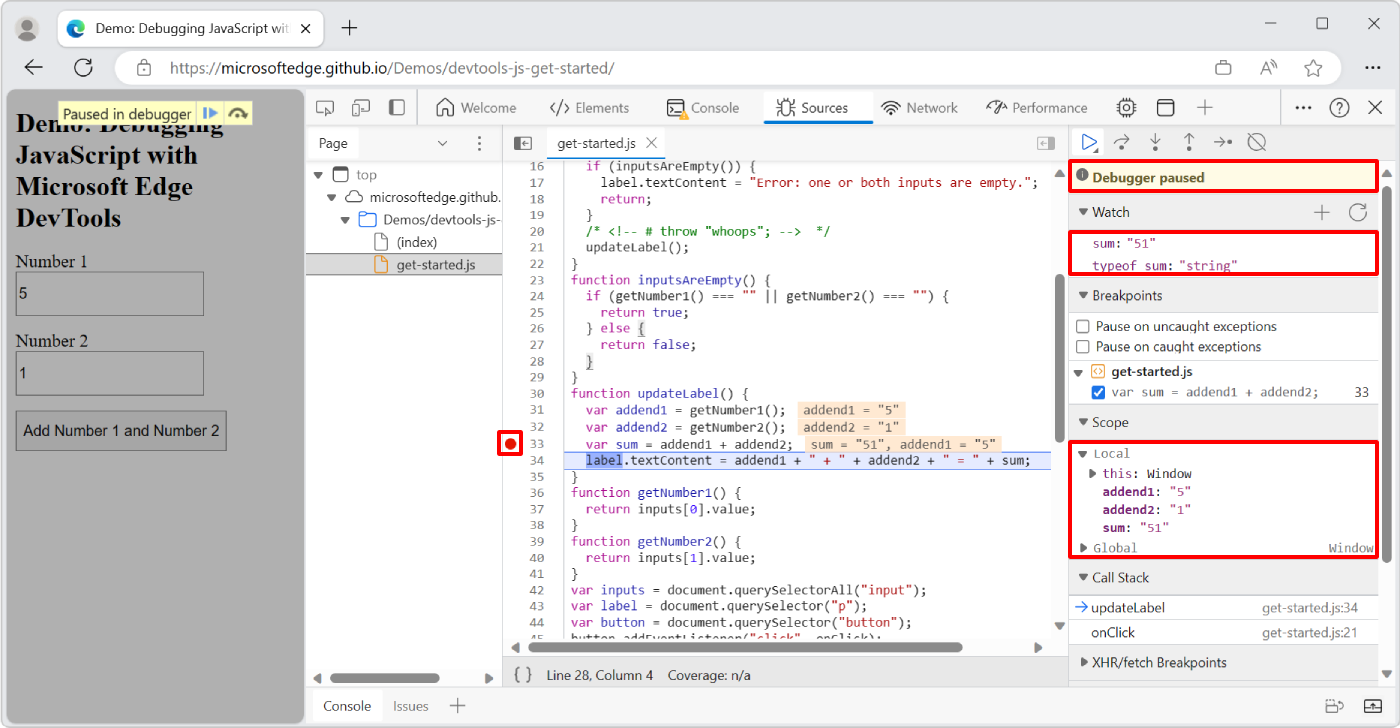
In the above figure, we added the Watch expressions
sumandtypeof sum, and stepped two lines past the breakpoint.Examine the values in the Scope pane, which shows all variables or properties that are in-scope for the current breakpoint, and their values.
At this point, you could add expressions in the Watch pane. These expressions are the same expressions that you would write within a
console.logstatement to debug your code.To run JavaScript commands to manipulate data in the current context, you use the Console. If you want to open the console in the Drawer at the bottom of DevTools, press Esc.
Step through the code by using the controls at the top of the Debugger pane, such as Step (F9).
The bug in this demo is that you need to first convert the input data from strings to numbers.
To fix the bug, refresh the page to reset the webpage form, and then change the line:
var sum = addend1 + addend2;to:
var sum = parseInt(addend1) + parseInt(addend2);Press Ctrl+S (Windows, Linux) or Command+S (macOS) to save the change in the local cached file.
Enter 5 and 1 into the webpage and then click the Add button. Now Scope > Local > sum: is the number 6, instead of the string "51".
See also:
- Sources tool keyboard shortcuts in Keyboard shortcuts
- Get started debugging JavaScript - a tutorial using an existing, simple webpage that contains a few form controls.
Advantages of the debugger's Watch and Scope over console.log
These three approaches are equivalent:
Temporarily adding the statements
console.log(sum)andconsole.log(typeof sum)in the code, wheresumis in-scope.Issuing the statements
sumandconsole.log(typeof sum)in the Console pane of the DevTools, when the debugger is paused wheresumis in-scope.Setting the Watch expressions
sumandtypeof sumin the Debugger pane.
When the variable sum is in-scope, sum and its value are automatically shown in the Scope section of the Debugger pane, and are also overlaid in the Editor pane where sum is calculated. So you probably wouldn't need to define a Watch expression for sum.
The debugger gives a richer, more flexible display and environment than a console.log statement. For example, in the debugger, as you step through the code, you can display and change the values of all currently defined properties and variables. You can also issue JavaScript statements in the Console, such as to change values in an array that's in-scope. (To show the Console, press Esc.)
Breakpoints and Watch expressions are preserved when you refresh the webpage.
Debug from Visual Studio Code directly
To use the more full-featured debugger of Visual Studio Code instead of the DevTools debugger, use the Microsoft Edge DevTools extension for Visual Studio Code.
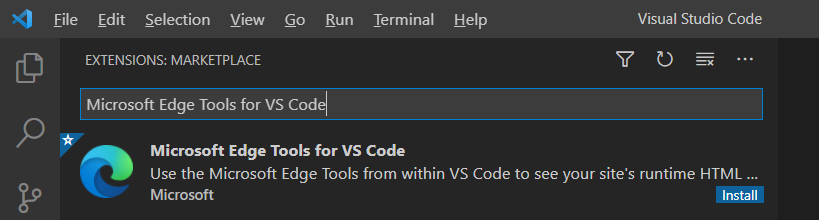
This extension provides access to the Elements and Network tools of Microsoft Edge DevTools, from within Microsoft Visual Studio Code.
For more information, see Visual Studio Code for web development and the GitHub Readme page, Microsoft Edge Developer Tools for Visual Studio Code.
Articles about debugging
The following articles cover the Debugger pane and breakpoints:
Get started debugging JavaScript - A tutorial (with screen captures), using an existing, simple project.
JavaScript debugging features - How to use the debugger to set breakpoints, step through code, view and modify variable values, watch JavaScript expressions, and view the call stack.
Pause your code with breakpoints - How to set basic and specialized breakpoints in the debugger.
See also
- Open a demo folder in the Sources tool and edit a file in Sample code for DevTools.
- Sources tool keyboard shortcuts in Keyboard shortcuts
Note
Portions of this page are modifications based on work created and shared by Google and used according to terms described in the Creative Commons Attribution 4.0 International License. The original page is found here and is authored by Kayce Basques (Technical Writer, Chrome DevTools & Lighthouse).
![]() This work is licensed under a Creative Commons Attribution 4.0 International License.
This work is licensed under a Creative Commons Attribution 4.0 International License.
Feedback
Coming soon: Throughout 2024 we will be phasing out GitHub Issues as the feedback mechanism for content and replacing it with a new feedback system. For more information see: https://aka.ms/ContentUserFeedback.
Submit and view feedback for