Troubleshoot database replication service issues in Configuration Manager
This guide helps administrators diagnose and resolve database replication service (DRS) problems in Configuration Manager.
Original product version: Microsoft Endpoint Configuration Manager (current branch), Microsoft System Center 2012 R2 Configuration Manager, Microsoft System Center 2012 Configuration Manager
Original KB number: 20033
When you experience a DRS problem in Configuration Manager, the beginning investigative phase is the most critical point. Any type of change or fix should be made only after careful study and understanding of the problem at hand.
Get started
Start by gathering information related to the history of the problem. Many times DRS problems can ultimately be traced back to a recent change made in the environment. Keep in mind that you should not focus solely on Configuration Manager, as changes to Windows or SQL Server can cause DRS problems as well. Having a clear understanding of any recent changes in the environment can provide important clues as to the source of the problem.
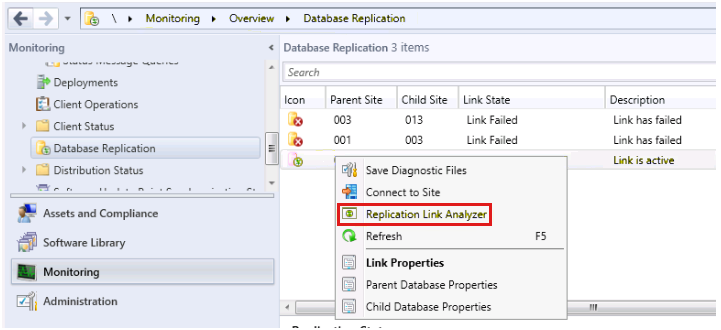
Once you've investigated environmental changes and made sure that your updates are in order, the next step is to run the Replication Link Analyzer (RLA). To launch RLA, open the Monitoring workspace and select the Database Replication node, then right-click the link that is having a problem and select Replication Link Analyzer, as shown in the following example:
Note
RLA runs within the context of whomever launches it from the console, so be sure that the account you use has administrative privileges on both SQL Server and site servers.
RLA will check the following on both sites:
- The SMS service is running.
- SMS Replication Configuration Monitor component is running.
- Ports required for SQL Server replication are enabled.
- SQL Server version is supported.
- Network is available between the two sites.
- There's enough space for the SQL Server database.
- SQL Server Broker service configuration exists.
- SQL Server Broker service certificate exists.
- Known errors in SQL Server log files.
- Whether the replication queues are disabled.
- Time is in sync.
- Is the transmission of data stuck?
- Does a key conflict exist?
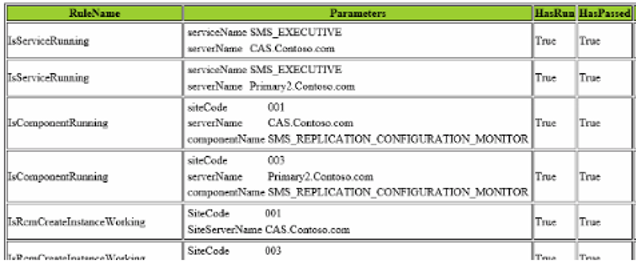
If RLS finds known problems, it will offer to fix them for you. The RLA output report is also straightforward. It tells you what it checked and what rules were run in addition to whether they passed or failed. Here is an example:
Get details with SPDiagDRS
If Replication Link Analyzer can't detect and resolve the problem, run SPDiagDRS and see if it can offer any clues to what may be failing.
To run SPDiagDRS, open SQL Server Management Studio and connect to the two servers on each side of the link having the problem. On each CM_xxx database, run the Exec SPDiagDRS command.
The following is a breakdown of the various SPDiagDRS sections and some common places to look for problems. A simple search for error messages and codes found here often guides you to the source of the problem.

Section 1
SiteStatus: This tells us whether the site is replicating or not. Anything other than ACTIVE is not good.
CertificateThumbprint: The thumbprint of the certificate used for authentication that contains the site's public key (local DB trusts remote DB).

Section 2
IncomingMessageInQueue: This tells us the incoming backlog that a site has. If the backlog is high due to the number of sites reporting to it, you may see the links going to a degraded or failed state because the heartbeat synchronizations are not processed in time.
OutgoingMessageInQueue: This tells us the backlog that has yet to clear as we wait for the sites to receive the messages. This generally fluctuates, however if it continues to grow then this can represent a problem. Further troubleshooting should be performed to determine which site is not getting the messages.

Section 3
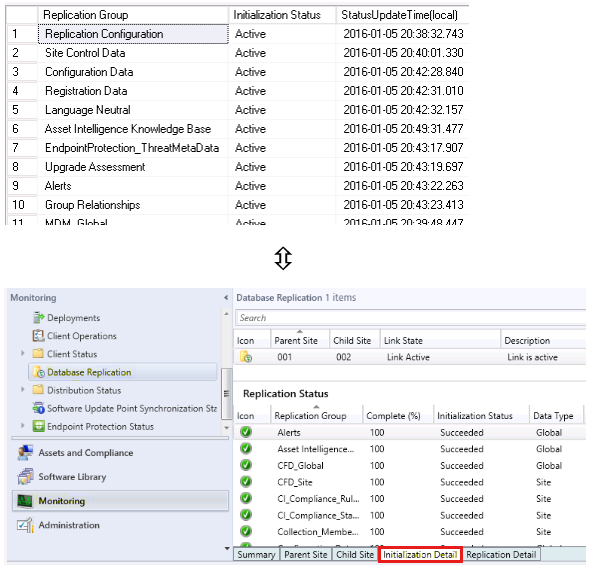
This is simply the detailed view of the Initialization Detail in the console.
Section 4
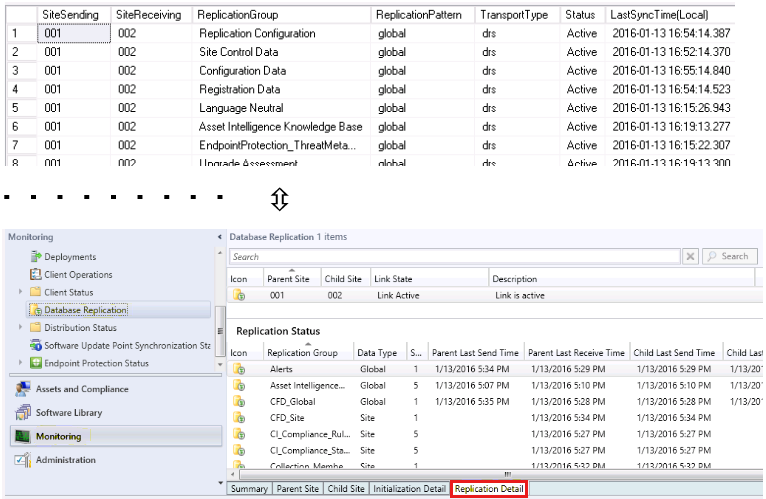
This is the detailed view of Replication Detail in the console. It provides more information about the flow between each replication group.
Section 5
This section has some important and useful information about the sites we are connecting to. In this example we are on primary site server 002, and 001 is the central administration site. If we had a secondary site under 002, it would be shown here. On a central administration site, all primary sites would be reflected but not the secondary sites.
Primary site 002 example:

Central administration site 001 example:

Section 6
This provides the general information of the sites in the hierarchy, the SiteServerName and DBServer names, as well as the status and version. You can see here that a different primary site (003) is showing as being in Maintenance Mode. On working systems, Section 6 should be identical between the central administration site and all primary sites in the hierarchy.

Section 7
The bottom two sections contain detailed information on the heartbeat or LastSentStatus for each group as well as conversationIDs and so on, and the built-in replication options configured for each group.
Check RCMCtrl.log for errors
Next you will want to check RCMCtrl.log on each site for errors, as this will often provide valuable clues regarding the source of the problem. For example, you may find that replication is in a Failed state for a site and that replication hasn't occurred for some time. In this scenario, you may find that RCMCtrl.log contains entries similar to the following:
7/4/2016 1:25:36 PM: ReplicationLinkAnalysis Information: 1 : Completed replication link analysis thread.
7/4/2016 1:25:37 PM: ReplicationLinkAnalysis Error: 1 : Unable to find SiteCode or SiteNumber
7/4/2016 1:25:37 PM: ReplicationLinkAnalysis Error: 1 : Microsoft.ConfigurationManager.ManagedBase.LocalServerDataNotFoundException: Unable to find SiteCode or SiteNumber
at Microsoft.ConfigurationManager.ManagedBase.SiteData.Refresh()
at Microsoft.ConfigurationManager.ReplicationLinkAnalyzer.ReplicationLinkAnalysisEngine.Initialize()
at Microsoft.ConfigurationManager.ReplicationLinkAnalyzer.ReplicationLinkAnalysisEngine.RunRulesInBackground(Object sender, DoWorkEventArgs e)
at System.ComponentModel.BackgroundWorker.WorkerThreadStart(Object argument)
If you see entries similar to these, make sure that the SMS Executive and the Site Component Manager services are running on the site in question. If not, this may be why replication is in a Failed state. If not running, start the SMS Executive and/or Site Component Manager services manually and troubleshoot the services if they fail to start.
Another example of an error you might find in RCMCtrl.log is the following:
07/04/2016 12:33:34 PM 6352 (0x18D0)CSqlBCP::ReadRowCount: Can't open file [F:\Program Files\Microsoft Configuration Manager\inboxes\rcm.box\GUID\INSTALLED_EXECUTABLE_DATA.bcp.rowcount]. SMS_REPLICATION_CONFIGURATION_MONITOR
07/04/2016 12:33:34 PM 6352 (0x18D0) CSqlBCP::DRS_Init_BCPIN: ReadRowCount failed. SMS_REPLICATION_CONFIGURATION_MONITOR
07/04/2016 12:33:34 PM 6352 (0x18D0)*** DRS_Init_BCPIN() failed SMS_REPLICATION_CONFIGURATION_MONITOR
07/04/2016 12:33:34 PM 6352 (0x18D0) CBulkInsert::DRS_Init_BCPIN : Failed to BCP in SMS_REPLICATION_CONFIGURATION_MONITOR
07/04/2016 12:33:34 PM 6352 (0x18D0) BCP in result is 2147500037. SMS_REPLICATION_CONFIGURATION_MONITOR
07/04/2016 12:33:34 PM 6352 (0x18D0) ERROR: Failed to BCP in for table INSTALLED_EXECUTABLE_DATA with error code 2147500037. SMS_REPLICATION_CONFIGURATION_MONITOR
07/04/2016 12:33:34 PM 6352 (0x18D0) ERROR: Failed to apply BCP for all articles in publication Hardware_Inventory_7. SMS_REPLICATION_CONFIGURATION_MONITOR
07/04/2016 12:33:34 PM 6352 (0x18D0) Will try to apply BCP files again on next run.
What's happening here is that while the .CAB file sent from the parent was unpacked by the despooler, the space on the drive was exhausted, so it was only able to uncompress some of the files. If you view despool.log, it will have a 2147024784 failure that refers to insufficient disk space. To resolve this type of issue, free up disk space on the drive.
Check for BCP problems
If you still haven't found the source of the problem, it could be that the replication process was interrupted because the bulk copy program (BCP) was going too slow.
Is sender throttled to this site and perhaps this is slowing down the BCP transfer?
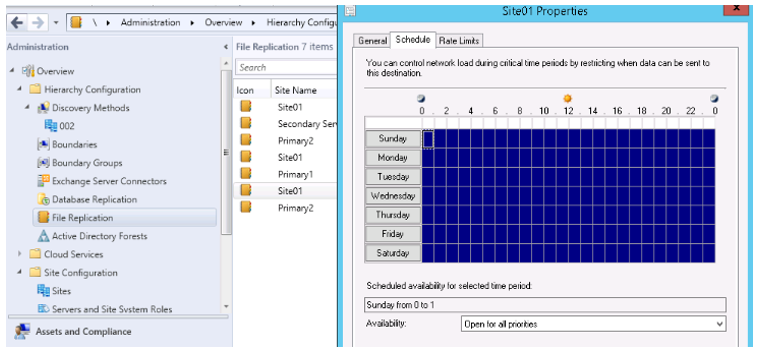
To verify, open the console and go to Administration > Overview > Hierarchy Configuration > File Replication, then right-click the site that would be sending the data. Verify that the schedule availability is set to Open for all Priorities, and that Rate Limits is set to Unlimited to this Site.
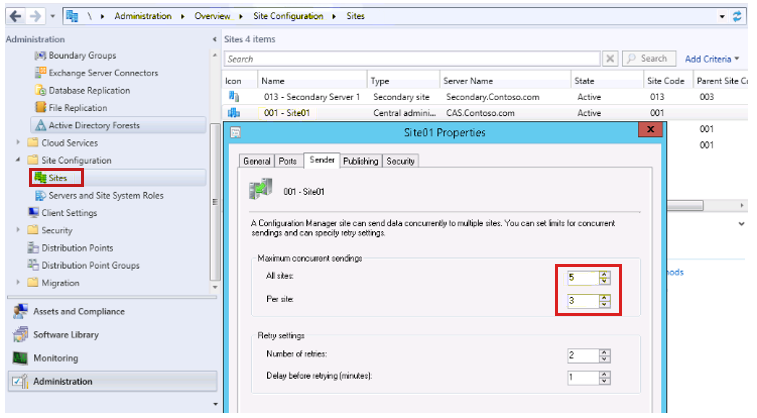
If things are working but the data set from the BCP process is large and taking a long time to send, you can increase the number of sender threads to speed things up. The defaults are listed below. If your sender log is consistently advising no more threads available or Using 5 or 5 or Using 3 of 3, this is a good indication that you may want to increase the sender threads.
Note
If increased, the setting takes effect in real time with no restart of anything required.
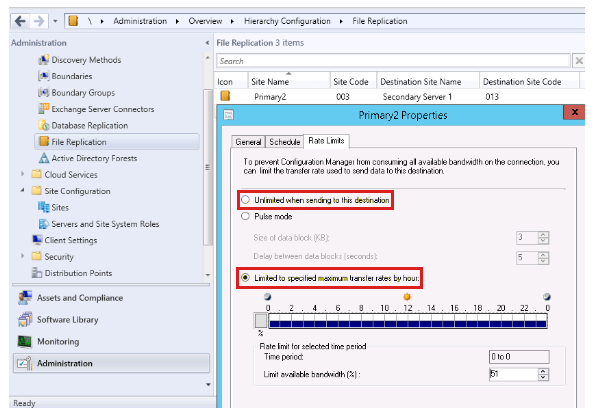
Also if you have a rate limit set to Limited to specified maximum transfer rates by hour (as shown below), Configuration Manager will only use one sender thread at a time when transferring to that site regardless of what the number of sender threads are set to. The default setting of Unlimited When Sending to this destination will use all the configured sender threads.
More information
For more information about DRS, see the following articles:
- DRS Initialization In Configuration Manager 2012
- Planning for Communications in Configuration Manage
- Database replication
You can also post a question in our Configuration Manager support forum.
Feedback
Coming soon: Throughout 2024 we will be phasing out GitHub Issues as the feedback mechanism for content and replacing it with a new feedback system. For more information see: https://aka.ms/ContentUserFeedback.
Submit and view feedback for