Create a custom analytics rule from scratch
You’ve set up connectors and other means of collecting activity data across your digital estate. Now you need to dig through all that data to detect patterns of activity and discover activities that don’t fit those patterns and that could represent a security threat.
Microsoft Sentinel and its many solutions provided in the Content hub offer templates for the most commonly used types of analytics rules, and you’re strongly encouraged to make use of those templates, customizing them to fit your specific scenarios. But it’s possible you might need something completely different, so in that case you can create a rule from scratch, using the analytics rule wizard.
This article walks you through the Analytics rule wizard and explains all the available options. It's accompanied by screenshots and directions to access the wizard in both the Azure portal, for Microsoft Sentinel users who aren't also Microsoft Defender subscribers, and the Defender portal, for users of the Microsoft Defender unified security operations platform.
Important
Microsoft Sentinel is available as part of the public preview for the unified security operations platform in the Microsoft Defender portal. For more information, see Microsoft Sentinel in the Microsoft Defender portal.
Prerequisites
- You must have the Microsoft Sentinel Contributor role, or any other role or set of permissions that includes write permissions on your Log Analytics workspace and its resource group.
Design and build your query
Before you do anything else, you should design and build a query in Kusto Query Language (KQL) that your rule will use to query one or more tables in your Log Analytics workspace.
Determine a data source that you want to search to detect unusual or suspicious activity. Find the name of the Log Analytics table into which data from that source is ingested. You can find the table name on the page of the data connector for that source. Use this table name (or a function based on it) as the basis for your query.
Decide what kind of analysis you want this query to perform on the table. This decision will determine which commands and functions you should use in the query.
Decide which data elements (fields, columns) you want from the query results. This decision will determine how you structure the output of the query.
Best practices for analytics rule queries
It's recommended to use an Advanced Security Information Model (ASIM) parser as your query source, instead of using a native table. This will ensure that the query supports any current or future relevant data source or family of data sources, rather than relying on a single data source.
The query length should be between 1 and 10,000 characters and cannot contain "
search *" or "union *". You can use user-defined functions to overcome the query length limitation.Using ADX functions to create Azure Data Explorer queries inside the Log Analytics query window is not supported.
When using the
bag_unpackfunction in a query, if you project the columns as fields using "project field1" and the column doesn't exist, the query will fail. To guard against this happening, you must project the column as follows:project field1 = column_ifexists("field1","")
For more help building Kusto queries, see Kusto Query Language in Microsoft Sentinel and Best practices for Kusto Query Language queries.
Build and test your queries in the Logs screen. When you’re satisfied, save the query for use in your rule.
Create your analytics rule
This section describes how to create a rule using the Azure or Defender portals.
Start the Analytics rule wizard
From the Configuration section of the Microsoft Sentinel navigation menu, select Analytics.
In the action bar at the top, select +Create and select Scheduled query rule. This opens the Analytics rule wizard.


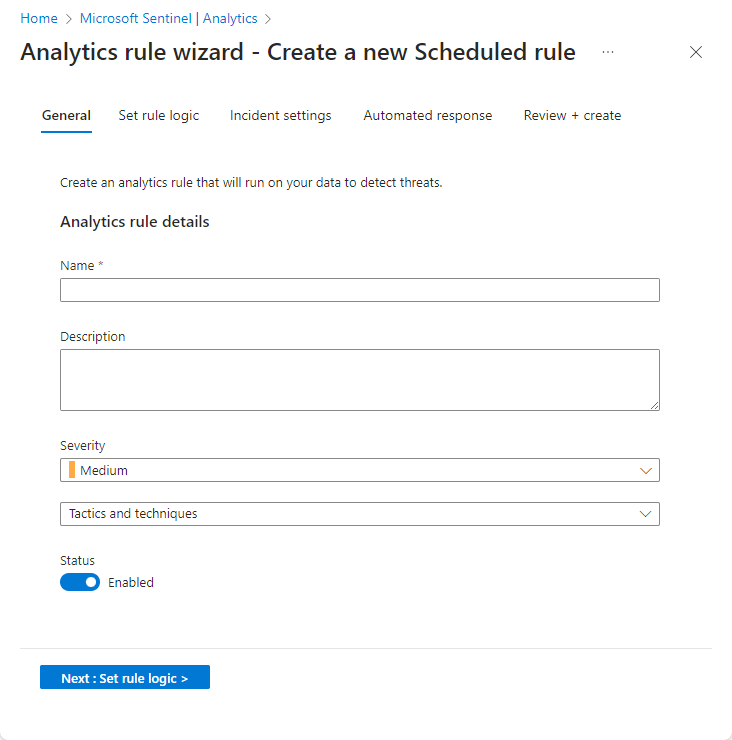
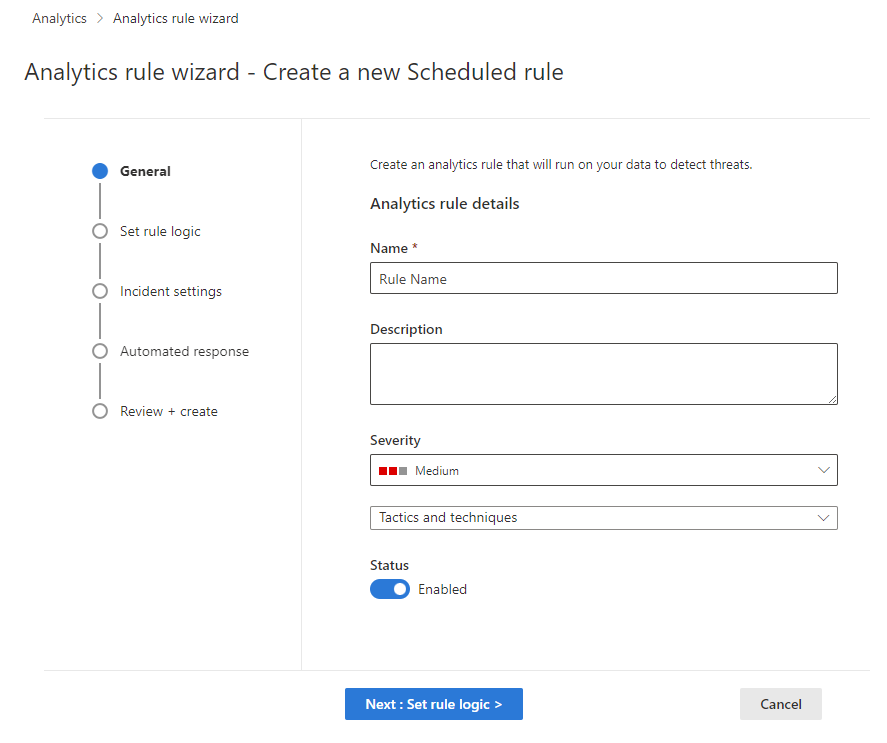
Name the rule and define general information
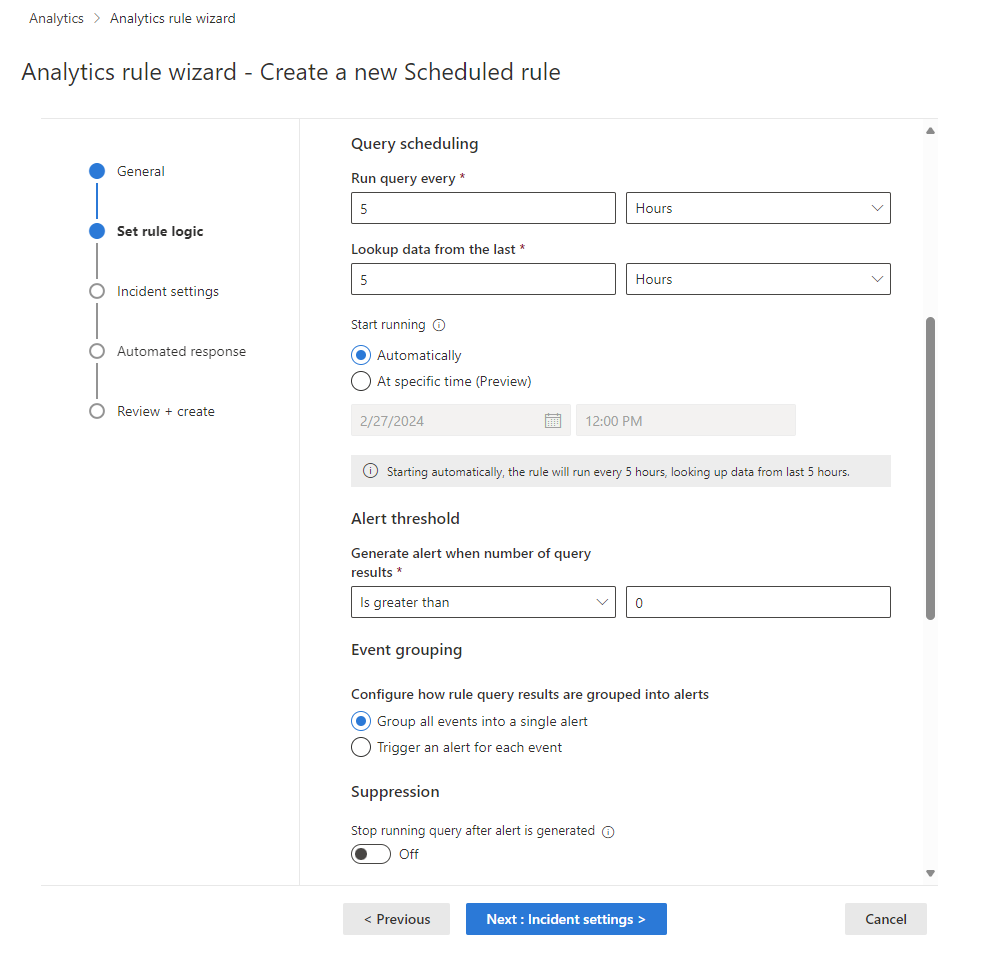
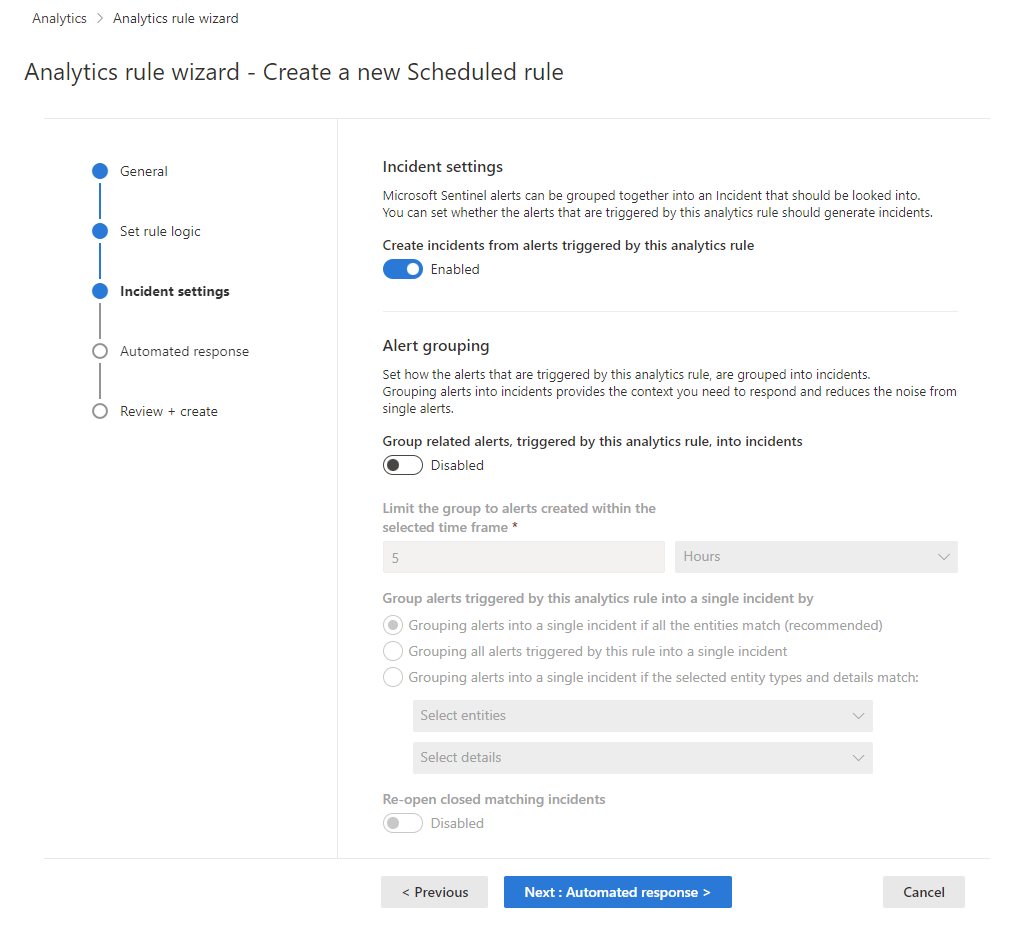
In the Azure portal, stages are represented visually as tabs. In the Defender portal, they're represented visually as milestones on a timeline. See the screenshots below for examples.
Provide a unique Name and a Description.
Set the alert Severity as appropriate, matching the impact the activity triggering the rule might have on the target environment, should the rule be a true positive.
Severity Description Informational No impact on your system, but the information might be indicative of future steps planned by a threat actor. Low The immediate impact would be minimal. A threat actor would likely need to conduct multiple steps before achieving an impact on an environment. Medium The threat actor could have some impact on the environment with this activity, but it would be limited in scope or require additional activity. High The activity identified provides the threat actor with wide ranging access to conduct actions on the environment or is triggered by impact on the environment. Severity level defaults are not a guarantee of current or environmental impact level. Customize alert details to customize the severity, tactics, and other properties of a given instance of an alert with the values of any relevant fields from a query output.
Severity definitions for Microsoft Sentinel analytics rule templates are relevant only for alerts created by analytics rules. For alerts ingested from other services, the severity is defined by the source security service.
In the Tactics and techniques field, you can choose from among categories of threat activities by which to classify the rule. These are based on the tactics and techniques of the MITRE ATT&CK framework.
Incidents created from alerts that are detected by rules mapped to MITRE ATT&CK tactics and techniques automatically inherit the rule's mapping.
For more information on maximizing your coverage of the MITRE ATT&CK threat landscape, see Understand security coverage by the MITRE ATT&CK® framework
When you create the rule, its Status is Enabled by default, which means it will run immediately after you finish creating it. If you don’t want it to run immediately, select Disabled, and the rule will be added to your Active rules tab and you can enable it from there when you need it.
Note
There's another way, currently in preview, to create a rule without it running immediately. You can schedule the rule to first run at a specific date and time. See Schedule and scope the query below.
Select Next: Set rule logic.
Define the rule logic
Enter a query for your rule.
Paste the query you designed, built, and tested into the Rule query window. Every change you make in this window is instantly validated, so if there are any mistakes, you’ll see an indication right below the window.
Map entities.
Entities are essential for detecting and investigating threats. Map the entity types recognized by Microsoft Sentinel onto fields in your query results. This mapping integrates the discovered entities into the Entities field in your alert schema.
For complete instructions on mapping entities, see Map data fields to entities in Microsoft Sentinel.
Surface custom details in your alerts.
By default, only the alert entities and metadata are visible in incidents without drilling down into the raw events in the query results. This step takes other fields in your query results and integrates them into the ExtendedProperties field in your alerts, causing them to be displayed up front in your alerts, and in any incidents created from those alerts.
For complete instructions on surfacing custom details, see Surface custom event details in alerts in Microsoft Sentinel.
Customize alert details.
This setting allows you to customize otherwise-standard alert properties according to the content of various fields in each individual alert. These customizations are integrated into the ExtendedProperties field in your alerts. For example, you can customize the alert name or description to include a username or IP address featured in the alert.
For complete instructions on customizing alert details, see Customize alert details in Microsoft Sentinel.
-
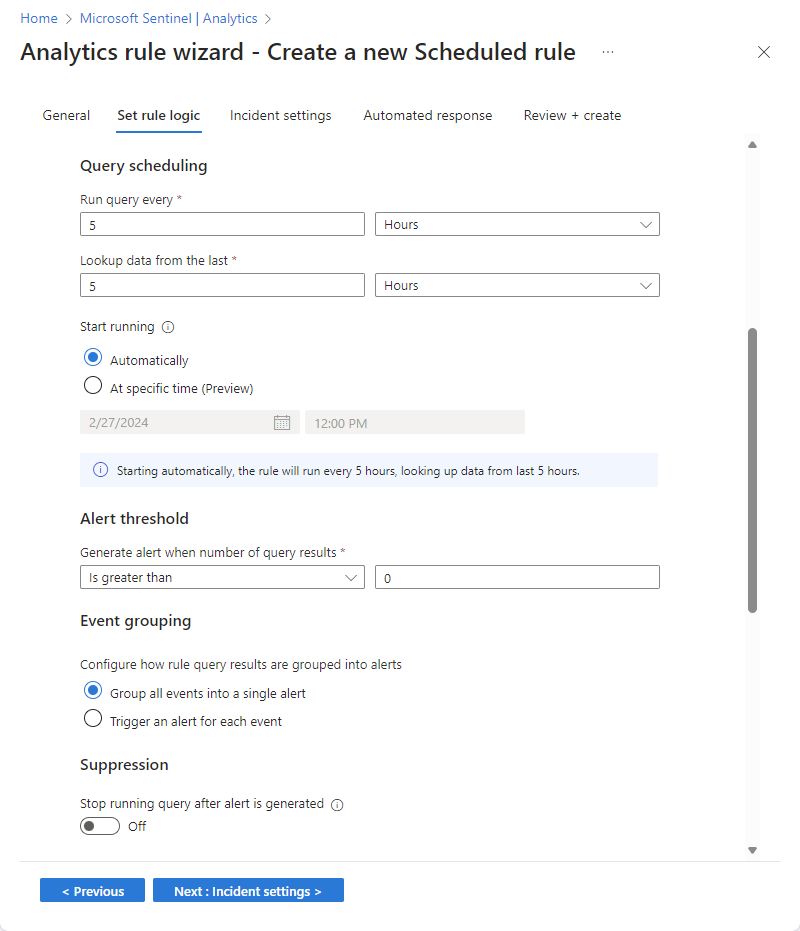
Set the following parameters in the Query scheduling section:
Setting Behavior Run query every Controls the query interval: how often the query is run. Lookup data from the last Determines the lookback period: the time period covered by the query. The allowed range for both of these parameters is from 5 minutes to 14 days.
The query interval must be shorter than or equal to the lookback period. If it's shorter, the query periods will overlap and this may cause some duplication of results. The rule validation will not allow you to set an interval longer than the lookback period, though, as that would result in gaps in your coverage.
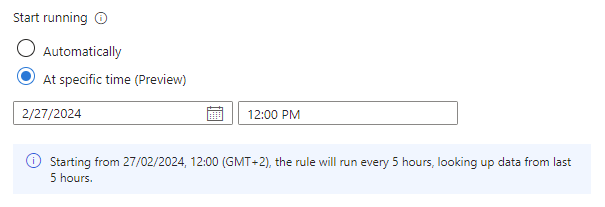
Set Start running:
Setting Behavior Automatically The rule will run for the first time immediately upon being created, and after that at the interval set in the Run query every setting. At specific time (Preview) Set a date and time for the rule to first run, after which it will run at the interval set in the Run query every setting. The start running time must be between 10 minutes and 30 days after the rule creation (or enablement) time.
The line of text under the Start running setting (with the information icon at its left) summarizes the current query scheduling and lookback settings.
Note
Ingestion delay
To account for latency that may occur between an event's generation at the source and its ingestion into Microsoft Sentinel, and to ensure complete coverage without data duplication, Microsoft Sentinel runs scheduled analytics rules on a five-minute delay from their scheduled time.
For more information, see Handle ingestion delay in scheduled analytics rules.
Set the threshold for creating alerts.
Use the Alert threshold section to define the sensitivity level of the rule.
- Set Generate alert when number of query results to Is greater than, and enter the minimum number of events that need to be found over the time period of the query for the rule to generate an alert.
- This is a required field, so if you don’t want to set a threshold—that is, if you want to trigger the alert for even a single event in a given time period—enter
0in the number field.
Set event grouping settings.
Under Event grouping, choose one of two ways to handle the grouping of events into alerts:
Setting Behavior Group all events into a single alert
(default)The rule generates a single alert every time it runs, as long as the query returns more results than the specified alert threshold above. This single alert summarizes all the events returned in the query results. Trigger an alert for each event The rule generates a unique alert for each event returned by the query. This is useful if you want events to be displayed individually, or if you want to group them by certain parameters—by user, hostname, or something else. You can define these parameters in the query. Analytics rules can generate up to 150 alerts. If Event grouping is set to Trigger an alert for each event, and the rule's query returns more than 150 events, the first 149 events will each generate a unique alert (for 149 alerts), and the 150th alert will summarize the entire set of returned events. In other words, the 150th alert is what would have been generated if Event grouping had been set to Group all events into a single alert.
Temporarily suppress rule after an alert is generated.
In the Suppression section, you can turn the Stop running query after alert is generated setting On if, once you get an alert, you want to suspend the operation of this rule for a period of time exceeding the query interval. If you turn this on, you must set Stop running query for to the amount of time the query should stop running, up to 24 hours.
Simulate the results of the query and logic settings.
In the Results simulation area, select Test with current data and Microsoft Sentinel will show you a graph of the results (log events) the query would have generated over the last 50 times it would have run, according to the currently defined schedule. If you modify the query, select Test with current data again to update the graph. The graph shows the number of results over the defined time period, which is determined by the settings in the Query scheduling section.
Here's what the results simulation might look like for the query in the screenshot above. The left side is the default view, and the right side is what you see when you hover over a point in time on the graph.
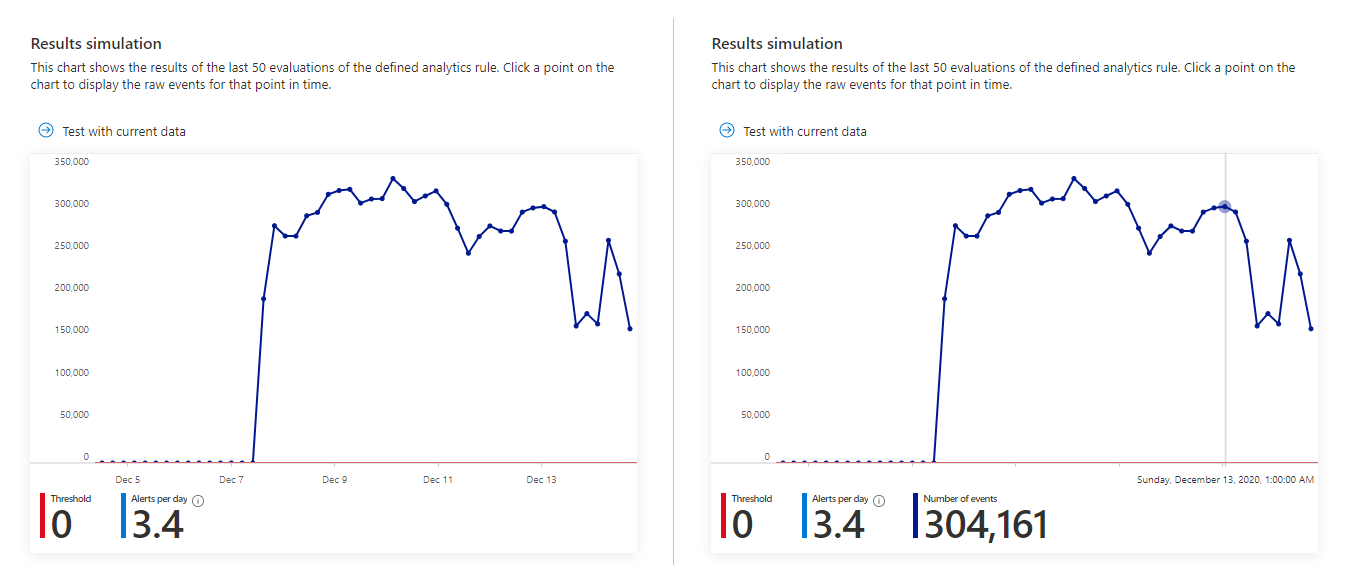
If you see that your query would trigger too many or too frequent alerts, you can experiment with the settings in the Query scheduling and Alert threshold sections and select Test with current data again.
Select Next: Incident settings.
Configure the incident creation settings
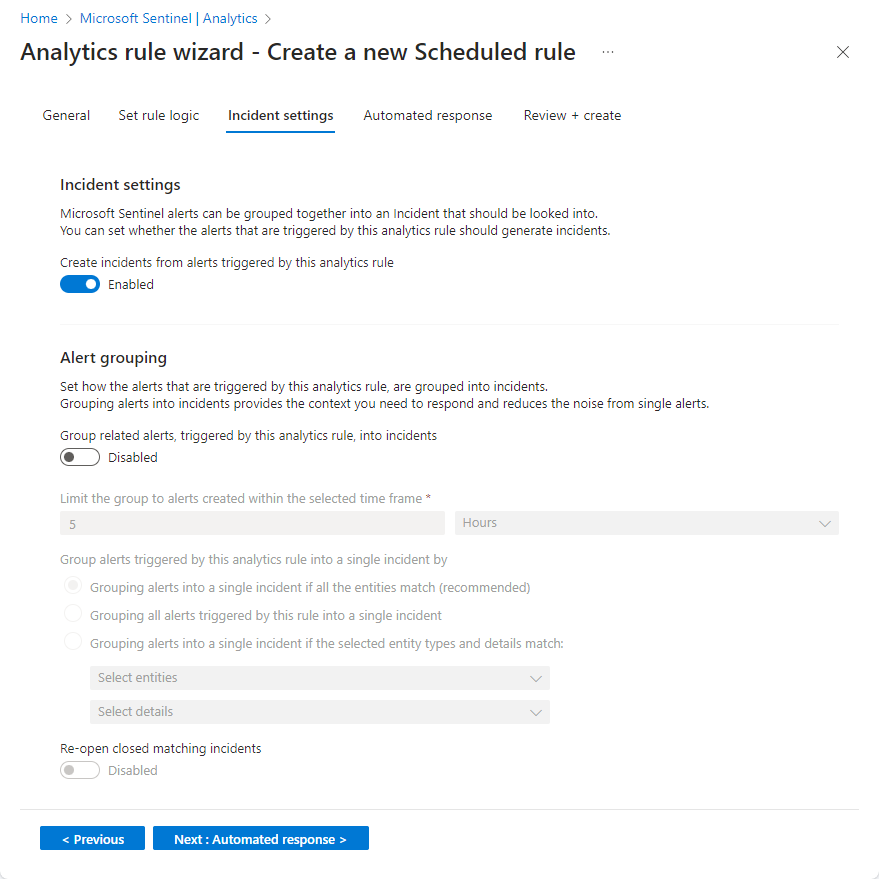
In the Incident settings tab, choose whether Microsoft Sentinel turns alerts into actionable incidents, and whether and how alerts are grouped together in incidents.
Enable incident creation.
In the Incident settings section, Create incidents from alerts triggered by this analytics rule is set by default to Enabled, meaning that Microsoft Sentinel will create a single, separate incident from each and every alert triggered by the rule.
If you don’t want this rule to result in the creation of any incidents (for example, if this rule is just to collect information for subsequent analysis), set this to Disabled.
Important
If you onboarded Microsoft Sentinel to the unified security operations platform in the Microsoft Defender portal, and this rule is querying and creating alerts from Microsoft 365 or Microsoft Defender sources, you must set this setting to Disabled.
If you want a single incident to be created from a group of alerts, instead of one for every single alert, see the next section.
-
In the Alert grouping section, if you want a single incident to be generated from a group of up to 150 similar or recurring alerts (see note), set Group related alerts, triggered by this analytics rule, into incidents to Enabled, and set the following parameters.
Limit the group to alerts created within the selected time frame: Determine the time frame within which the similar or recurring alerts will be grouped together. All of the corresponding alerts within this time frame will collectively generate an incident or a set of incidents (depending on the grouping settings below). Alerts outside this time frame will generate a separate incident or set of incidents.
Group alerts triggered by this analytics rule into a single incident by: Choose the basis on which alerts will be grouped together:
Option Description Group alerts into a single incident if all the entities match Alerts are grouped together if they share identical values for each of the mapped entities (defined in the Set rule logic tab above). This is the recommended setting. Group all alerts triggered by this rule into a single incident All the alerts generated by this rule are grouped together even if they share no identical values. Group alerts into a single incident if the selected entities and details match Alerts are grouped together if they share identical values for all of the mapped entities, alert details, and custom details selected from the respective drop-down lists.
You might want to use this setting if, for example, you want to create separate incidents based on the source or target IP addresses, or if you want to group alerts that match a specific entity and severity.
Note: When you select this option, you must have at least one entity type or field selected for the rule. Otherwise, the rule validation will fail and the rule won't be created.Re-open closed matching incidents: If an incident has been resolved and closed, and later on another alert is generated that should belong to that incident, set this setting to Enabled if you want the closed incident re-opened, and leave as Disabled if you want the alert to create a new incident.
Note
Up to 150 alerts can be grouped into a single incident.
The incident will only be created after all the alerts have been generated. All of the alerts will be added to the incident immediately upon its creation.
If more than 150 alerts are generated by a rule that groups them into a single incident, a new incident will be generated with the same incident details as the original, and the excess alerts will be grouped into the new incident.
Select Next: Automated response.
Set automated responses and create the rule
In the Automated responses tab, you can use automation rules to set automated responses to occur at any of three types of occasions:
- When an alert is generated by this analytics rule.
- When an incident is created from alerts generated by this analytics rule.
- When an incident is updated with alerts generated by this analytics rule.
The grid displayed under Automation rules shows the automation rules that already apply to this analytics rule (by virtue of it meeting the conditions defined in those rules). You can edit any of these by selecting the name of the rule or the ellipsis at the end of each row. Or, you can select Add new to create a new automation rule.
Use automation rules to perform basic triage, assignment, workflow, and closing of incidents.
Automate more complex tasks and invoke responses from remote systems to remediate threats by calling playbooks from these automation rules. You can invoke playbooks for incidents as well as for individual alerts.
For more information and instructions on creating playbooks and automation rules, see Automate threat responses.
For more information about when to use the incident created trigger, the incident updated trigger, or the alert created trigger, see Use triggers and actions in Microsoft Sentinel playbooks.
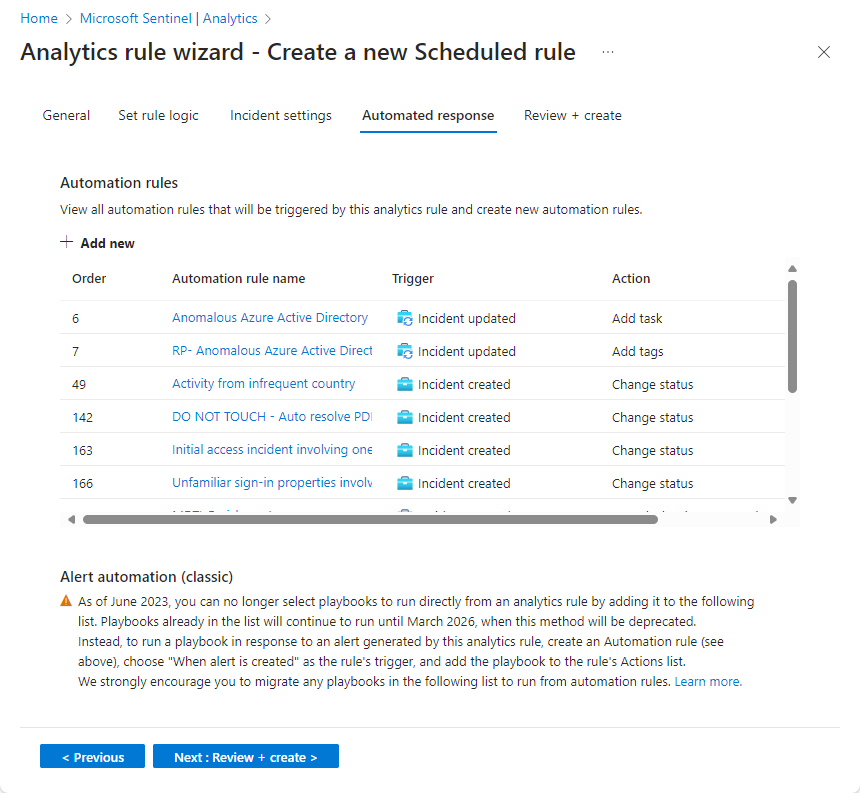
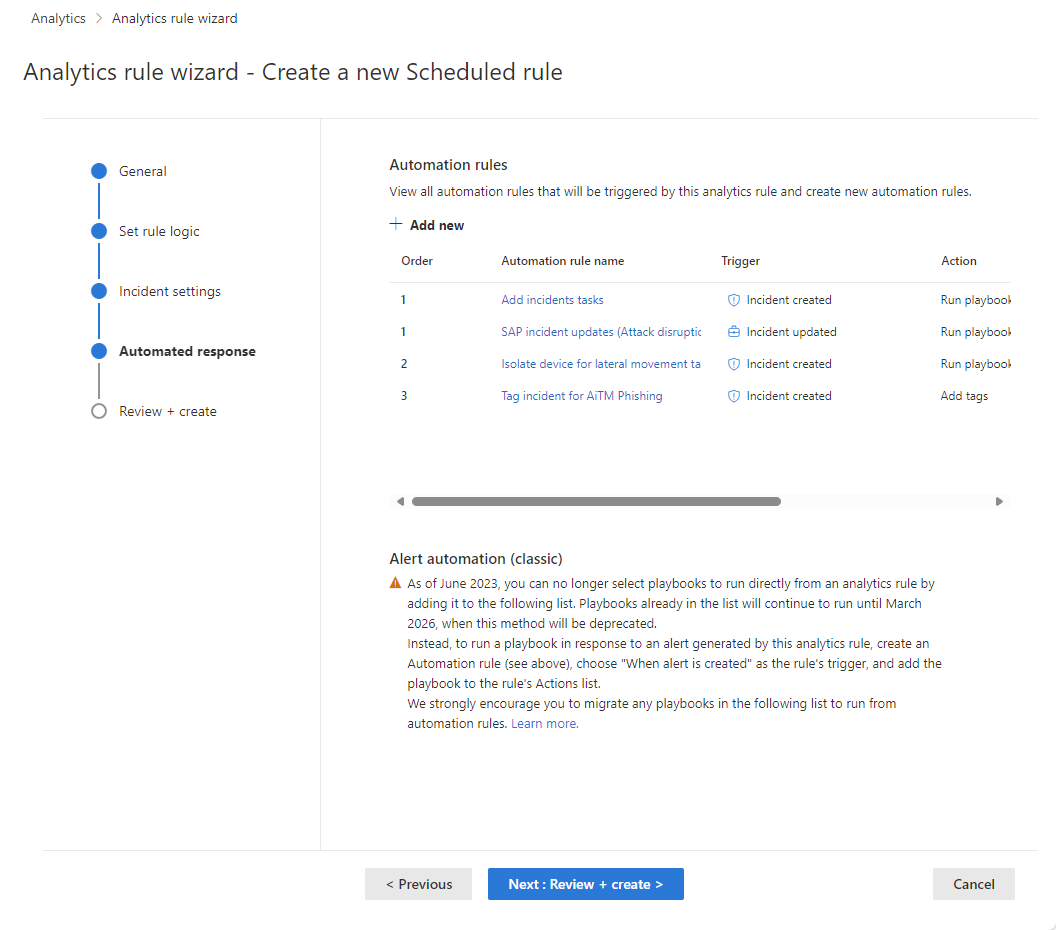
- Under Alert automation (classic) at the bottom of the screen, you'll see any playbooks you've configured to run automatically when an alert is generated using the old method.
As of June 2023, you can no longer add playbooks to this list. Playbooks already listed here will continue to run until this method is deprecated, effective March 2026.
If you still have any playbooks listed here, you should instead create an automation rule based on the alert created trigger and invoke the playbook from the automation rule. After you've done that, select the ellipsis at the end of the line of the playbook listed here, and select Remove. See Migrate your Microsoft Sentinel alert-trigger playbooks to automation rules for full instructions.
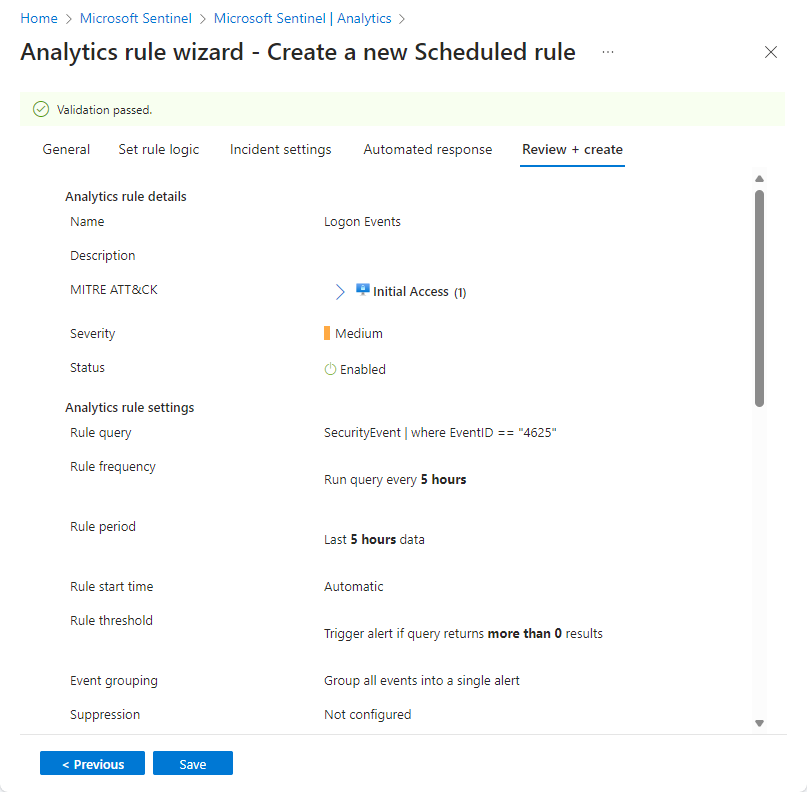
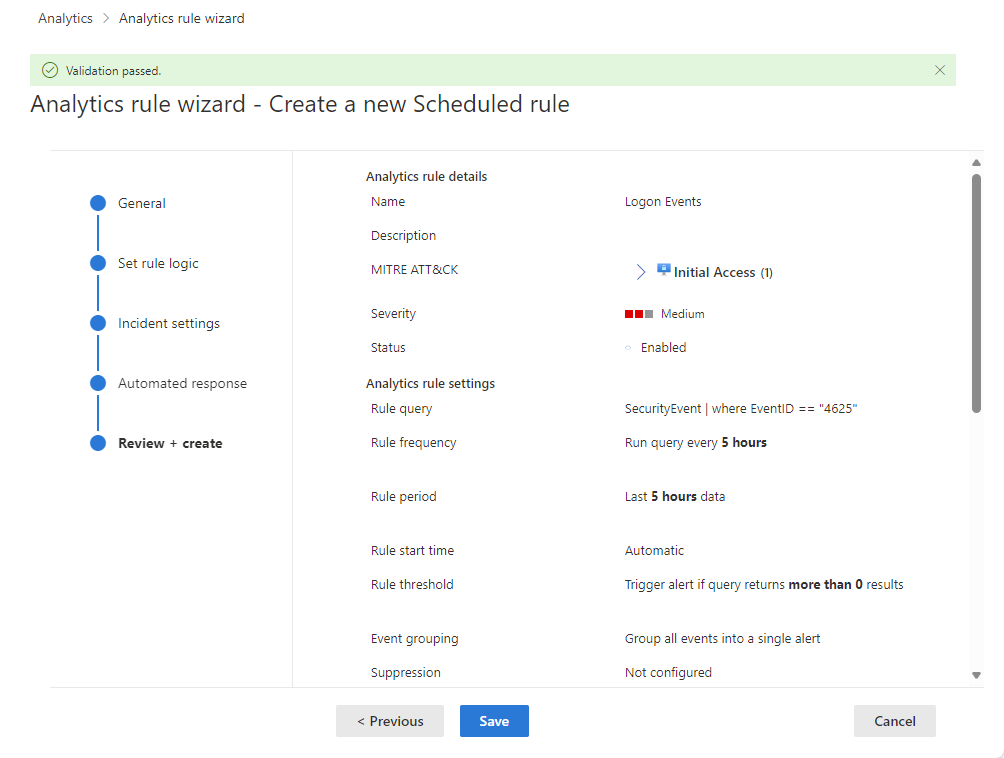
Select Next: Review and create to review all the settings for your new analytics rule. When the "Validation passed" message appears, select Create.
View the rule and its output
View the rule definition:
- You can find your newly created custom rule (of type "Scheduled") in the table under the Active rules tab on the main Analytics screen. From this list you can enable, disable, or delete each rule.
View the results of the rule:
- To view the results of the analytics rules you create in the Azure portal, go to the Incidents page, where you can triage incidents, investigate them, and remediate the threats.
Tune the rule:
- You can update the rule query to exclude false positives. For more information, see Handle false positives in Microsoft Sentinel.
Note
Alerts generated in Microsoft Sentinel are available through Microsoft Graph Security. For more information, see the Microsoft Graph Security alerts documentation.
Export the rule to an ARM template
If you want to package your rule to be managed and deployed as code, you can easily export the rule to an Azure Resource Manager (ARM) template. You can also import rules from template files in order to view and edit them in the user interface.
Next steps
When using analytics rules to detect threats from Microsoft Sentinel, make sure you enable all rules associated with your connected data sources to ensure full security coverage for your environment.
To automate rule enablement, push rules to Microsoft Sentinel via API and PowerShell, although doing so requires additional effort. When using API or PowerShell, you must first export the rules to JSON before enabling the rules. API or PowerShell may be helpful when enabling rules in multiple instances of Microsoft Sentinel with identical settings in each instance.
For more information, see:
- Troubleshooting analytics rules in Microsoft Sentinel
- Navigate and investigate incidents in Microsoft Sentinel
- Entities in Microsoft Sentinel
- Tutorial: Use playbooks with automation rules in Microsoft Sentinel
Also, learn from an example of using custom analytics rules when monitoring Zoom with a custom connector.
Feedback
Coming soon: Throughout 2024 we will be phasing out GitHub Issues as the feedback mechanism for content and replacing it with a new feedback system. For more information see: https://aka.ms/ContentUserFeedback.
Submit and view feedback for