Introduction to Service Fabric health monitoring
Azure Service Fabric introduces a health model that provides rich, flexible, and extensible health evaluation and reporting. The model allows near-real-time monitoring of the state of the cluster and the services running in it. You can easily obtain health information and correct potential issues before they cascade and cause massive outages. In the typical model, services send reports based on their local views, and that information is aggregated to provide an overall cluster-level view.
Service Fabric components use this rich health model to report their current state. You can use the same mechanism to report health from your applications. If you invest in high-quality health reporting that captures your custom conditions, you can detect and fix issues for your running application much more easily.
Note
We started the health subsystem to address a need for monitored upgrades. Service Fabric provides monitored application and cluster upgrades that ensure full availability, no downtime and minimal to no user intervention. To achieve these goals, the upgrade checks health based on configured upgrade policies. An upgrade can proceed only when health respects desired thresholds. Otherwise, the upgrade is either automatically rolled back or paused to give administrators a chance to fix the issues. To learn more about application upgrades, see this article.
Health store
The health store keeps health-related information about entities in the cluster for easy retrieval and evaluation. It is implemented as a Service Fabric persisted stateful service to ensure high availability and scalability. The health store is part of the fabric:/System application, and it is available when the cluster is up and running.
Health entities and hierarchy
The health entities are organized in a logical hierarchy that captures interactions and dependencies among different entities. The health store automatically builds health entities and hierarchy based on reports received from Service Fabric components.
The health entities mirror the Service Fabric entities. (For example, health application entity matches an application instance deployed in the cluster, while health node entity matches a Service Fabric cluster node.) The health hierarchy captures the interactions of the system entities, and it is the basis for advanced health evaluation. You can learn about key Service Fabric concepts in Service Fabric technical overview. For more on application, see Service Fabric application model.
The health entities and hierarchy allow the cluster and applications to be effectively reported, debugged, and monitored. The health model provides an accurate, granular representation of the health of the many moving pieces in the cluster.
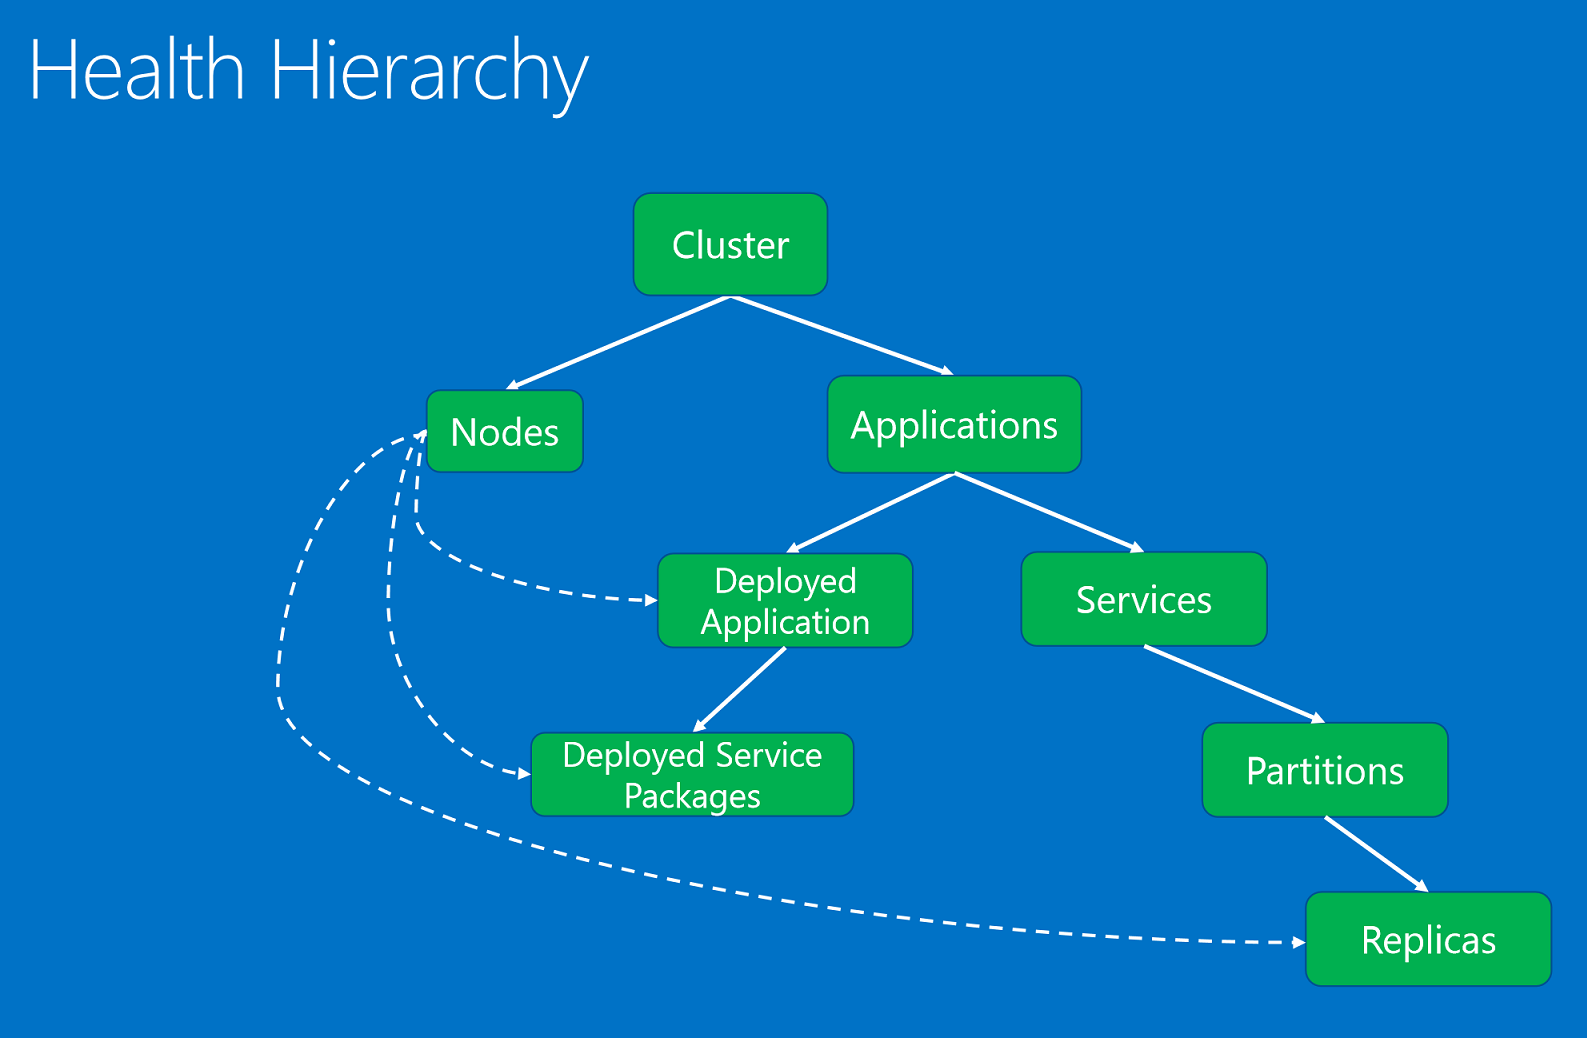 The health entities, organized in a hierarchy based on parent-child relationships.
The health entities are:
- Cluster. Represents the health of a Service Fabric cluster. Cluster health reports describe conditions that affect the entire cluster. These conditions affect multiple entities in the cluster or the cluster itself. Based on the condition, the reporter can't narrow the issue down to one or more unhealthy children. Examples include the brain of the cluster splitting due to network partitioning or communication issues.
- Node. Represents the health of a Service Fabric node. Node health reports describe conditions that affect the node functionality. They typically affect all the deployed entities running on it. Examples include node out of disk space (or other machine-wide properties, such as memory, connections) and when a node is down. The node entity is identified by the node name (string).
- Application. Represents the health of an application instance running in the cluster. Application health reports describe conditions that affect the overall health of the application. They can't be narrowed down to individual children (services or deployed applications). Examples include the end-to-end interaction among different services in the application. The application entity is identified by the application name (URI).
- Service. Represents the health of a service running in the cluster. Service health reports describe conditions that affect the overall health of the service. The reporter can't narrow down the issue to an unhealthy partition or replica. Examples include a service configuration (such as port or external file share) that is causing issues for all partitions. The service entity is identified by the service name (URI).
- Partition. Represents the health of a service partition. Partition health reports describe conditions that affect the entire replica set. Examples include when the number of replicas is below target count and when a partition is in quorum loss. The partition entity is identified by the partition ID (GUID).
- Replica. Represents the health of a stateful service replica or a stateless service instance. The replica is the smallest unit that watchdogs and system components can report on for an application. For stateful services, examples include a primary replica that can't replicate operations to secondaries and slow replication. Also, a stateless instance can report when it is running out of resources or has connectivity issues. The replica entity is identified by the partition ID (GUID) and the replica or instance ID (long).
- DeployedApplication. Represents the health of an application running on a node. Deployed application health reports describe conditions specific to the application on the node that can't be narrowed down to service packages deployed on the same node. Examples include errors when application package can't be downloaded on that node and issues setting up application security principals on the node. The deployed application is identified by application name (URI) and node name (string).
- DeployedServicePackage. Represents the health of a service package running on a node in the cluster. It describes conditions specific to a service package that do not affect the other service packages on the same node for the same application. Examples include a code package in the service package that cannot be started and a configuration package that cannot be read. The deployed service package is identified by application name (URI), node name (string), service manifest name (string), and service package activation ID (string).
The granularity of the health model makes it easy to detect and correct issues. For example, if a service is not responding, it is feasible to report that the application instance is unhealthy. Reporting at that level is not ideal, however, because the issue might not be affecting all the services within that application. The report should be applied to the unhealthy service or to a specific child partition, if more information points to that partition. The data automatically surfaces through the hierarchy, and an unhealthy partition is made visible at service and application levels. This aggregation helps to pinpoint and resolve the root cause of the issue more quickly.
The health hierarchy is composed of parent-child relationships. A cluster is composed of nodes and applications. Applications have services and deployed applications. Deployed applications have deployed service packages. Services have partitions, and each partition has one or more replicas. There is a special relationship between nodes and deployed entities. An unhealthy node as reported by its authority system component, the Failover Manager service, affects the deployed applications, service packages, and replicas deployed on it.
The health hierarchy represents the latest state of the system based on the latest health reports, which is almost real-time information. Internal and external watchdogs can report on the same entities based on application-specific logic or custom monitored conditions. User reports coexist with the system reports.
Plan to invest in how to report and respond to health during the design of a large cloud service. This up-front investment makes the service easier to debug, monitor, and operate.
Health states
Service Fabric uses three health states to describe whether an entity is healthy or not: OK, warning, and error. Any report sent to the health store must specify one of these states. The health evaluation result is one of these states.
The possible health states are:
- OK. The entity is healthy. There are no known issues reported on it or its children (when applicable).
- Warning. The entity has some issues, but it can still function correctly. For example, there are delays, but they do not cause any functional issues yet. In some cases, the warning condition may fix itself without external intervention. In these cases, health reports raise awareness and provide visibility into what is going on. In other cases, the warning condition may degrade into a severe problem without user intervention.
- Error. The entity is unhealthy. Action should be taken to fix the state of the entity, because it can't function properly.
- Unknown. The entity doesn't exist in the health store. This result can be obtained from the distributed queries that merge results from multiple components. For example, the get node list query goes to FailoverManager, ClusterManager, and HealthManager; get application list query goes to ClusterManager and HealthManager. These queries merge results from multiple system components. If another system component returns an entity that is not present in health store, the merged result has unknown health state. An entity is not in store because health reports have not yet been processed or the entity has been cleaned up after deletion.
Health policies
The health store applies health policies to determine whether an entity is healthy based on its reports and its children.
Note
Health policies can be specified in the cluster manifest (for cluster and node health evaluation) or in the application manifest (for application evaluation and any of its children). Health evaluation requests can also pass in custom health evaluation policies, which are used only for that evaluation.
By default, Service Fabric applies strict rules (everything must be healthy) for the parent-child hierarchical relationship. If even one of the children has one unhealthy event, the parent is considered unhealthy.
Cluster health policy
The cluster health policy is used to evaluate the cluster health state and node health states. The policy can be defined in the cluster manifest. If it is not present, the default policy (zero tolerated failures) is used.
The cluster health policy contains:
ConsiderWarningAsError. Specifies whether to treat warning health reports as errors during health evaluation. Default: false.
MaxPercentUnhealthyApplications. Specifies the maximum tolerated percentage of applications that can be unhealthy before the cluster is considered in error.
MaxPercentUnhealthyNodes. Specifies the maximum tolerated percentage of nodes that can be unhealthy before the cluster is considered in error. In large clusters, some nodes are always down or out for repairs, so this percentage should be configured to tolerate that.
ApplicationTypeHealthPolicyMap. The application type health policy map can be used during cluster health evaluation to describe special application types. By default, all applications are put into a pool and evaluated with MaxPercentUnhealthyApplications. If some application types should be treated differently, they can be taken out of the global pool. Instead, they are evaluated against the percentages associated with their application type name in the map. For example, in a cluster there are thousands of applications of different types, and a few control application instances of a special application type. The control applications should never be in error. You can specify global MaxPercentUnhealthyApplications to 20% to tolerate some failures, but for the application type "ControlApplicationType" set the MaxPercentUnhealthyApplications to 0. This way, if some of the many applications are unhealthy, but below the global unhealthy percentage, the cluster would be evaluated to Warning. A warning health state does not impact cluster upgrade or other monitoring triggered by Error health state. But even one control application in error would make cluster unhealthy, which triggers rollback or pauses the cluster upgrade, depending on the upgrade configuration. For the application types defined in the map, all application instances are taken out of the global pool of applications. They are evaluated based on the total number of applications of the application type, using the specific MaxPercentUnhealthyApplications from the map. All the rest of the applications remain in the global pool and are evaluated with MaxPercentUnhealthyApplications.
The following example is an excerpt from a cluster manifest. To define entries in the application type map, prefix the parameter name with "ApplicationTypeMaxPercentUnhealthyApplications-", followed by the application type name.
<FabricSettings> <Section Name="HealthManager/ClusterHealthPolicy"> <Parameter Name="ConsiderWarningAsError" Value="False" /> <Parameter Name="MaxPercentUnhealthyApplications" Value="20" /> <Parameter Name="MaxPercentUnhealthyNodes" Value="20" /> <Parameter Name="ApplicationTypeMaxPercentUnhealthyApplications-ControlApplicationType" Value="0" /> </Section> </FabricSettings>NodeTypeHealthPolicyMap. The node type health policy map can be used during cluster health evaluation to describe special node types. The node types are evaluated against the percentages associated with their node type name in the map. Setting this value has no effect on the global pool of nodes used forMaxPercentUnhealthyNodes. For example, a cluster has hundreds of nodes of different types and a few node types that host important work. No nodes in that type should be down. You can specify globalMaxPercentUnhealthyNodesto 20% to tolerate some failures for all nodes, but for the node typeSpecialNodeType, set theMaxPercentUnhealthyNodesto 0. This way, if some of the many nodes are unhealthy but below the global unhealthy percentage, the cluster would be evaluated as being in the Warning health state. A Warning health state doesn't affect cluster upgrade or other monitoring triggered by an Error health state. But even one node of typeSpecialNodeTypein an Error health state would make the cluster unhealthy and trigger rollback or pause the cluster upgrade, depending on the upgrade configuration. Conversely, setting the globalMaxPercentUnhealthyNodesto 0 and setting theSpecialNodeTypemax percent unhealthy nodes to 100 with one node of typeSpecialNodeTypein an error state would still put the cluster in an error state because the global restriction is more strict in this case.The following example is an excerpt from a cluster manifest. To define entries in the node type map, prefix the parameter name with "NodeTypeMaxPercentUnhealthyNodes-", followed by the node type name.
<FabricSettings>
  <Section Name="HealthManager/ClusterHealthPolicy">
    <Parameter Name="ConsiderWarningAsError" Value="False" />
    <Parameter Name="MaxPercentUnhealthyApplications" Value="20" />
    <Parameter Name="MaxPercentUnhealthyNodes" Value="20" />
    <Parameter Name="NodeTypeMaxPercentUnhealthyNodes-SpecialNodeType" Value="0" />
  </Section>
</FabricSettings>
Application health policy
The application health policy describes how the evaluation of events and child-states aggregation is done for applications and their children. It can be defined in the application manifest, ApplicationManifest.xml, in the application package. If no policies are specified, Service Fabric assumes that the entity is unhealthy if it has a health report or a child at the warning or error health state. The configurable policies are:
- ConsiderWarningAsError. Specifies whether to treat warning health reports as errors during health evaluation. Default: false.
- MaxPercentUnhealthyDeployedApplications. Specifies the maximum tolerated percentage of deployed applications that can be unhealthy before the application is considered in error. This percentage is calculated by dividing the number of unhealthy deployed applications over the number of nodes that the applications are currently deployed on in the cluster. The computation rounds up to tolerate one failure on small numbers of nodes. Default percentage: zero.
- DefaultServiceTypeHealthPolicy. Specifies the default service type health policy, which replaces the default health policy for all service types in the application.
- ServiceTypeHealthPolicyMap. Provides a map of service health policies per service type. These policies replace the default service type health policies for each specified service type. For example, if an application has a stateless gateway service type and a stateful engine service type, you can configure the health policies for their evaluation differently. When you specify policy per service type, you can gain more granular control of the health of the service.
Service type health policy
The service type health policy specifies how to evaluate and aggregate the services and the children of services. The policy contains:
- MaxPercentUnhealthyPartitionsPerService. Specifies the maximum tolerated percentage of unhealthy partitions before a service is considered unhealthy. Default percentage: zero.
- MaxPercentUnhealthyReplicasPerPartition. Specifies the maximum tolerated percentage of unhealthy replicas before a partition is considered unhealthy. Default percentage: zero.
- MaxPercentUnhealthyServices. Specifies the maximum tolerated percentage of unhealthy services before the application is considered unhealthy. Default percentage: zero.
The following example is an excerpt from an application manifest:
    <Policies>
        <HealthPolicy ConsiderWarningAsError="true" MaxPercentUnhealthyDeployedApplications="20">
            <DefaultServiceTypeHealthPolicy
                   MaxPercentUnhealthyServices="0"
                   MaxPercentUnhealthyPartitionsPerService="10"
                   MaxPercentUnhealthyReplicasPerPartition="0"/>
            <ServiceTypeHealthPolicy ServiceTypeName="FrontEndServiceType"
                   MaxPercentUnhealthyServices="0"
                   MaxPercentUnhealthyPartitionsPerService="20"
                   MaxPercentUnhealthyReplicasPerPartition="0"/>
            <ServiceTypeHealthPolicy ServiceTypeName="BackEndServiceType"
                   MaxPercentUnhealthyServices="20"
                   MaxPercentUnhealthyPartitionsPerService="0"
                   MaxPercentUnhealthyReplicasPerPartition="0">
            </ServiceTypeHealthPolicy>
        </HealthPolicy>
    </Policies>
Health evaluation
Users and automated services can evaluate health for any entity at any time. To evaluate an entity's health, the health store aggregates all health reports on the entity and evaluates all its children (when applicable). The health aggregation algorithm uses health policies that specify how to evaluate health reports and how to aggregate child health states (when applicable).
Health report aggregation
One entity can have multiple health reports sent by different reporters (system components or watchdogs) on different properties. The aggregation uses the associated health policies, in particular the ConsiderWarningAsError member of application or cluster health policy. ConsiderWarningAsError specifies how to evaluate warnings.
The aggregated health state is triggered by the worst health reports on the entity. If there is at least one error health report, the aggregated health state is an error.

A health entity that has one or more error health reports is evaluated as Error. The same is true for an expired health report, regardless of its health state.
If there are no error reports and one or more warnings, the aggregated health state is either warning or error, depending on the ConsiderWarningAsError policy flag.
Health report aggregation with warning report and ConsiderWarningAsError set to false (default).
Child health aggregation
The aggregated health state of an entity reflects the child health states (when applicable). The algorithm for aggregating child health states uses the health policies applicable based on the entity type.
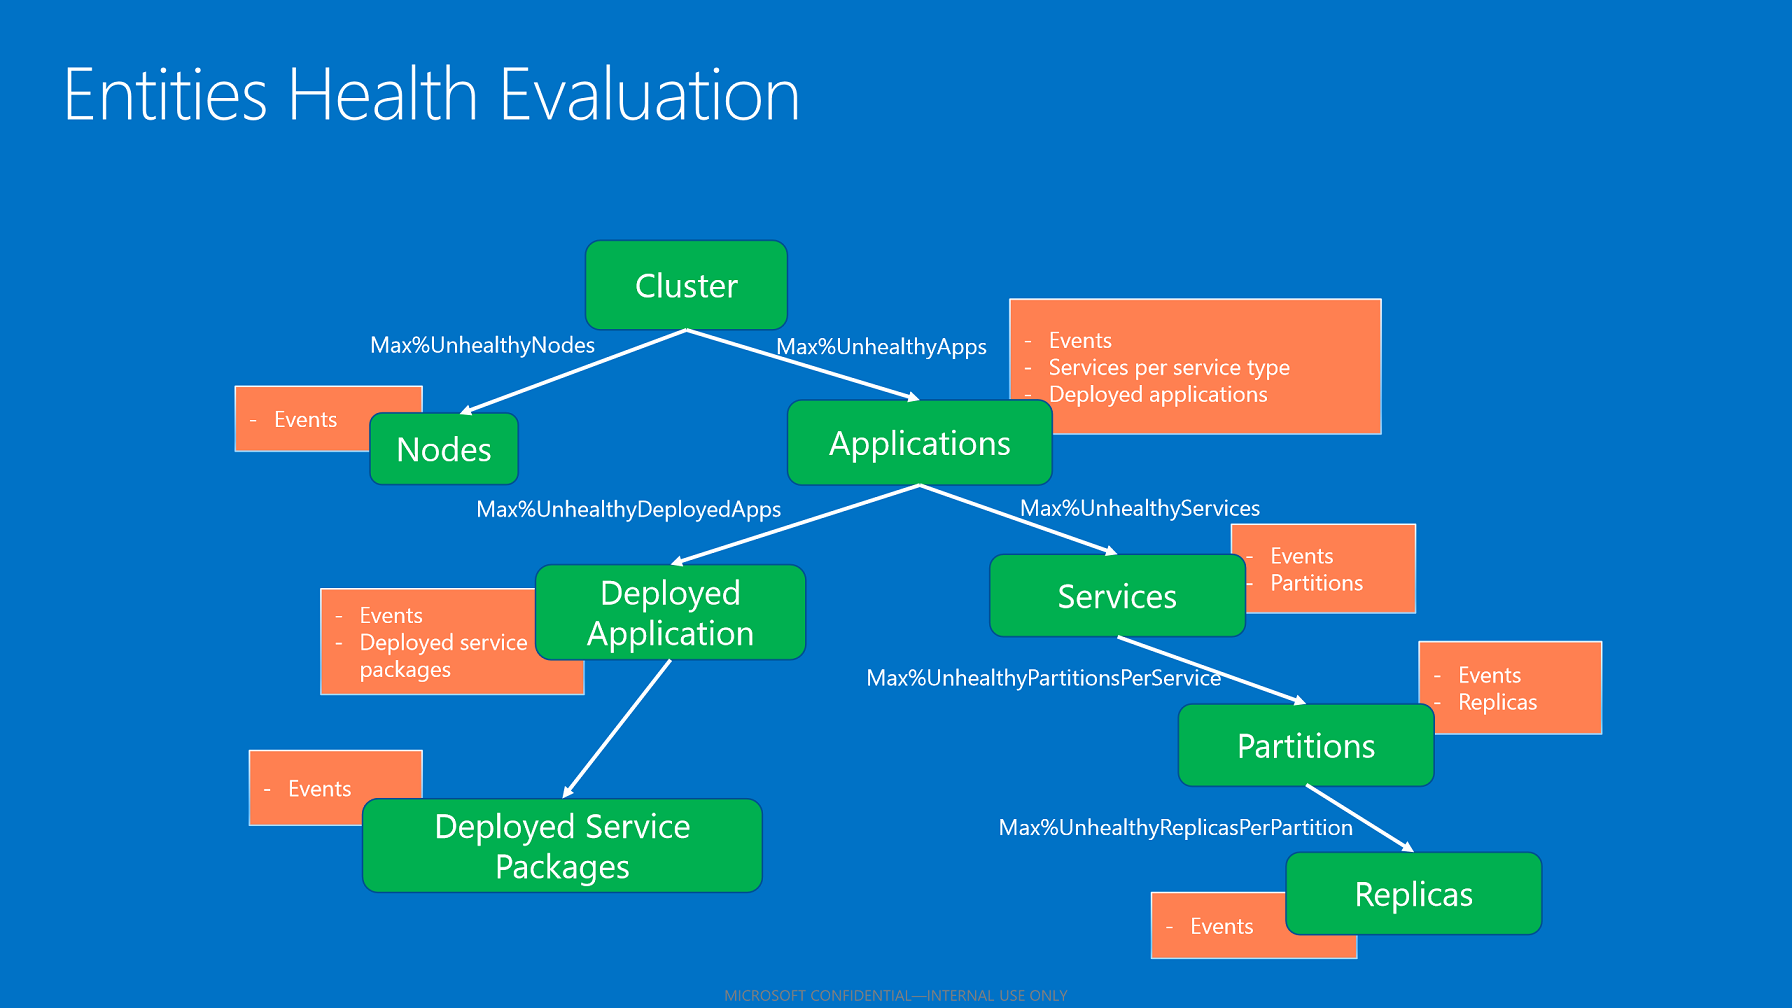
Child aggregation based on health policies.
After the health store has evaluated all the children, it aggregates their health states based on the configured maximum percentage of unhealthy children. This percentage is taken from the policy based on the entity and child type.
- If all children have OK states, the child aggregated health state is OK.
- If children have both OK and warning states, the child aggregated health state is warning.
- If there are children with error states that do not respect the maximum allowed percentage of unhealthy children, the aggregated parent health state is an error.
- If the children with error states respect the maximum allowed percentage of unhealthy children, the aggregated parent health state is warning.
Health reporting
System components, System Fabric applications, and internal/external watchdogs can report against Service Fabric entities. The reporters make local determinations of the health of the monitored entities, based on the conditions they are monitoring. They don't need to look at any global state or aggregate data. The desired behavior is to have simple reporters, and not complex organisms that need to look at many things to infer what information to send.
To send health data to the health store, a reporter needs to identify the affected entity and create a health report. To send the report, use the FabricClient.HealthClient.ReportHealth API, report health APIs exposed on the Partition or CodePackageActivationContext objects, PowerShell cmdlets, or REST.
Health reports
The health reports for each of the entities in the cluster contain the following information:
SourceId. A string that uniquely identifies the reporter of the health event.
Entity identifier. Identifies the entity where the report is applied. It differs based on the entity type:
- Cluster. None.
- Node. Node name (string).
- Application. Application name (URI). Represents the name of the application instance deployed in the cluster.
- Service. Service name (URI). Represents the name of the service instance deployed in the cluster.
- Partition. Partition ID (GUID). Represents the partition unique identifier.
- Replica. The stateful service replica ID or the stateless service instance ID (INT64).
- DeployedApplication. Application name (URI) and node name (string).
- DeployedServicePackage. Application name (URI), node name (string), and service manifest name (string).
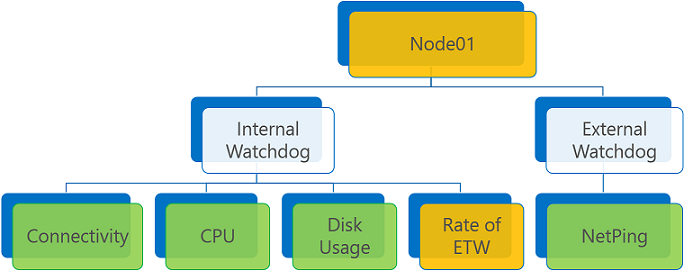
Property. A string (not a fixed enumeration) that allows the reporter to categorize the health event for a specific property of the entity. For example, reporter A can report the health of the Node01 "Storage" property and reporter B can report the health of the Node01 "Connectivity" property. In the health store, these reports are treated as separate health events for the Node01 entity.
Description. A string that allows a reporter to provide detailed information about the health event. SourceId, Property, and HealthState should fully describe the report. The description adds human-readable information about the report. The text makes it easier for administrators and users to understand the health report.
HealthState. An enumeration that describes the health state of the report. The accepted values are OK, Warning, and Error.
TimeToLive. A timespan that indicates how long the health report is valid. Coupled with RemoveWhenExpired, it lets the health store know how to evaluate expired events. By default, the value is infinite, and the report is valid forever.
RemoveWhenExpired. A boolean. If set to true, the expired health report is automatically removed from the health store, and the report doesn't impact entity health evaluation. Used when the report is valid for a specified period of time only, and the reporter doesn't need to explicitly clear it out. It's also used to delete reports from the health store (for example, a watchdog is changed and stops sending reports with previous source and property). It can send a report with a brief TimeToLive along with RemoveWhenExpired to clear up any previous state from the health store. If the value is set to false, the expired report is treated as an error on the health evaluation. The false value signals to the health store that the source should report periodically on this property. If it doesn't, then there must be something wrong with the watchdog. The watchdog's health is captured by considering the event as an error.
SequenceNumber. A positive integer that needs to be ever-increasing, it represents the order of the reports. It is used by the health store to detect stale reports that are received late because of network delays or other issues. A report is rejected if the sequence number is less than or equal to the most recently applied number for the same entity, source, and property. If it is not specified, the sequence number is generated automatically. It is necessary to put in the sequence number only when reporting on state transitions. In this situation, the source needs to remember which reports it sent and keep the information for recovery on failover.
These four pieces of information--SourceId, entity identifier, Property, and HealthState--are required for every health report. The SourceId string is not allowed to start with the prefix "System.", which is reserved for system reports. For the same entity, there is only one report for the same source and property. Multiple reports for the same source and property override each other, either on the health client side (if they are batched) or on the health store side. The replacement is based on sequence numbers; newer reports (with higher sequence numbers) replace older reports.
Health events
Internally, the health store keeps health events, which contain all the information from the reports, and additional metadata. The metadata includes the time the report was given to the health client and the time it was modified on the server side. The health events are returned by health queries.
The added metadata contains:
- SourceUtcTimestamp. The time the report was given to the health client (Coordinated Universal Time).
- LastModifiedUtcTimestamp. The time the report was last modified on the server side (Coordinated Universal Time).
- IsExpired. A flag to indicate whether the report was expired when the query was executed by the health store. An event can be expired only if RemoveWhenExpired is false. Otherwise, the event is not returned by query and is removed from the store.
- LastOkTransitionAt, LastWarningTransitionAt, LastErrorTransitionAt. The last time for OK/warning/error transitions. These fields give the history of the health state transitions for the event.
The state transition fields can be used for smarter alerts or "historical" health event information. They enable scenarios such as:
- Alert when a property has been at warning/error for more than X minutes. Checking the condition for a period of time avoids alerts on temporary conditions. For example, an alert if the health state has been warning for more than five minutes can be translated into (HealthState == Warning and Now - LastWarningTransitionTime > 5 minutes).
- Alert only on conditions that have changed in the last X minutes. If a report was already at error before the specified time, it can be ignored because it was already signaled previously.
- If a property is toggling between warning and error, determine how long it has been unhealthy (that is, not OK). For example, an alert if the property hasn't been healthy for more than five minutes can be translated into (HealthState != Ok and Now - LastOkTransitionTime > 5 minutes).
Example: Report and evaluate application health
The following example sends a health report through PowerShell on the application fabric:/WordCount from the source MyWatchdog. The health report contains information about the health property "availability" in an error health state, with infinite TimeToLive. Then it queries the application health, which returns aggregated health state errors and the reported health events in the list of health events.
PS C:\> Send-ServiceFabricApplicationHealthReport –ApplicationName fabric:/WordCount –SourceId "MyWatchdog" –HealthProperty "Availability" –HealthState Error

PS C:\> Get-ServiceFabricApplicationHealth fabric:/WordCount -ExcludeHealthStatistics


ApplicationName                 : fabric:/WordCount
AggregatedHealthState           : Error
UnhealthyEvaluations            :
                                  Error event: SourceId='MyWatchdog', Property='Availability'.

ServiceHealthStates             :
                                  ServiceName           : fabric:/WordCount/WordCountService
                                  AggregatedHealthState : Error

                                  ServiceName           : fabric:/WordCount/WordCountWebService
                                  AggregatedHealthState : Ok

DeployedApplicationHealthStates :
                                  ApplicationName       : fabric:/WordCount
                                  NodeName              : _Node_0
                                  AggregatedHealthState : Ok

                                  ApplicationName       : fabric:/WordCount
                                  NodeName              : _Node_2
                                  AggregatedHealthState : Ok

                                  ApplicationName       : fabric:/WordCount
                                  NodeName              : _Node_3
                                  AggregatedHealthState : Ok

                                  ApplicationName       : fabric:/WordCount
                                  NodeName              : _Node_4
                                  AggregatedHealthState : Ok

                                  ApplicationName       : fabric:/WordCount
                                  NodeName              : _Node_1
                                  AggregatedHealthState : Ok

HealthEvents                    :
                                  SourceId              : System.CM
                                  Property              : State
                                  HealthState           : Ok
                                  SequenceNumber        : 360
                                  SentAt                : 3/22/2016 7:56:53 PM
                                  ReceivedAt            : 3/22/2016 7:56:53 PM
                                  TTL                   : Infinite
                                  Description           : Application has been created.
                                  RemoveWhenExpired     : False
                                  IsExpired             : False
                                  Transitions           : Error->Ok = 3/22/2016 7:56:53 PM, LastWarning = 1/1/0001 12:00:00 AM

                                  SourceId              : MyWatchdog
                                  Property              : Availability
                                  HealthState           : Error
                                  SequenceNumber        : 131032204762818013
                                  SentAt                : 3/23/2016 3:27:56 PM
                                  ReceivedAt            : 3/23/2016 3:27:56 PM
                                  TTL                   : Infinite
                                  Description           :
                                  RemoveWhenExpired     : False
                                  IsExpired             : False
                                  Transitions           : Ok->Error = 3/23/2016 3:27:56 PM, LastWarning = 1/1/0001 12:00:00 AM
Health model usage
The health model allows cloud services and the underlying Service Fabric platform to scale, because monitoring and health determinations are distributed among the different monitors within the cluster. Other systems have a single, centralized service at the cluster level that parses all the potentially useful information emitted by services. This approach hinders their scalability. It also doesn't allow them to collect specific information to help identify issues and potential issues as close to the root cause as possible.
The health model is used heavily for monitoring and diagnosis, for evaluating cluster and application health, and for monitored upgrades. Other services use health data to perform automatic repairs, build cluster health history, and issue alerts on certain conditions.
Next steps
View Service Fabric health reports
Use system health reports for troubleshooting
How to report and check service health
Add custom Service Fabric health reports
Feedback
Coming soon: Throughout 2024 we will be phasing out GitHub Issues as the feedback mechanism for content and replacing it with a new feedback system. For more information see: https://aka.ms/ContentUserFeedback.
Submit and view feedback for