Analyze logs with Elastic (ELK) using diagnostics settings
Note
Azure Spring Apps is the new name for the Azure Spring Cloud service. Although the service has a new name, you'll see the old name in some places for a while as we work to update assets such as screenshots, videos, and diagrams.
This article applies to: ✔️ Java ✔️ C#
This article applies to: ✔️ Basic/Standard ✔️ Enterprise
This article shows you how to use the diagnostics functionality of Azure Spring Apps to analyze logs with Elastic (ELK).
The following video introduces unified observability for Spring Boot applications using Elastic.
Configure diagnostics settings
To configure diagnostics settings, use the following steps:
- In the Azure portal, go to your Azure Spring Apps instance.
- Select diagnostics settings option, then select Add diagnostics setting.
- Enter a name for the setting, choose Send to partner solution, then select Elastic and an Elastic deployment where you want to send the logs.
- Select Save.

Note
There might be a gap of up to 15 minutes between when logs are emitted and when they appear in your Elastic deployment. If the Azure Spring Apps instance is deleted or moved, the operation won't cascade to the diagnostics settings resources. You have to manually delete the diagnostics settings resources before you perform the operation against its parent, the Azure Spring Apps instance. Otherwise, if you provision a new Azure Spring Apps instance with the same resource ID as the deleted one, or if you move the Azure Spring Apps instance back, the previous diagnostics settings resources will continue to extend it.
Analyze the logs with Elastic
To learn more about deploying Elastic on Azure, see How to deploy and manage Elastic on Microsoft Azure.
Use the following steps to analyze the logs:
From the Elastic deployment overview page in the Azure portal, open Kibana.

In Kibana, in the Search bar at top, type Spring Cloud type:dashboard.

Select [Logs Azure] Azure Spring Apps logs Overview from the results.
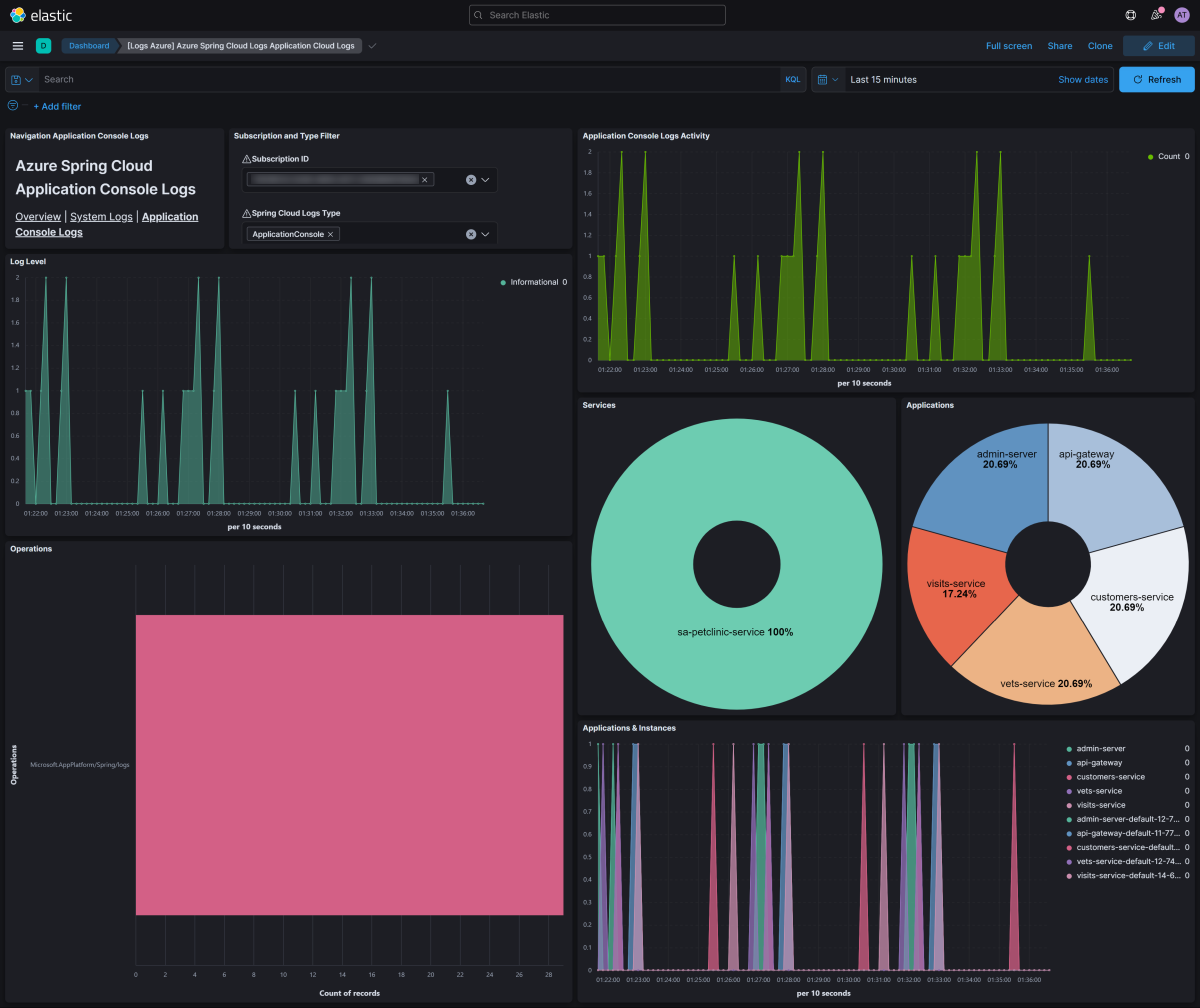
Search on out-of-the-box Azure Spring Apps dashboards by using the queries such as the following:
azure.springcloudlogs.properties.app_name : "visits-service"


Analyze the logs with Kibana Query Language in Discover
Application logs provide critical information and verbose logs about your application's health, performance, and more. Use the following steps to analyze the logs:
In Kibana, in the Search bar at top, type Discover, then select the result.

In the Discover app, select the logs- index pattern if it's not already selected.
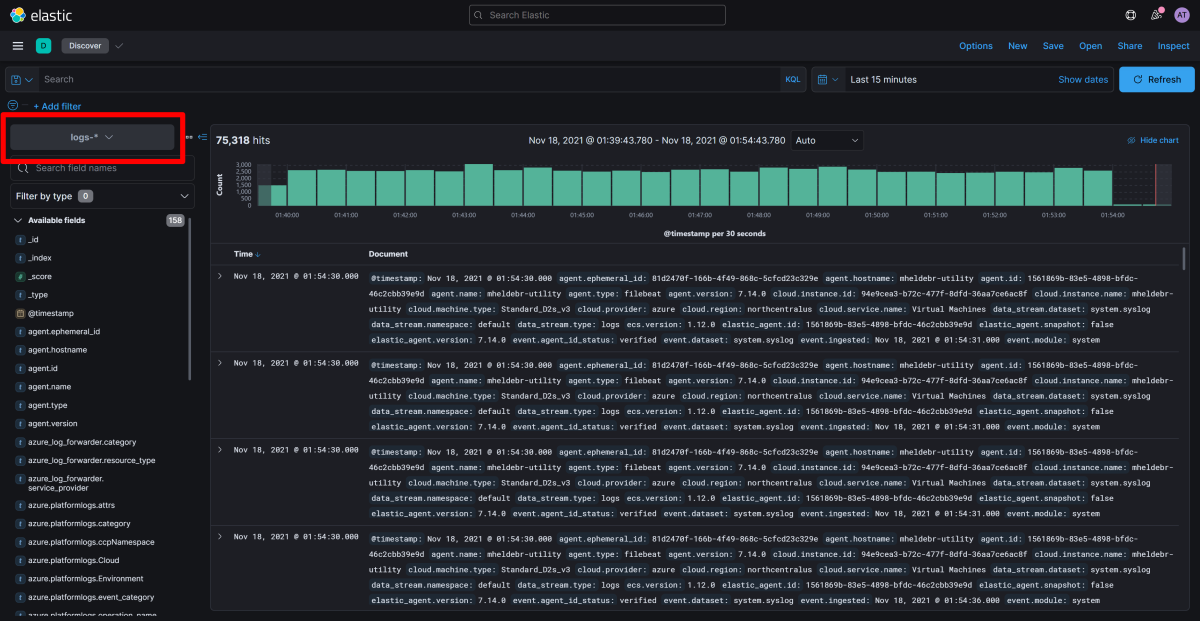
Use queries such as the ones in the following sections to help you understand your application's current and past states.


For more information about different queries, see Guide to Kibana Query Language.
Show all logs from Azure Spring Apps
To review a list of application logs from Azure Spring Apps, sorted by time with the most recent logs shown first, run the following query in the Search box:
azure_log_forwarder.resource_type : "Microsoft.AppPlatform/Spring"

Show specific log types from Azure Spring Apps
To review a list of application logs from Azure Spring Apps, sorted by time with the most recent logs shown first, run the following query in the Search box:
azure.springcloudlogs.category : "ApplicationConsole"

Show log entries containing errors or exceptions
To review unsorted log entries that mention an error or exception, run the following query:
azure_log_forwarder.resource_type : "Microsoft.AppPlatform/Spring" and (log.level : "ERROR" or log.level : "EXCEPTION")

The Kibana Query Language helps you form queries by providing autocomplete and suggestions to help you gain insights from the logs. Use your query to find errors, or modify the query terms to find specific error codes or exceptions.
Show log entries from a specific service
To review log entries that are generated by a specific service, run the following query:
azure.springcloudlogs.properties.service_name : "sa-petclinic-service"

Show Config Server logs containing warnings or errors
To review logs from Config Server, run the following query:
azure.springcloudlogs.properties.type : "ConfigServer" and (log.level : "ERROR" or log.level : "WARN")

Show Service Registry logs
To review logs from Service Registry, run the following query:
azure.springcloudlogs.properties.type : "ServiceRegistry"

Visualizing logs from Azure Spring Apps with Elastic
Kibana allows you to visualize data with Dashboards and a rich ecosystem of visualizations. For more information, see Dashboard and Visualization.
Use the following steps to show the various log levels in your logs so you can assess the overall health of the services.
From the available fields list on left in Discover, search for log.level in the search box under the logs- index pattern.
Select the log.level field. From the floating informational panel about log.level, select Visualize.

From here, you can choose to add more data from the left pane, or choose from multiple suggestions how you would like to visualize your data.


Next steps
Feedback
Coming soon: Throughout 2024 we will be phasing out GitHub Issues as the feedback mechanism for content and replacing it with a new feedback system. For more information see: https://aka.ms/ContentUserFeedback.
Submit and view feedback for