Introduction to modeling your data
Often, you'll connect to multiple data sources to create your reports. All that data needs to work together to create a cohesive report. Modeling is how to get your connected data ready for use.
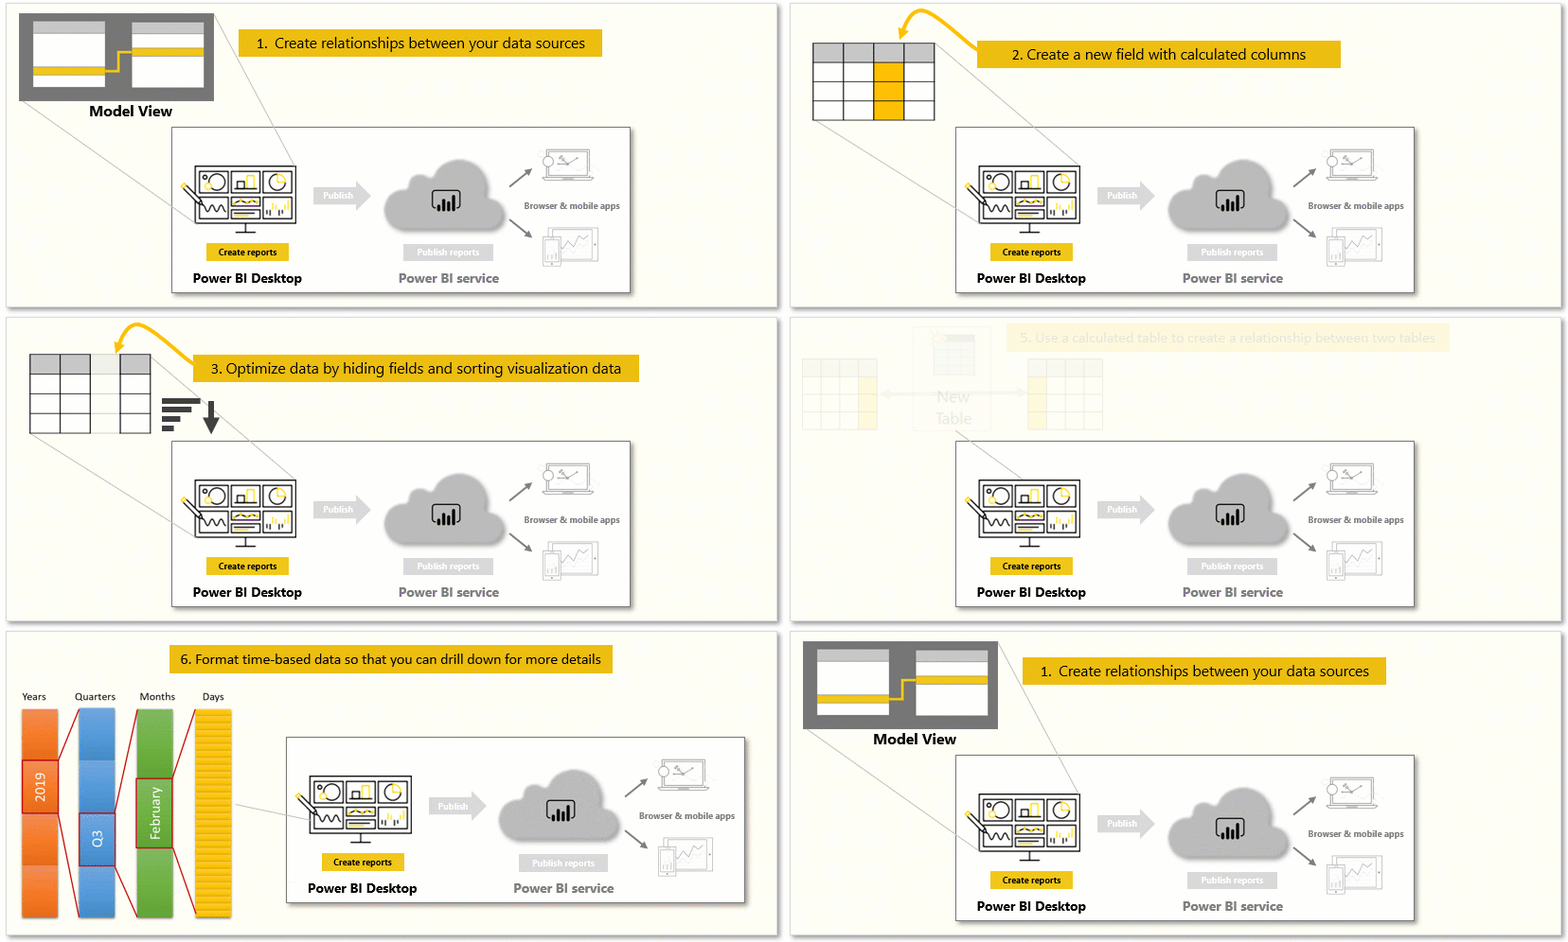
Tasks in this module:
- Create relationships between your data sources
- Create a new field with calculated columns
- Optimize data by hiding fields and sorting visualization data
- Create a measure to perform calculations on your data
- Use a calculated table to create a relationship between two tables
- Format time-based data so that you can drill down for more details

Video: Overview of modeling data
In Power BI, you can create a relationship to create a logical connection between different data sources. A relationship enables Power BI to connect tables to one another so that you can create visuals and reports. This module describes data-centric relationships and how to create relationships when none exists.
Note
One of Power BI's strengths is that you don't need to flatten your data into a single table. Instead, you can use multiple tables from multiple sources and define the relationship between them.
You'll also create your own custom calculations and assign new metrics to view specific segments of your data.