Monitor servers and configure alerts with Azure Monitor from Windows Admin Center
Applies to: Windows Server 2022, Windows Server 2019, Windows Server 2016
Azure Monitor is a solution that collects, analyzes, and acts on telemetry from various resources, including Windows Servers and VMs, both on-premises and in the cloud. Though Azure Monitor pulls data from Azure virtual machines (VMs) and other Azure resources, this article focuses on how Azure Monitor works with on-premises servers and VMs, specifically with Windows Admin Center. If you're interested to learn how you can use Azure Monitor to get email alerts about your hyper-converged cluster, read about using Azure Monitor to send emails for Health Service Faults.
How does Azure Monitor work?
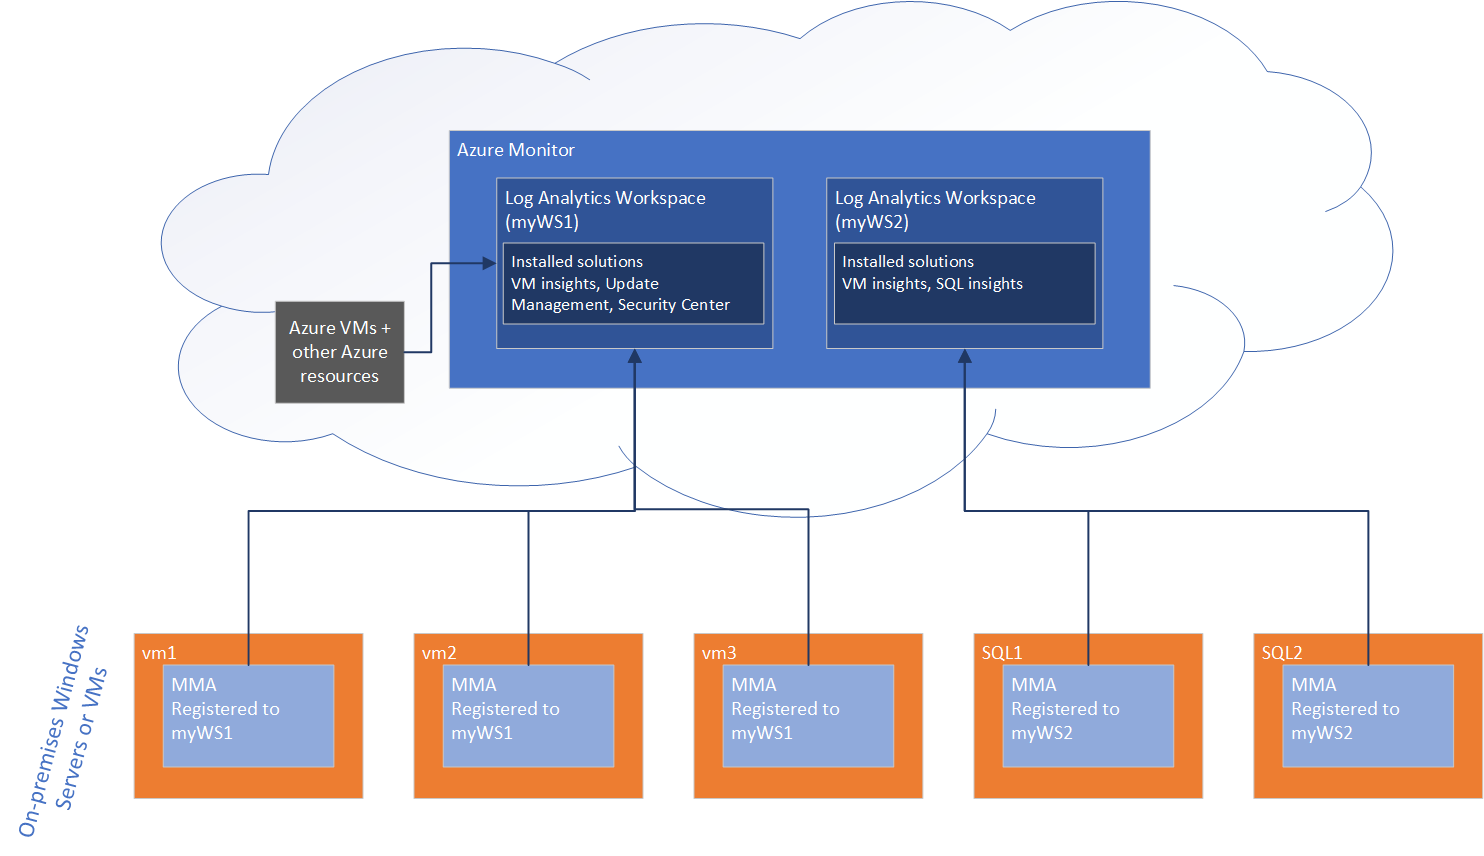
Data generated from on-premises Windows Servers is collected in a Log Analytics workspace in Azure Monitor. Within a workspace, you can enable various monitoring solutions—sets of logic that provide insights for a particular scenario. For example, Azure Update Management, Azure Security Center, and Azure Monitor for VMs are all monitoring solutions that can be enabled within a workspace.
When you enable a monitoring solution in a Log Analytics workspace, all the servers reporting to that workspace starts collecting data relevant to that solution, so that the solution can generate insights for all the servers in the workspace.
To collect telemetry data on an on-premises server and push it to the Log Analytics workspace, Azure Monitor requires the installation of the Microsoft Monitoring Agent, or the MMA. Certain monitoring solutions also require a secondary agent. For example, Azure Monitor for VMs also needs on the Dependency agent for functionality that this solution provides.
Some solutions, like Azure Update Management, also depend on Azure Automation, which enables you to centrally manage resources across Azure and non-Azure environments. For example, Azure Update Management uses Azure Automation to schedule and orchestrate installation of updates across machines in your environment, centrally, from the Azure portal.
How does Windows Admin Center enable you to use Azure Monitor?
From within Windows Admin Center, you can enable two monitoring solutions:
- Azure Update Management (in the Updates tool)
- Azure Monitor for VMs (in the Server Manager connection page), also known as Virtual Machines insights
You can get started using Azure Monitor from either of these tools. If you've never used Azure Monitor before, Windows Admin Center automatically provisions a Log Analytics workspace (and Azure Automation account, if needed). Windows Admin Center also installs and configures the Microsoft Monitor Agent (MMA) on the target server, and installs the corresponding solution into the workspace.
For instance, if you first go to the Updates tool to set up Azure Update Management, Windows Admin Center will:
- Install the MMA on the machine
- Create the Log Analytics workspace and the Azure Automation account (since an Azure Automation account is necessary in this case)
- Install the Update Management solution in the newly created workspace.
If you want to add another monitoring solution from within Windows Admin Center on the same server, Windows Admin Center installs that solution into the existing workspace to which that server is connected. Windows Admin Center additionally installs any other necessary agents.
If you connect to a different server and have already setup a Log Analytics workspace, you can also install the Microsoft Monitor Agent on the server, connecting it up to an existing workspace. When you connect a server into a workspace, it automatically starts collecting data and reporting to solutions installed in that workspace.
Azure Monitor for virtual machines (also known as Virtual Machine insights)
When you set up Azure Monitor for VMs in the Server Manager connection page, Windows Admin Center enables the Azure Monitor for VMs solution, also known as Virtual Machine insights. This solution allows you to monitor server health and events, create email alerts, get a consolidated view of server performance across your environment, and visualize apps, systems, and services connected to a given server.
Note
Despite its name, VM insights works for physical servers as well as virtual machines.
You can try Azure Monitor using the free 5 GB of data/month/customer allowance. To learn more about log ingestion plans and pricing, see Azure Monitor pricing. The following sections show some of the benefits onboarding servers into Azure Monitor, for example having a consolidated view of systems performance across your environment.
Set up your server for use with Azure Monitor
From the Overview page of a server connection, go to Tools > Azure Monitor. Within the Azure Monitor page, onboard your server to Azure Monitor by selecting Register with Azure and sign in, once complete return to the same page, select Setup and follow the prompts. Windows Admin Center takes care of provisioning the Azure Log Analytics workspace, installing the necessary agent, and ensuring the VM insights solution is configured. Once complete, your server sends performance counter data to Azure Monitor, enabling you to view and create email alerts based on this server, from the Azure portal.
Create email alerts
Once you've attached your server to Azure Monitor, you can use the intelligent hyperlinks within the Tools > Azure Monitor, under Alerts and actions, select Configure monitoring and alerts from the Azure portal to create new alerts. Windows Admin Center automatically enables performance counters to be collected, so you can easily create new alerts by using one of the predefined queries or writing your own.
Consolidated view across multiple servers
If you onboard multiple servers to a single Log Analytics workspace within Azure Monitor, you can get a consolidated view of all these servers from the Virtual Machines Insights solution within Azure Monitor. Only the Performance and Maps tabs of Virtual Machines Insights for Azure Monitor works with on-premises servers – the health tab functions only with Azure VMs. To view the Performance and Maps tabs of Virtual Machines in the Azure portal, go to Azure Monitor > Virtual Machines (under Insights), and navigate to the Performance or Maps tabs.
Visualize apps, systems, and services connected to a given server
When Windows Admin Center onboards a server into the VM insights solution within Azure Monitor, it also lights up a capability called Service Map. This capability automatically discovers application components and maps the communication between services so that you can easily visualize connections between servers with great detail from the Azure portal. You can find the service map by going to the Azure portal > Azure Monitor > Virtual Machines (under Insights), and navigating to the Maps tab.
Note
The visualizations for Virtual Machines Insights for Azure Monitor are offered in 6 public regions currently. For the latest information, check the Azure Monitor for VMs documentation. You must deploy the Log Analytics workspace in one of the supported regions to get the additional benefits provided by the Virtual Machines Insights solution described previously.
Disabling monitoring
To completely disconnect your server from the Log Analytics workspace, uninstall the Microsoft Monitor Agent. With the agent uninstalled it means that this server no longer sends data to the workspace, and all the solutions installed in that workspace no longer collect and process data from that server. However, uninstalling the Microsoft Monitor Agent doesn't affect the workspace itself – all the resources reporting to that workspace continues to do so. To uninstall the Microsoft Monitoring Agent within Windows Admin Center, connect to the server and then go to Installed apps, find the Microsoft Monitor Agent, and then select Remove.
If you want to turn off a specific solution within a workspace, you need to remove the monitoring solution from the Azure portal. Removing a monitoring solution means that the insights created by that solution are no longer generated for any of the servers reporting to that workspace. For example, uninstalling the Azure Monitor for VMs solution mean you can no longer see insights about VM or server performance from any of the machines connected to my workspace.
Next steps
Feedback
Coming soon: Throughout 2024 we will be phasing out GitHub Issues as the feedback mechanism for content and replacing it with a new feedback system. For more information see: https://aka.ms/ContentUserFeedback.
Submit and view feedback for