Install and configure the Azure Diagnostics extension for Windows (WAD)
The Azure Diagnostics extension is an agent in Azure Monitor that collects monitoring data from the guest operating system and workloads of Azure virtual machines and other compute resources. This article provides information on how to install and configure the Azure Diagnostics extension for Windows and describes how the data is stored in an Azure Storage account.
The diagnostics extension is implemented as a virtual machine extension in Azure. It supports the same installation options by using Azure Resource Manager templates, PowerShell, and the Azure CLI. For information on how to install and maintain virtual machine extensions, see Virtual machine extensions and features for Windows.
Overview
When you configure the Azure Diagnostics extension for Windows, you must specify a storage account where all specified data will be sent. You can optionally add one or more data sinks to send the data to different locations:
- Azure Monitor sink: Send guest performance data to Azure Monitor Metrics.
- Azure Event Hub sink: Send guest performance and log data to event hubs to forward outside of Azure. This sink can't be configured in the Azure portal.
Install with Azure portal
You can install and configure the diagnostics extension on an individual virtual machine in the Azure portal. You'll work with an interface as opposed to working directly with the configuration. When you enable the diagnostics extension, it will automatically use a default configuration with the most common performance counters and events. You can modify this default configuration according to your specific requirements.
Note
The following steps describe the most common settings for the diagnostics extension. For more information on all the configuration options, see Windows diagnostics extension schema.
Open the menu for a virtual machine in the Azure portal.
Select Diagnostic settings in the Monitoring section of the VM menu.
Select Enable guest-level monitoring if the diagnostics extension hasn't already been enabled.

A new Azure Storage account will be created for the VM. The name will be based on the name of the resource group for the VM. A default set of guest performance counters and logs will be selected.

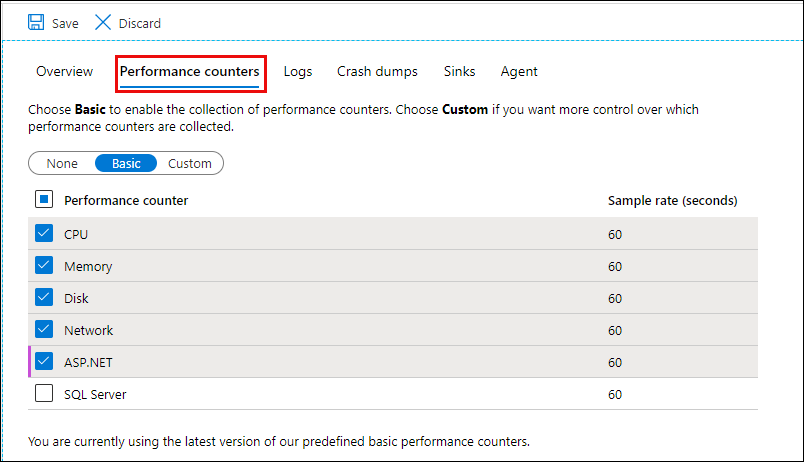
On the Performance counters tab, select the guest metrics you want to collect from this virtual machine. Use the Custom setting for more advanced selection.
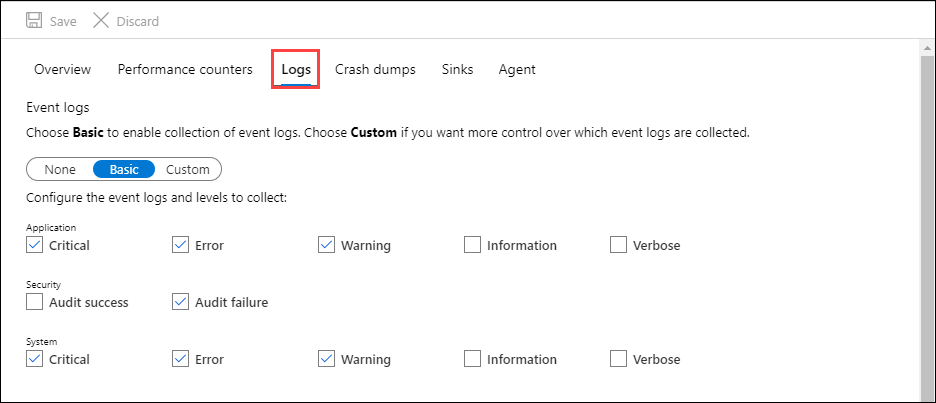
On the Logs tab, select the logs to collect from the virtual machine. Logs can be sent to storage or event hubs, but not to Azure Monitor. Use the Log Analytics agent to collect guest logs to Azure Monitor.
On the Crash dumps tab, specify any processes to collect memory dumps after a crash. The data will be written to the storage account for the diagnostic setting. You can optionally specify a blob container.

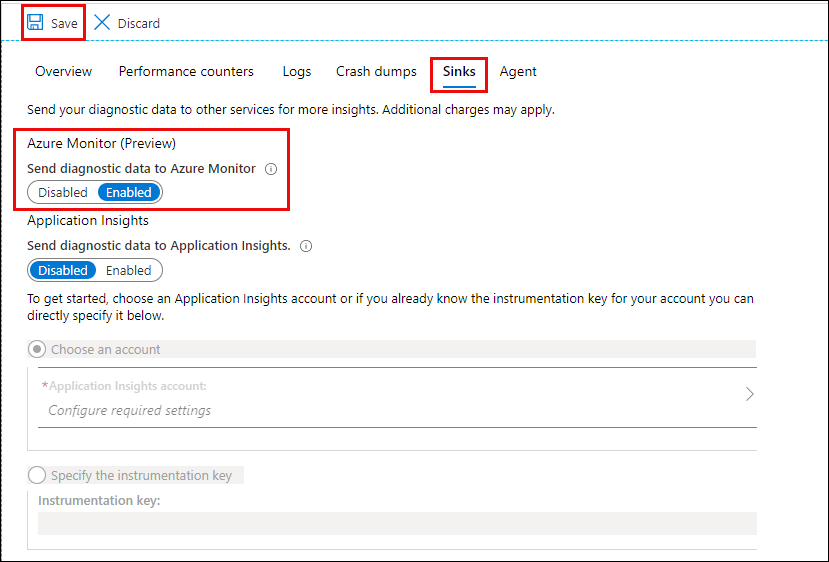
On the Sinks tab, specify whether to send the data to locations other than Azure storage. If you select Azure Monitor, guest performance data will be sent to Azure Monitor Metrics. You can't configure the event hubs sink by using the Azure portal.
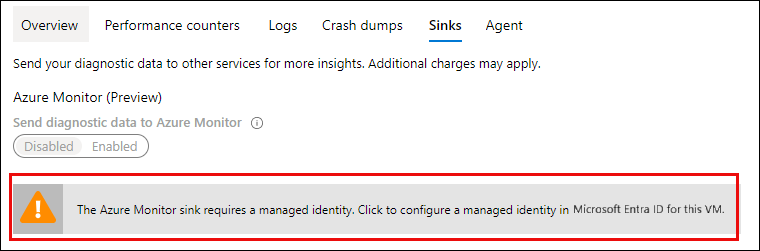
If you haven't enabled a system-assigned identity configured for your virtual machine, you might see the following warning when you save a configuration with the Azure Monitor sink. Select the banner to enable the system-assigned identity.
On the Agent tab, you can change the storage account, set the disk quota, and specify whether to collect diagnostic infrastructure logs.

Select Save to save the configuration.


Note
The configuration for the diagnostics extension can be formatted in either JSON or XML, but any configuration done in the Azure portal will always be stored as JSON. If you use XML with another configuration method and then change your configuration with the Azure portal, the settings will be changed to JSON. Also, there's no option to set up the retention period for these logs.
Resource Manager template
For information on how to deploy the diagnostics extension with Azure Resource Manager templates, see Use monitoring and diagnostics with a Windows VM and Azure Resource Manager templates.
Azure CLI deployment
The Azure CLI can be used to deploy the Azure Diagnostics extension to an existing virtual machine by using az vm extension set as in the following example:
az vm extension set \
  --resource-group myResourceGroup \
  --vm-name myVM \
  --name IaaSDiagnostics \
  --publisher Microsoft.Azure.Diagnostics \
  --protected-settings protected-settings.json \
  --settings public-settings.json
The protected settings are defined in the PrivateConfig element of the configuration schema. The following minimal example of a protected settings file defines the storage account. For complete details of the private settings, see Example configuration.
{
    "storageAccountName": "mystorageaccount",
    "storageAccountKey": "xxxxxxxxxxxxxxxxxxxxxxxxxxxxxxxxxxx",
    "storageAccountEndPoint": "https://core.windows.net"
}
The public settings are defined in the Public element of the configuration schema. The following minimal example of a public settings file enables collection of diagnostic infrastructure logs, a single performance counter, and a single event log. For complete details of the public settings, see Example configuration.
{
  "StorageAccount": "mystorageaccount",
  "WadCfg": {
    "DiagnosticMonitorConfiguration": {
      "overallQuotaInMB": 5120,
      "PerformanceCounters": {
        "scheduledTransferPeriod": "PT1M",
        "PerformanceCounterConfiguration": [
          {
            "counterSpecifier": "\\Processor Information(_Total)\\% Processor Time",
            "unit": "Percent",
            "sampleRate": "PT60S"
          }
        ]
      },
      "WindowsEventLog": {
        "scheduledTransferPeriod": "PT1M",
        "DataSource": [
          {
            "name": "Application!*[System[(Level=1 or Level=2 or Level=3)]]"
          }
        ]
      }
    }
  }
}
PowerShell deployment
PowerShell can be used to deploy the Azure Diagnostics extension to an existing virtual machine by using Set-AzVMDiagnosticsExtension, as in the following example:
Set-AzVMDiagnosticsExtension -ResourceGroupName "myvmresourcegroup" `
  -VMName "myvm" `
  -DiagnosticsConfigurationPath "DiagnosticsConfiguration.json"
The private settings are defined in the PrivateConfig element. The public settings are defined in the Public element of the configuration schema. You can also choose to specify the details of the storage account as parameters of the Set-AzVMDiagnosticsExtension cmdlet rather than including them in the private settings.
The following minimal example of a configuration file enables collection of diagnostic infrastructure logs, a single performance counter, and a single event log. For complete details of the private and public settings, see Example configuration.
{
    "PublicConfig": {
        "WadCfg": {
            "DiagnosticMonitorConfiguration": {
                "overallQuotaInMB": 10000,
                "DiagnosticInfrastructureLogs": {
                    "scheduledTransferLogLevelFilter": "Error"
                },
                "PerformanceCounters": {
                    "scheduledTransferPeriod": "PT1M",
                    "PerformanceCounterConfiguration": [
                        {
                            "counterSpecifier": "\\Processor(_Total)\\% Processor Time",
                            "sampleRate": "PT3M",
                            "unit": "percent"
                        }
                    ]
                },
                "WindowsEventLog": {
                    "scheduledTransferPeriod": "PT1M",
                        "DataSource": [
                        {
                            "name": "Application!*[System[(Level=1 or Level=2 or Level=3)]]"
                        }
                    ]
                }
            }
        },
        "StorageAccount": "mystorageaccount",
        "StorageType": "TableAndBlob"
    },
    "PrivateConfig": {
        "storageAccountName": "mystorageaccount",
        "storageAccountKey": "xxxxxxxxxxxxxxxxxxxxxxxxxxxxxxxxxxx",
        "storageAccountEndPoint": "https://core.windows.net"
    }
}
See also Use PowerShell to enable Azure Diagnostics in a virtual machine running Windows.
Data storage
The following table lists the different types of data collected from the diagnostics extension and whether they're stored as a table or a blob. The data stored in tables can also be stored in blobs depending on the StorageType setting in your public configuration.
| Data | Storage type | Description |
|---|---|---|
| WADDiagnosticInfrastructureLogsTable | Table | Diagnostic monitor and configuration changes. |
| WADDirectoriesTable | Table | Directories that the diagnostic monitor is monitoring. This group includes IIS logs, IIS failed request logs, and custom directories. The location of the blob log file is specified in the Container field and the name of the blob is in the RelativePath field. The AbsolutePath field indicates the location and name of the file as it existed on the Azure virtual machine. |
| WadLogsTable | Table | Logs written in code by using the trace listener. |
| WADPerformanceCountersTable | Table | Performance counters. |
| WADWindowsEventLogsTable | Table | Windows Event logs. |
| wad-iis-failedreqlogfiles | Blob | Contains information from IIS Failed Request logs. |
| wad-iis-logfiles | Blob | Contains information about IIS logs. |
| "custom" | Blob | A custom container based on configuring directories that are monitored by the diagnostic monitor. The name of this blob container will be specified in WADDirectoriesTable. |
Tools to view diagnostic data
Several tools are available to view the data after it's transferred to storage. For example:
- Server Explorer in Visual Studio: If you've installed the Azure Tools for Microsoft Visual Studio, you can use the Azure Storage node in Server Explorer to view read-only blob and table data from your Azure Storage accounts. You can display data from your local storage emulator account and from storage accounts you've created for Azure. For more information, see Browsing and managing storage resources with Server Explorer.
- Microsoft Azure Storage Explorer: This standalone app enables you to easily work with Azure Storage data on Windows, OSX, and Linux.
- Azure Management Studio: This tool includes Azure Diagnostics Manager. Use it to view, download, and manage the diagnostics data collected by the applications running on Azure.
Next steps
For information on forwarding monitoring data to Azure Event Hubs, see Send data from Azure Diagnostics extension to Event Hubs.
Feedback
Coming soon: Throughout 2024 we will be phasing out GitHub Issues as the feedback mechanism for content and replacing it with a new feedback system. For more information see: https://aka.ms/ContentUserFeedback.
Submit and view feedback for