Manage Azure Monitor Workbooks
This article describes how to manage Azure Workbooks in the Azure portal.
Save a workbook
Workbooks are shared resources. They require write access to the parent resource group to be saved.
- In the Azure portal, select the workbook.
- Select Save.
- Enter the title, subscription, resource group, and location.
- Select Save.
By default, the workbook is auto-filled with the same settings, subscription and resource group as the LA workspace. By default, workbooks are saved to 'My Reports' and are only accessible by the individual user. You can also save the workbook directly to shared reports or share the workbook.
Share a workbook
When you want to share a workbook or template, keep in mind that the person you want to share with must have permissions to access the workbook. They must have an Azure account, and Monitoring Reader permissions. To share a workbook or workbook template:
- In the Azure portal, select Monitor, and then select Workbooks from the left pane.
- Select the checkbox next to the workbook or template you want to share.
- Select the Share icon from the top toolbar.
- The Share workbook or Share template window opens with a URL to use for sharing the workbook.
- Copy the link to share the workbook, or select Share link via email to open your default mail app.

Delete a workbook
- In the Azure portal, select Monitor, and then select Workbooks from the left pane.
- Select the checkbox next to the Workbook you want to delete.
- Select Delete from the top toolbar.
Recover a deleted workbook
When you delete an Azure Workbook, it is soft-deleted and can be recovered by contacting support. After the soft-delete period, the workbook and its content are nonrecoverable and queued for purge completely within 30 days.
Note
Workbooks that were saved using bring your own storage cannot be recovered by support. You may be able to recover the workbook content from the storage account if the storage account used has enabled soft delete.
Set up Auto refresh
- In the Azure portal, select the workbook.
- Select Auto refresh, and then to select from a list of intervals for the auto-refresh. The workbook will start refreshing after the selected time interval.
- Auto refresh only applies when the workbook is in read mode. If a user sets an interval of 5 minutes and after 4 minutes switches to edit mode, refreshing doesn't occur if the user is still in edit mode. But if the user returns to read mode, the interval of 5 minutes resets and the workbook will be refreshed after 5 minutes.
- Selecting Auto refresh in read mode also resets the interval. If a user sets the interval to 5 minutes and after 3 minutes the user selects Auto refresh to manually refresh the workbook, the Auto refresh interval resets and the workbook will be auto-refreshed after 5 minutes.
- The Auto refresh setting isn't saved with the workbook. Every time a user opens a workbook, Auto refresh is Off and needs to be set again.
- Switching workbooks and going out of the gallery clears the Auto refresh interval.


Manage workbook resources
In the Resources section of the Settings tab, you can manage the resources in your workbook.
- The workbook is saved in the resource marked as the Owner. When you browse workbooks, this is the location of the workbooks and templates you see when browsing. Select Browse across galleries to see the workbooks for all your resources.
- The owner resource can't be removed.
- Select Add Resources to add a default resource.
- Select Remove Selected Resources to remove resources by selecting a resource or several resources.
- When you're finished adding and removing resources, select Apply Changes.
Manage workbook versions

The versions tab contains a list of all the available versions of this workbook. Select a version and use the toolbar to compare, view, or restore versions. Previous workbook versions are available for 90 days.
- Compare: Compares the JSON of the previous workbook to the most recently saved version.
- View: Opens the selected version of the workbook in a context pane.
- Restore: Saves a new copy of the workbook with the contents of the selected version and overwrites any existing current content. You're prompted to confirm this action.
Compare versions

Note
Version history isn't available for bring-your-own-storage workbooks.
Manage workbook styles
On this tab, you can set a padding and spacing style for the whole workbook. The possible options are Wide, Standard, Narrow, and None. The default style setting is Standard.
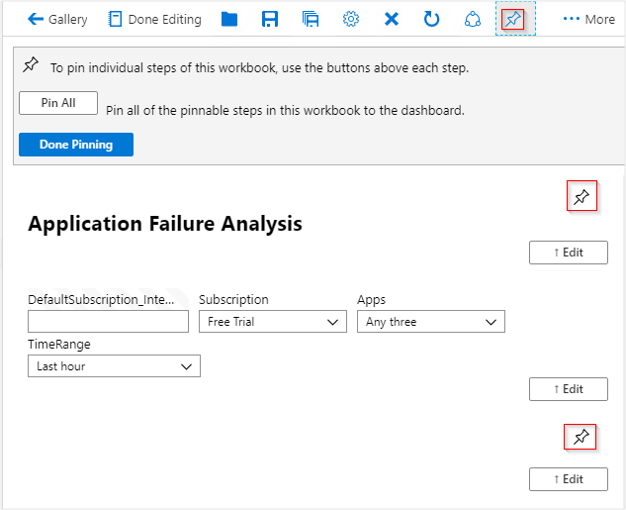
Pinning workbooks
You can pin text, query, or metrics components in a workbook by using the Pin button on those items while the workbook is in pin mode. Or you can use the Pin button if the workbook author enabled settings for that element to make it visible.
While in pin mode, you can select Pin Workbook to pin a component from this workbook to a dashboard. Select Link to Workbook to pin a static link to this workbook on your dashboard. You can choose a specific component in your workbook to pin.
To access pin mode, select Edit to enter editing mode. Select Pin on the top bar. An individual Pin then appears above each corresponding workbook part's Edit button on the right side of the screen.
Note
The state of the workbook is saved at the time of the pin. Pinned workbooks on a dashboard won't update if the underlying workbook is modified. To update a pinned workbook part, you must delete and re-pin that part.
Time ranges for pinned queries
Pinned workbook query parts respect the dashboard's time range if the pinned item is configured to use a TimeRange parameter. The dashboard's time range value is used as the time range parameter's value. Any change of the dashboard time range causes the pinned item to update. If a pinned part is using the dashboard's time range, the subtitle of the pinned part updates to show the dashboard's time range whenever the time range changes.
Pinned workbook parts using a time range parameter auto-refresh at a rate determined by the dashboard's time range. The last time the query ran appears in the subtitle of the pinned part.
If a pinned component has an explicitly set time range and doesn't use a time range parameter, that time range is always used for the dashboard, regardless of the dashboard's settings. The subtitle of the pinned part doesn't show the dashboard's time range. The query doesn't auto-refresh on the dashboard. The subtitle shows the last time the query executed.
Note
Queries that use the merge data source aren't currently supported when pinning to dashboards.
Enable Trusted hosts
Enable a trusted source or mark this workbook as trusted in this browser.
| Control | Definition |
|---|---|
| Mark workbook as trusted | If enabled, this workbook can call any endpoint, whether the host is marked as trusted or not. A workbook is trusted if it's a new workbook, an existing workbook that's saved, or is explicitly marked as a trusted workbook. |
| URL grid | A grid to explicitly add trusted hosts. |
Feedback
Coming soon: Throughout 2024 we will be phasing out GitHub Issues as the feedback mechanism for content and replacing it with a new feedback system. For more information see: https://aka.ms/ContentUserFeedback.
Submit and view feedback for