Data integration using Azure Data Factory and Azure Data Share
APPLIES TO:  Azure Data Factory
Azure Synapse Analytics
Azure Data Factory
Azure Synapse Analytics
Tip
Try out Data Factory in Microsoft Fabric, an all-in-one analytics solution for enterprises. Microsoft Fabric covers everything from data movement to data science, real-time analytics, business intelligence, and reporting. Learn how to start a new trial for free!
As customers embark on their modern data warehouse and analytics projects, they require not only more data but also more visibility into their data across their data estate. This workshop dives into how improvements to Azure Data Factory and Azure Data Share simplify data integration and management in Azure.
From enabling code-free ETL/ELT to creating a comprehensive view over your data, improvements in Azure Data Factory empower your data engineers to confidently bring in more data, and thus more value, to your enterprise. Azure Data Share allows you to do business to business sharing in a governed manner.
In this workshop, you'll use Azure Data Factory (ADF) to ingest data from Azure SQL Database into Azure Data Lake Storage Gen2 (ADLS Gen2). Once you land the data in the lake, you'll transform it via mapping data flows, data factory's native transformation service, and sink it into Azure Synapse Analytics. Then, you'll share the table with transformed data along with some additional data using Azure Data Share.
The data used in this lab is New York City taxi data. To import it into your database in SQL Database, download the taxi-data bacpac file. Select the Download raw file option in GitHub.
Prerequisites
Azure subscription: If you don't have an Azure subscription, create a free account before you begin.
Azure SQL Database: If you don't have an Azure SQL Database, learn how to create a SQL Database.
Azure Data Lake Storage Gen2 storage account: If you don't have an ADLS Gen2 storage account, learn how to create an ADLS Gen2 storage account.
Azure Synapse Analytics: If you don't have an Azure Synapse Analytics workspace, learn how to get started with Azure Synapse Analytics.
Azure Data Factory: If you haven't created a data factory, see how to create a data factory.
Azure Data Share: If you haven't created a data share, see how to create a data share.
Set up your Azure Data Factory environment
In this section, you learn how to access the Azure Data Factory user experience (ADF UX) from the Azure portal. Once in the ADF UX, you'll configure three linked service for each of the data stores we are using: Azure SQL Database, ADLS Gen2, and Azure Synapse Analytics.
In Azure Data Factory linked services, define the connection information to external resources. Azure Data Factory currently supports over 85 connectors.
Open the Azure Data Factory UX
Open the Azure portal in either Microsoft Edge or Google Chrome.
Using the search bar at the top of the page, search for 'Data Factories'.
Select your data factory resource to open up its resources on the left hand pane.

Select Open Azure Data Factory Studio. The Data Factory Studio can also be accessed directly at adf.azure.com.
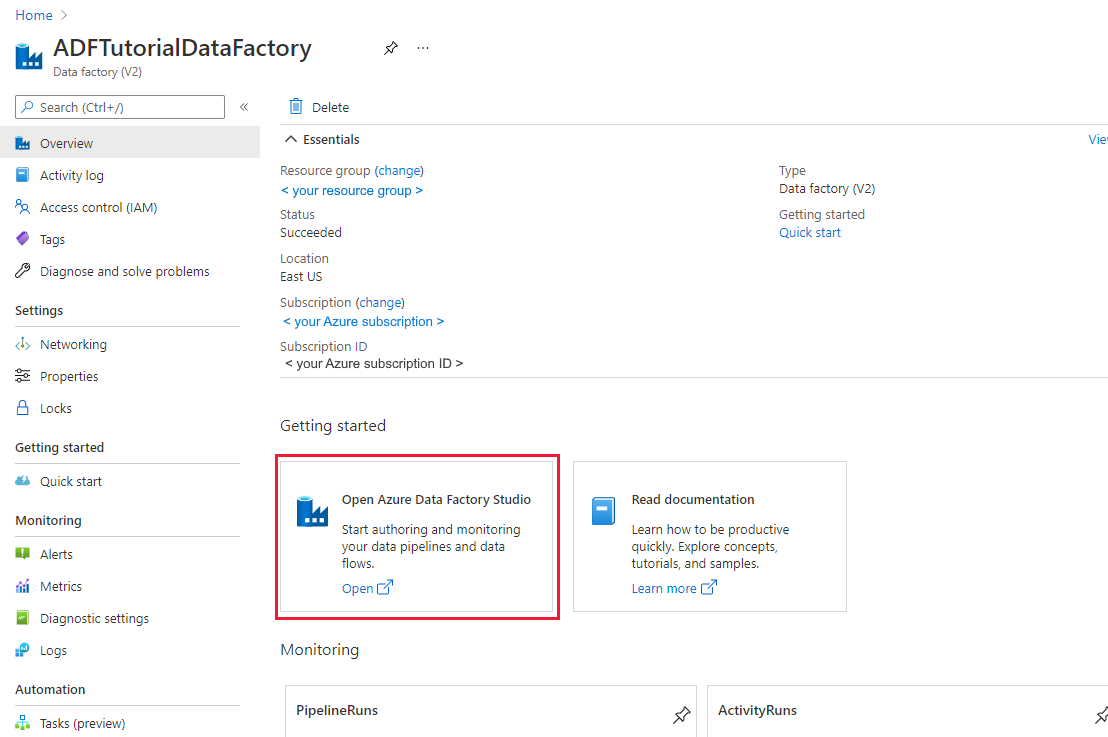
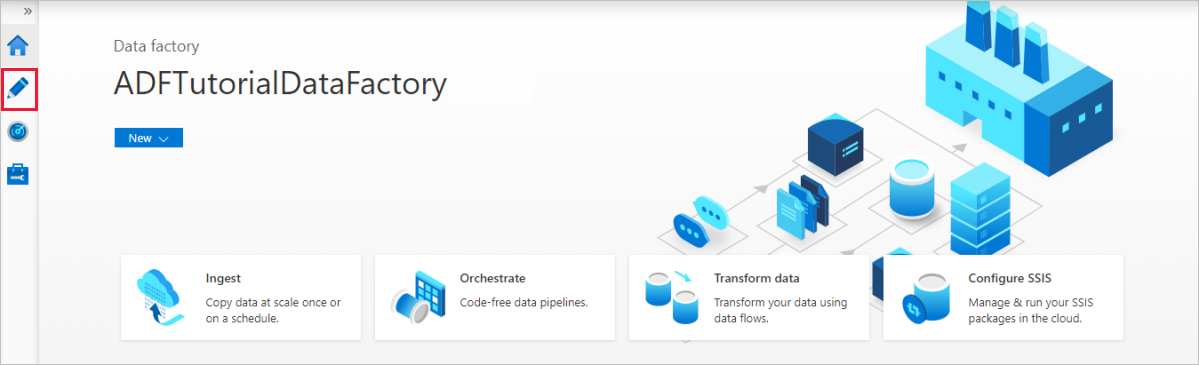
You are redirected to the homepage of ADF in the Azure portal. This page contains quick-starts, instructional videos, and links to tutorials to learn data factory concepts. To start authoring, select the pencil icon in left side-bar.


Create an Azure SQL Database linked service
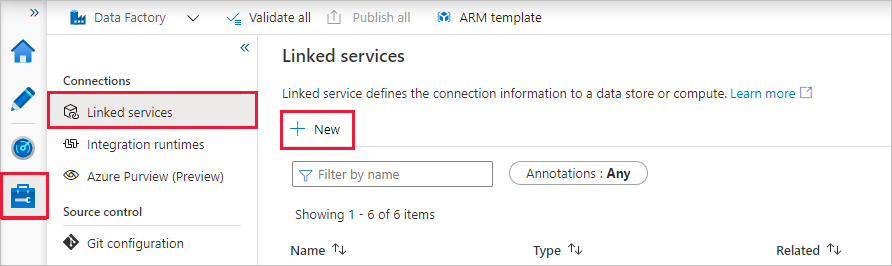
To create a linked service, select Manage hub in the left side-bar, on the Connections pane, select Linked services and then select New to add a new linked service.
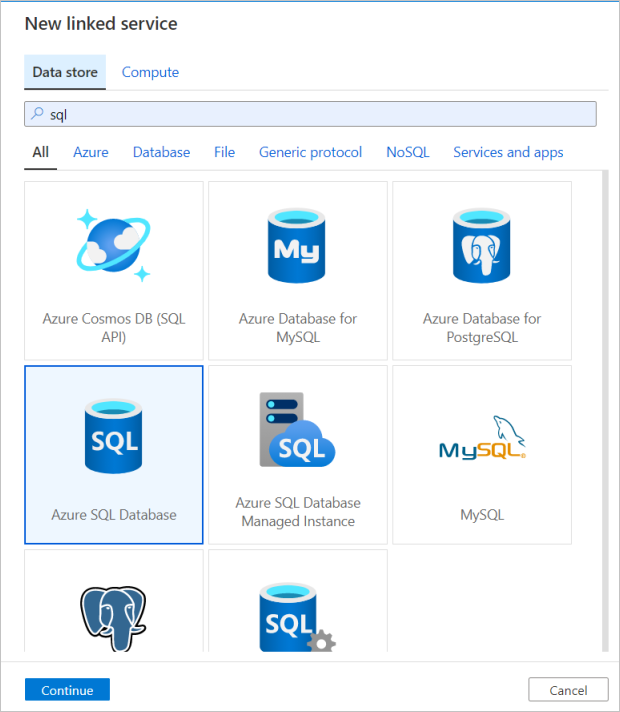
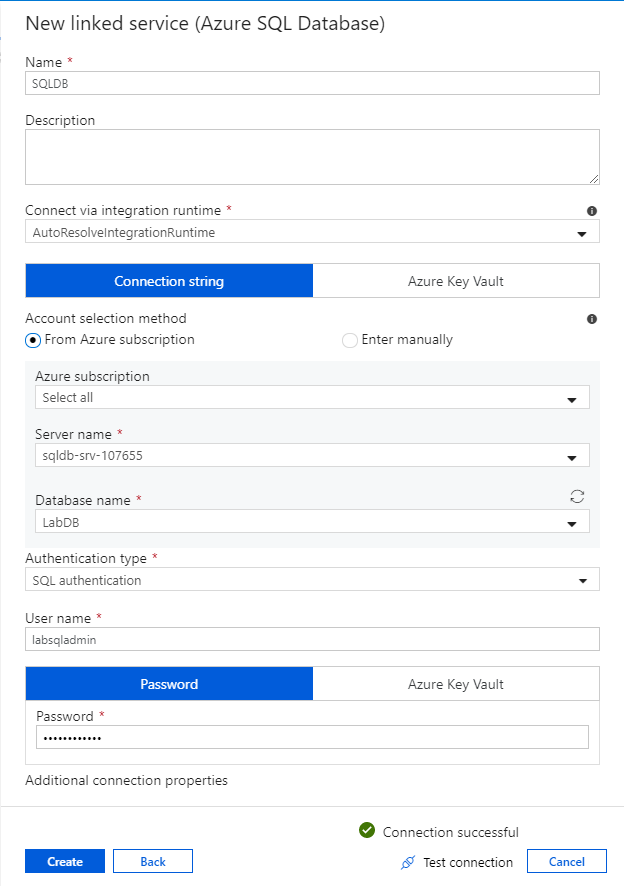
The first linked service you configure is an Azure SQL Database. You can use the search bar to filter the data store list. Select on the Azure SQL Database tile and select continue.
In the SQL Database configuration pane, enter 'SQLDB' as your linked service name. Enter in your credentials to allow data factory to connect to your database. If you're using SQL authentication, enter in the server name, the database, your user name and password. You can verify your connection information is correct by selecting Test connection. Select Create when finished.

Create an Azure Synapse Analytics linked service
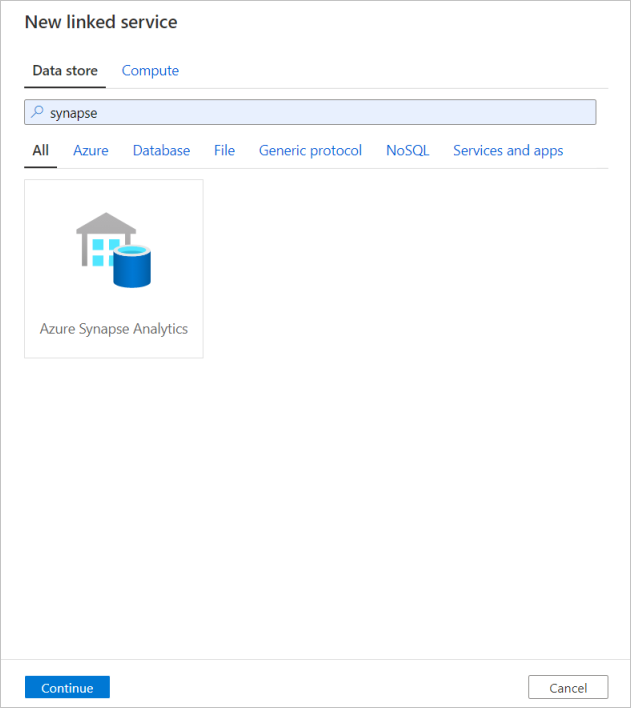
Repeat the same process to add an Azure Synapse Analytics linked service. In the connections tab, select New. Select the Azure Synapse Analytics tile and select continue.
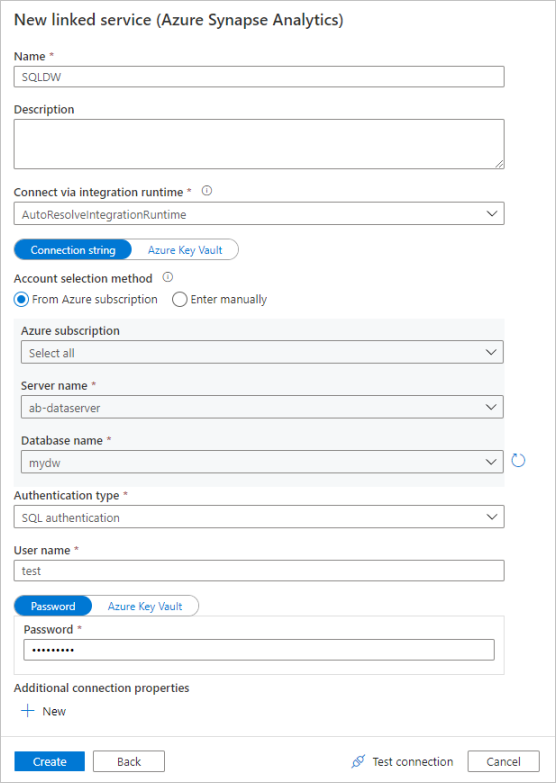
In the linked service configuration pane, enter `SQLDW`` as your linked service name. Enter in your credentials to allow data factory to connect to your database. If you're using SQL authentication, enter in the server name, the database, your user name and password. You can verify your connection information is correct by selecting Test connection. Select Create when finished.
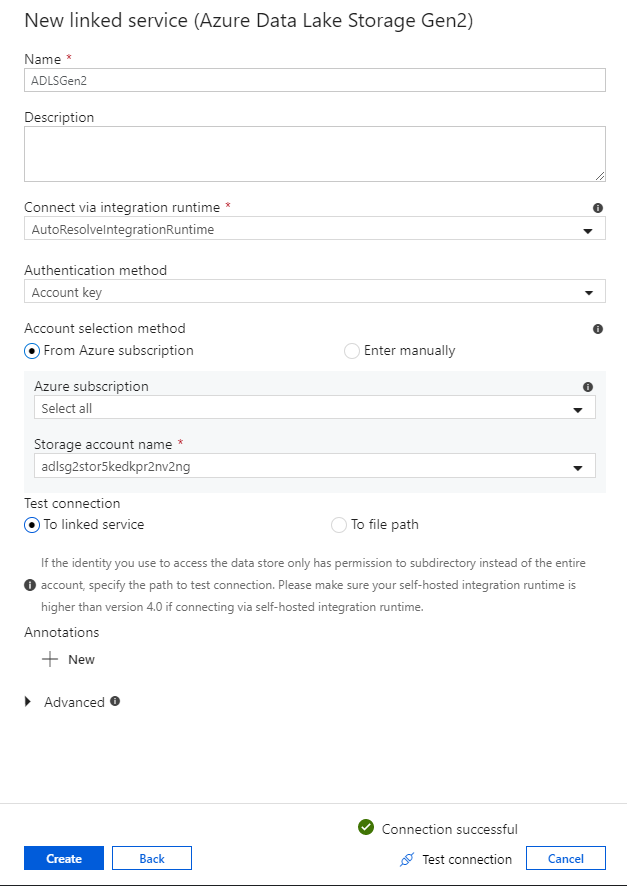
Create an Azure Data Lake Storage Gen2 linked service
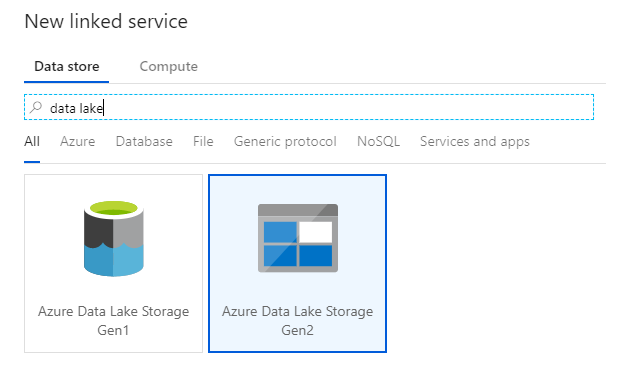
The last linked service needed for this lab is an Azure Data Lake Storage Gen2. In the connections tab, select New. Select the Azure Data Lake Storage Gen2 tile and select continue.
In the linked service configuration pane, enter 'ADLSGen2' as your linked service name. If you're using Account key authentication, select your ADLS Gen2 storage account from the Storage account name dropdown list. You can verify your connection information is correct by selecting Test connection. Select Create when finished.
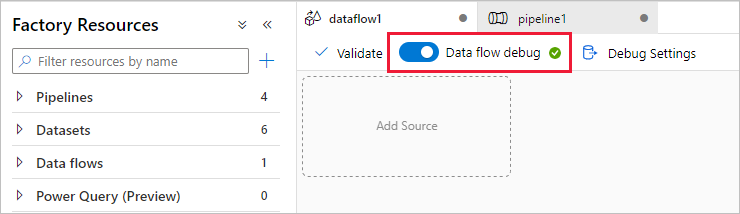
Turn on data flow debug mode
In section Transform data using mapping data flow, you are building mapping data flows. A best practice before building mapping data flows is to turn on debug mode, which allows you to test transformation logic in seconds on an active spark cluster.
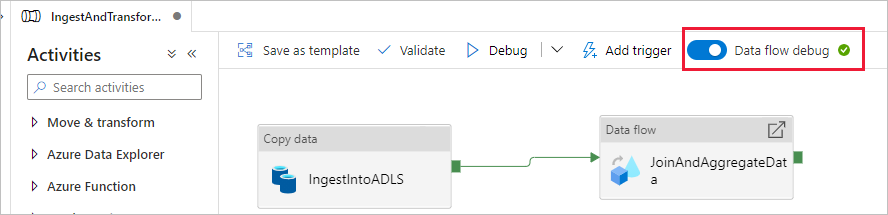
To turn on debug, select the Data flow debug slider in the top bar of data flow canvas or pipeline canvas when you have Data flow activities. Select OK when the confirmation dialog is shown. The cluster starts up in about 5 to 7 minutes. Continue on to Ingest data from Azure SQL Database into ADLS Gen2 using the copy activity while it is initializing.

Ingest data using the copy activity
In this section, you create a pipeline with a copy activity that ingests one table from an Azure SQL Database into an ADLS Gen2 storage account. You learn how to add a pipeline, configure a dataset and debug a pipeline via the ADF UX. The configuration pattern used in this section can be applied to copying from a relational data store to a file-based data store.
In Azure Data Factory, a pipeline is a logical grouping of activities that together perform a task. An activity defines an operation to perform on your data. A dataset points to the data you wish to use in a linked service.
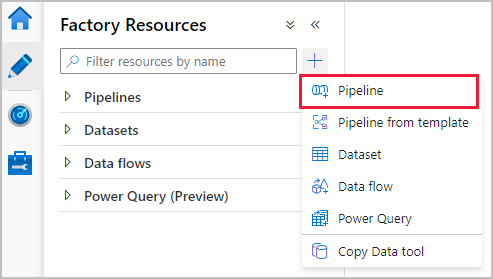
Create a pipeline with a copy activity
In the factory resources pane, select on the plus icon to open the new resource menu. Select Pipeline.
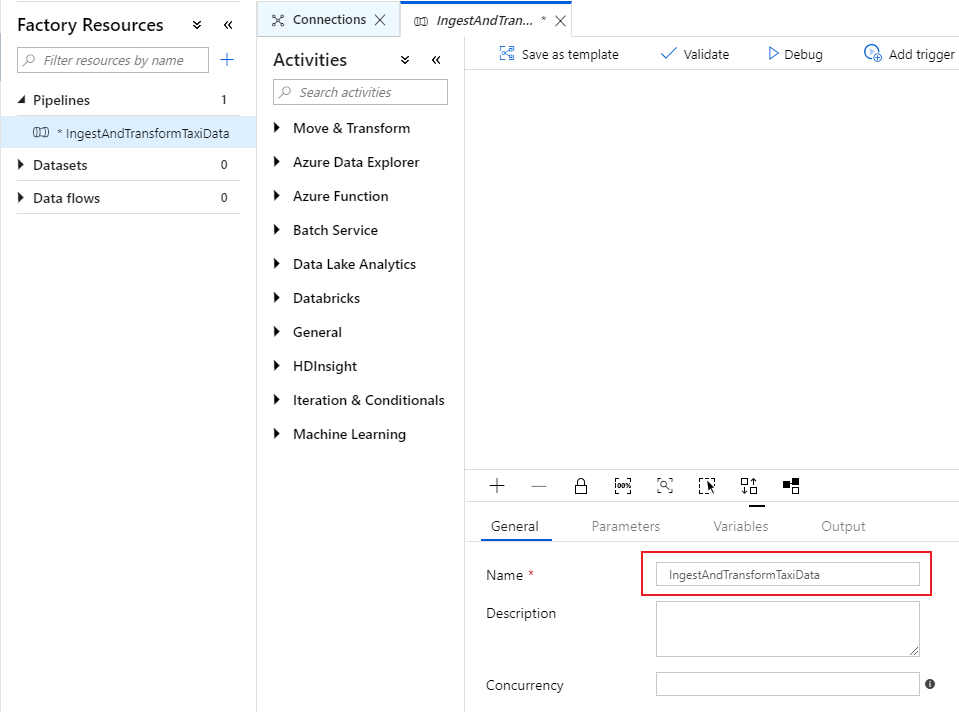
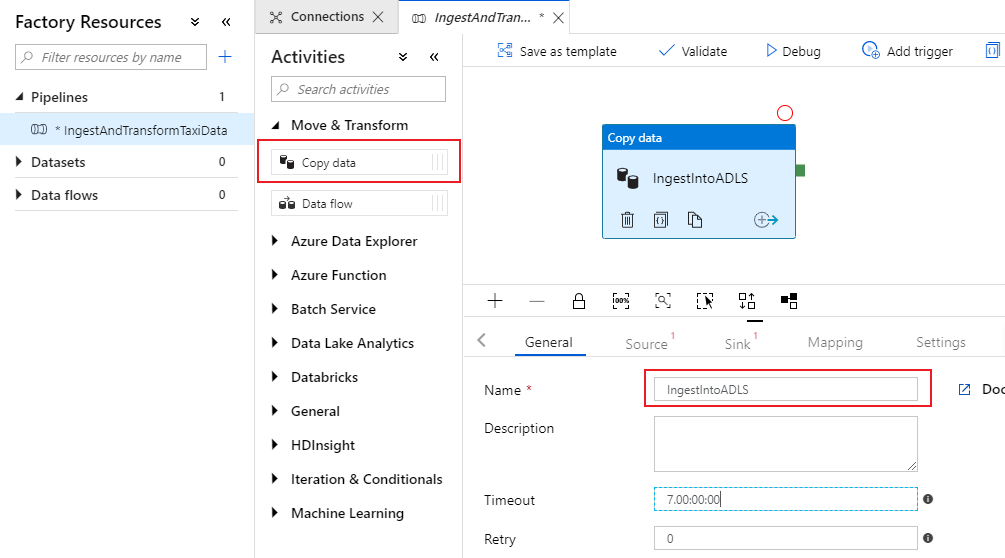
In the General tab of the pipeline canvas, name your pipeline something descriptive such as 'IngestAndTransformTaxiData'.
In the activities pane of the pipeline canvas, open the Move and Transform accordion and drag the Copy data activity onto the canvas. Give the copy activity a descriptive name such as 'IngestIntoADLS'.


Configure Azure SQL DB source dataset
Select on the Source tab of the copy activity. To create a new dataset, select New. Your source will be the table
dbo.TripDatalocated in the linked service 'SQLDB' configured earlier.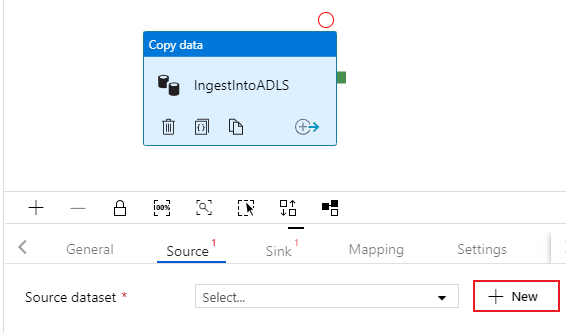
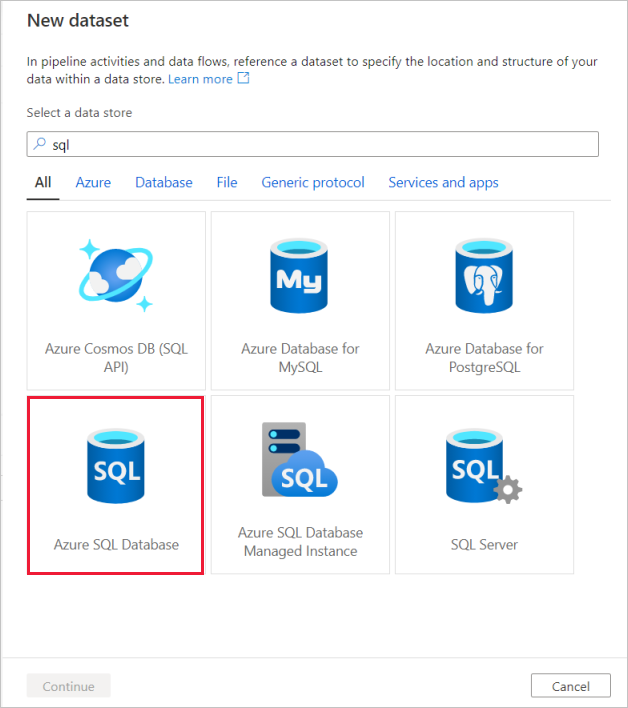
Search for Azure SQL Database and select continue.
Call your dataset 'TripData'. Select 'SQLDB' as your linked service. Select table name
dbo.TripDatafrom the table name dropdown list. Import the schema From connection/store. Select OK when finished.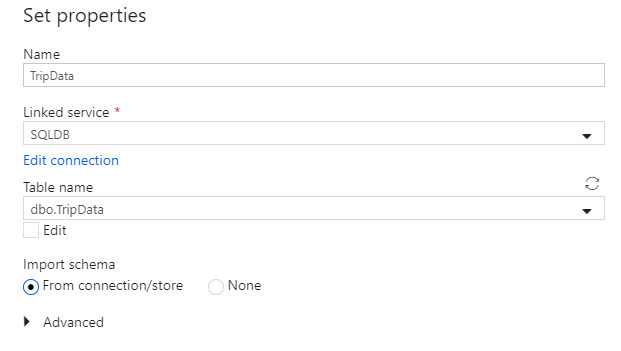
You have successfully created your source dataset. Make sure in the source settings, the default value Table is selected in the use query field.
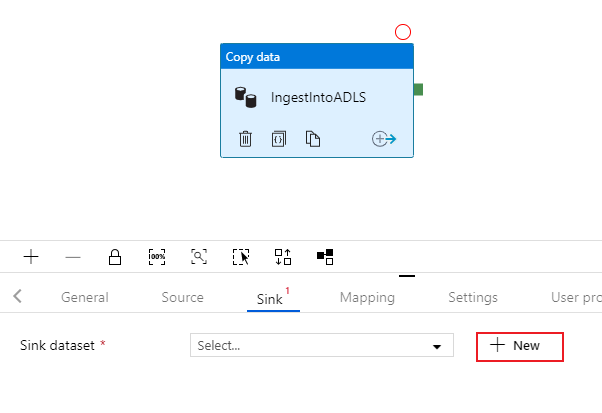
Configure ADLS Gen2 sink dataset
Select on the Sink tab of the copy activity. To create a new dataset, select New.
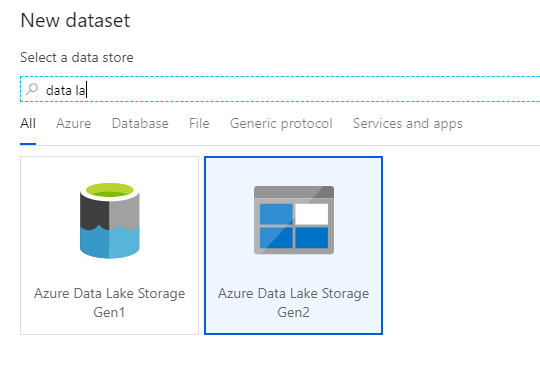
Search for Azure Data Lake Storage Gen2 and select continue.
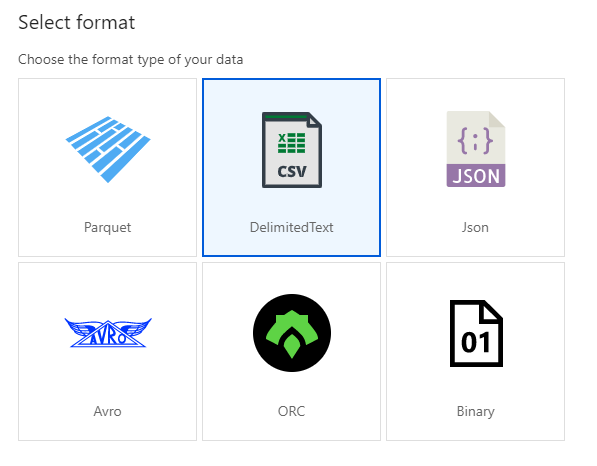
In the select format pane, select DelimitedText as you're writing to a csv file. Select continue.
Name your sink dataset 'TripDataCSV'. Select 'ADLSGen2' as your linked service. Enter where you want to write your csv file. For example, you can write your data to file
trip-data.csvin containerstaging-container. Set First row as header to true as you want your output data to have headers. Since no file exists in the destination yet, set Import schema to None. Select OK when finished.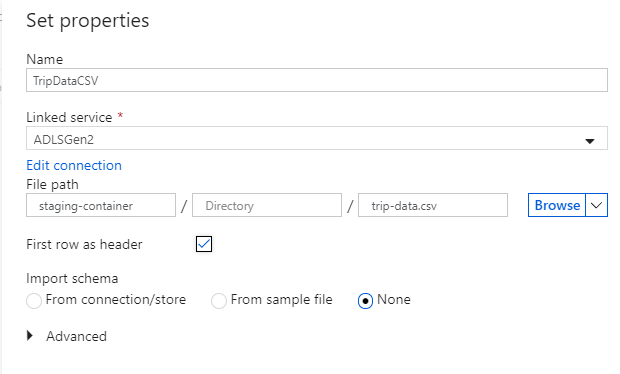
Test the copy activity with a pipeline debug run
To verify your copy activity is working correctly, select Debug at the top of the pipeline canvas to execute a debug run. A debug run allows you to test your pipeline either end-to-end or until a breakpoint before publishing it to the data factory service.

To monitor your debug run, go to the Output tab of the pipeline canvas. The monitoring screen autorefreshes every 20 seconds or when you manually select the refresh button. The copy activity has a special monitoring view, which can be access by selecting the eye-glasses icon in the Actions column.
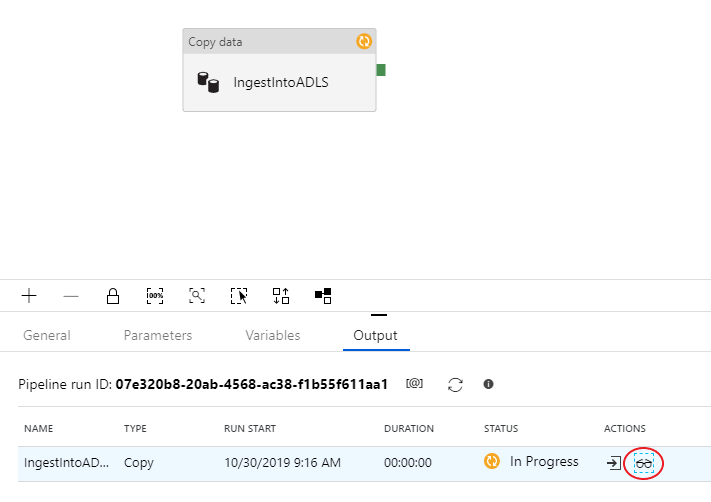
The copy monitoring view gives the activity's execution details and performance characteristics. You can see information such as data read/written, rows read/written, files read/written, and throughput. If you configured everything correctly, you should see 49,999 rows written into one file in your ADLS sink.

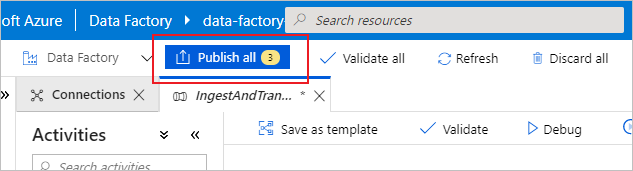
Before moving on to the next section, it's suggested that you publish your changes to the data factory service by selecting Publish all in the factory top bar. While not covered in this lab, Azure Data Factory supports full git integration. Git integration allows for version control, iterative saving in a repository, and collaboration on a data factory. For more information, see source control in Azure Data Factory.


Transform data using mapping data flow
Now that you have successfully copied data into Azure Data Lake Storage, it is time to join and aggregate that data into a data warehouse. We use the mapping data flow, Azure Data Factory's visually designed transformation service. Mapping data flows allow users to develop transformation logic code-free and execute them on spark clusters managed by the ADF service.
The data flow created in this step inner joins the 'TripDataCSV' dataset created in the previous section with a table dbo.TripFares stored in 'SQLDB' based on four key columns. Then the data gets aggregated based upon column payment_type to calculate the average of certain fields and written in an Azure Synapse Analytics table.
Add a data flow activity to your pipeline
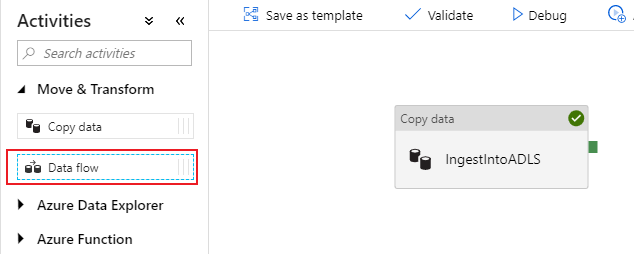
In the activities pane of the pipeline canvas, open the Move and Transform accordion and drag the Data flow activity onto the canvas.
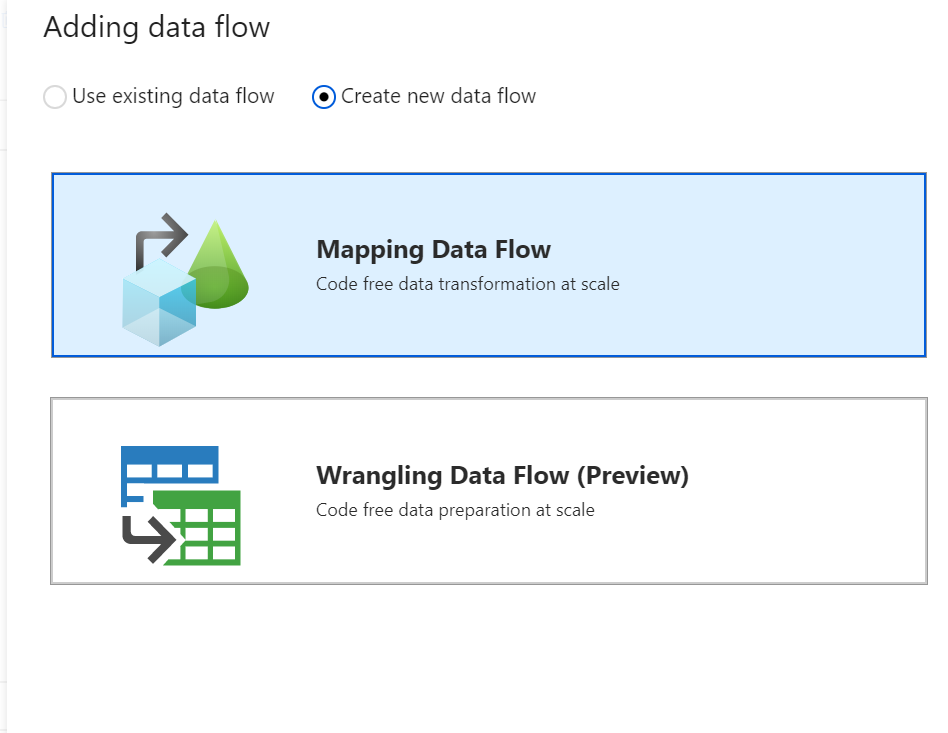
In the side pane that opens, select Create new data flow and choose Mapping data flow. Select OK.
You are directed to the data flow canvas where you'll be building your transformation logic. In the general tab, name your data flow 'JoinAndAggregateData'.
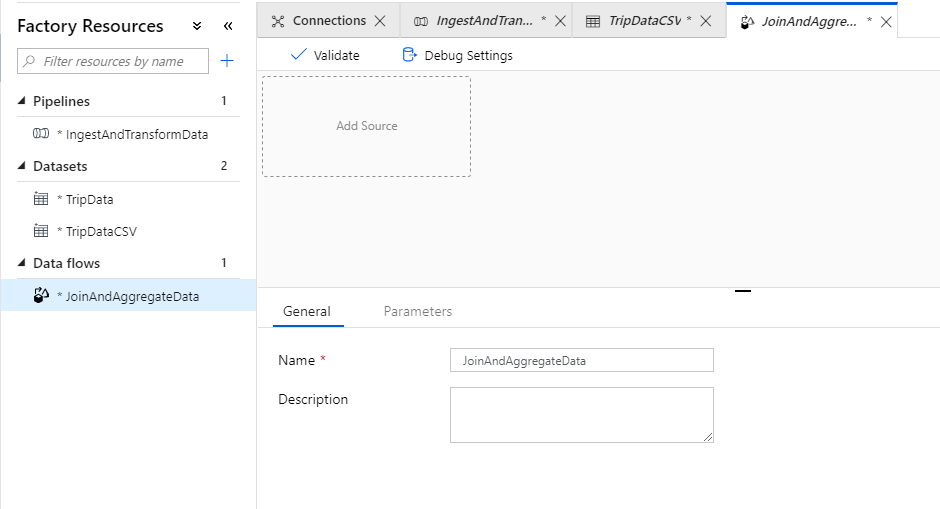


Configure your trip data CSV source
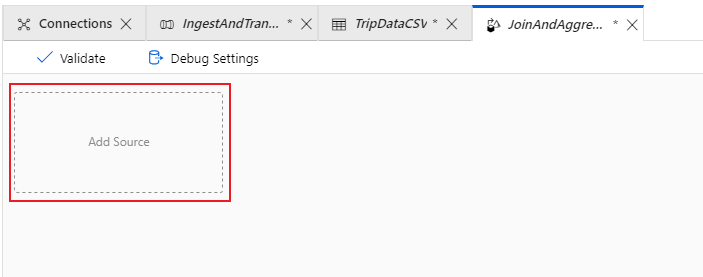
The first thing you want to do is configure your two source transformations. The first source points to the 'TripDataCSV' DelimitedText dataset. To add a source transformation, select on the Add Source box in the canvas.
Name your source 'TripDataCSV' and select the 'TripDataCSV' dataset from the source dropdown list. If you remember, you didn't import a schema initially when creating this dataset as there was no data there. Since
trip-data.csvexists now, select Edit to go to the dataset settings tab.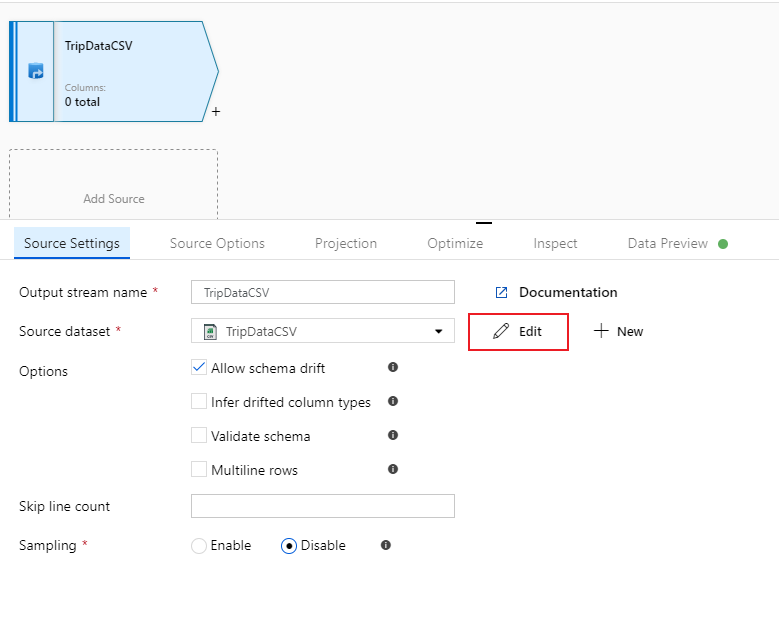
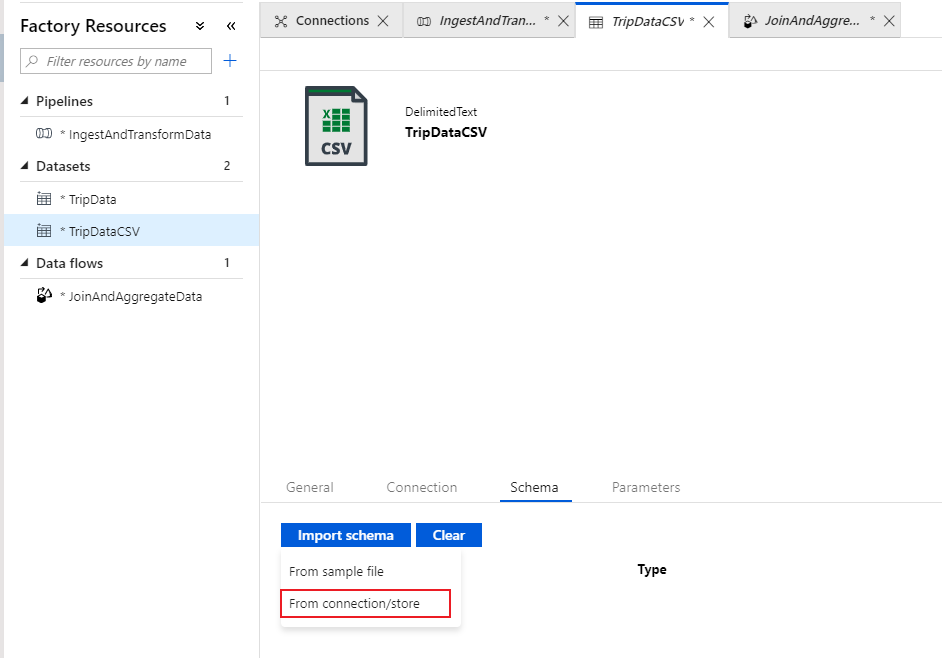
Go to tab Schema and select Import schema. Select From connection/store to import directly from the file store. 14 columns of type string should appear.
Go back to data flow 'JoinAndAggregateData'. If your debug cluster has started (indicated by a green circle next to the debug slider), you can get a snapshot of the data in the Data Preview tab. Select Refresh to fetch a data preview.


Note
Data preview does not write data.
Configure your trip fares SQL Database source
The second source you're adding points at the SQL Database table
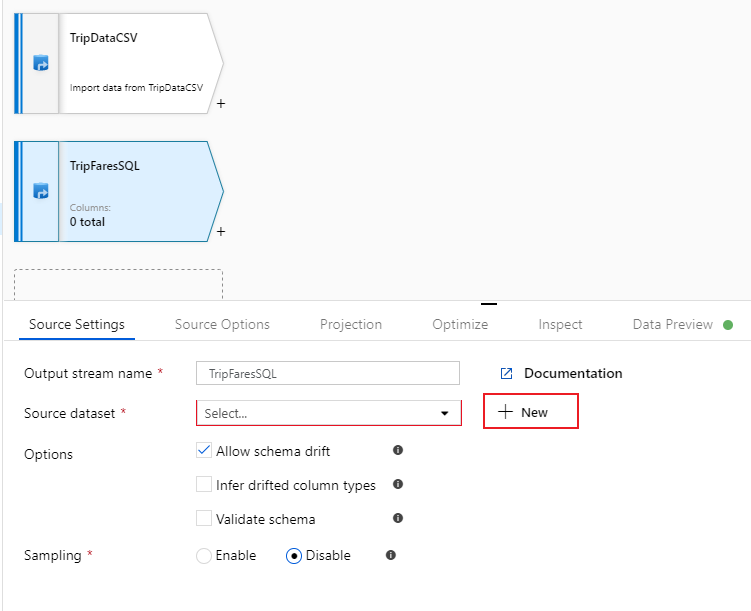
dbo.TripFares. Under your 'TripDataCSV' source, there is another Add Source box. Select it to add a new source transformation.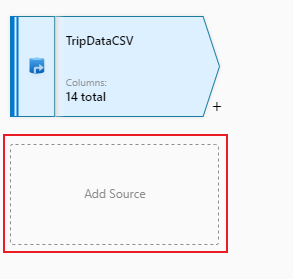
Name this source 'TripFaresSQL'. Select New next to the source dataset field to create a new SQL Database dataset.
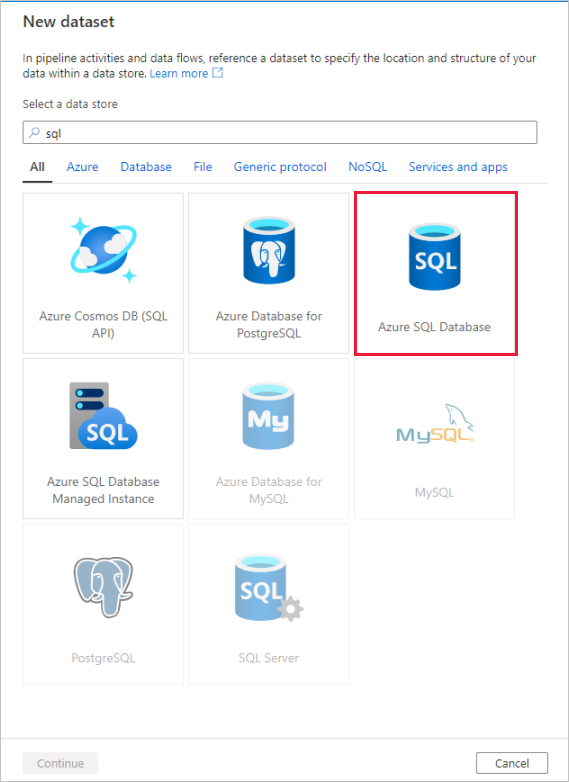
Select the Azure SQL Database tile and select continue. You might notice many of the connectors in data factory are not supported in mapping data flow. To transform data from one of these sources, ingest it into a supported source using the copy activity.
Call your dataset 'TripFares'. Select 'SQLDB' as your linked service. Select table name
dbo.TripFaresfrom the table name dropdown list. Import the schema From connection/store. Select OK when finished.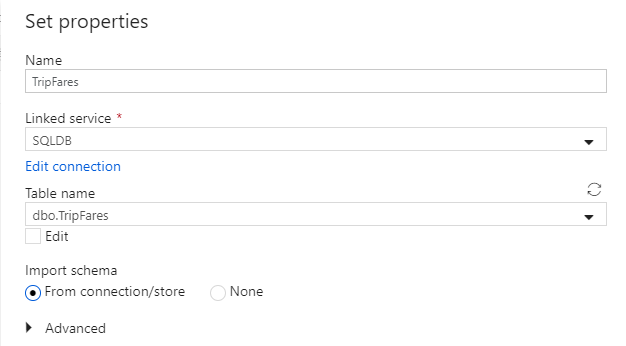
To verify your data, fetch a data preview in the Data Preview tab.


Inner join TripDataCSV and TripFaresSQL
To add a new transformation, select the plus icon in the bottom-right corner of 'TripDataCSV'. Under Multiple inputs/outputs, select Join.
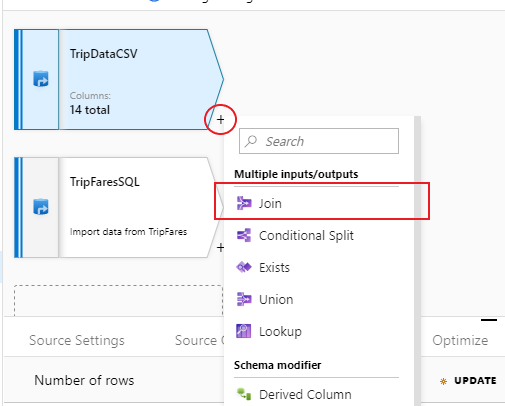
Name your join transformation 'InnerJoinWithTripFares'. Select 'TripFaresSQL' from the right stream dropdown list. Select Inner as the join type. To learn more about the different join types in mapping data flow, see join types.
Select which columns you wish to match on from each stream via the Join conditions dropdown list. To add an additional join condition, select on the plus icon next to an existing condition. By default, all join conditions are combined with an AND operator, which means all conditions must be met for a match. In this lab, we want to match on columns
medallion,hack_license,vendor_id, andpickup_datetime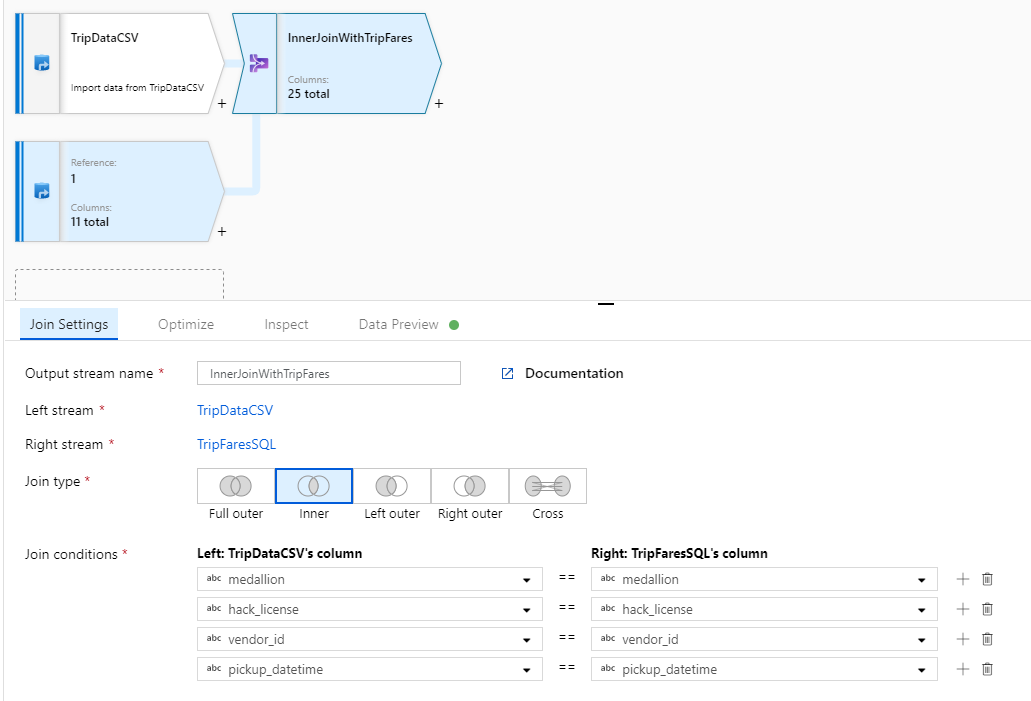
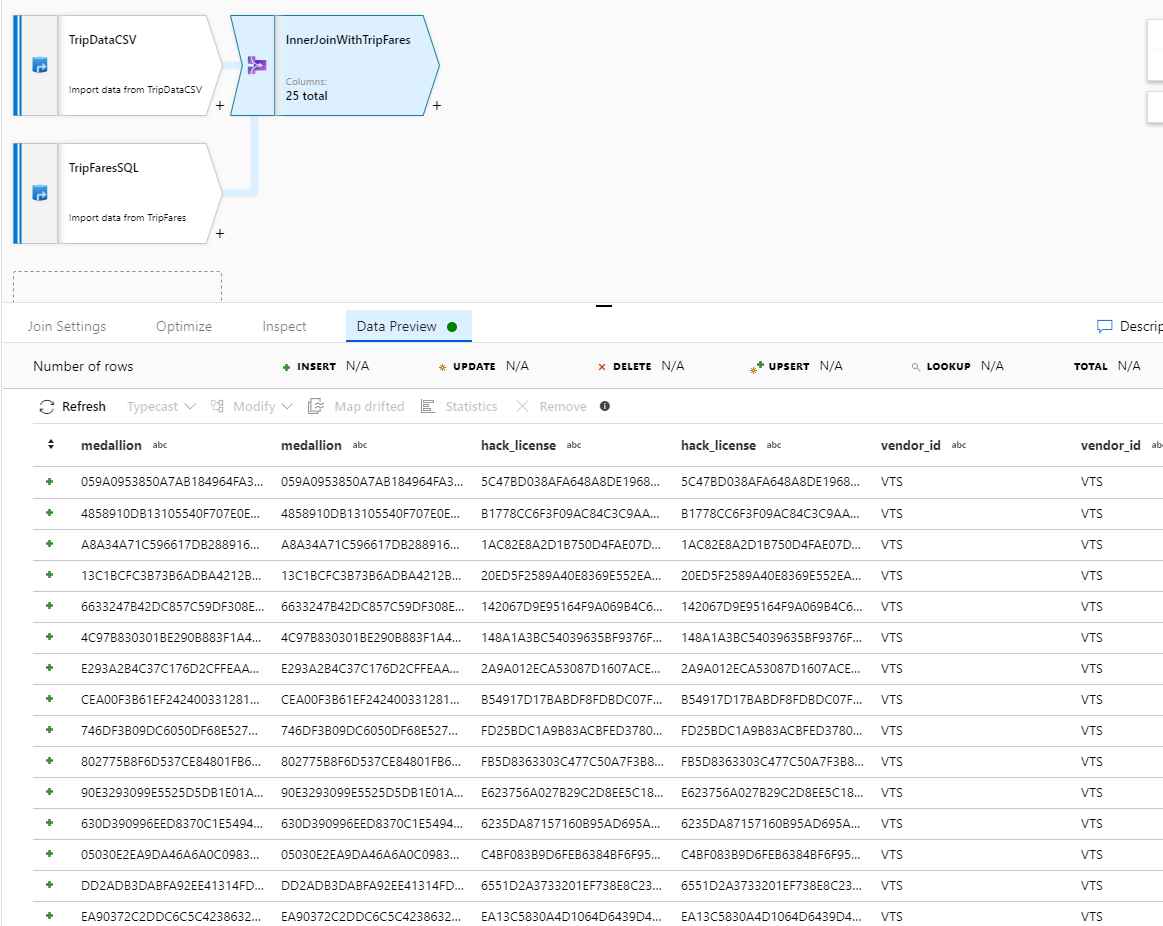
Verify you successfully joined 25 columns together with a data preview.


Aggregate by payment_type
After you complete your join transformation, add an aggregate transformation by selecting the plus icon next to InnerJoinWithTripFares. Choose Aggregate under Schema modifier.
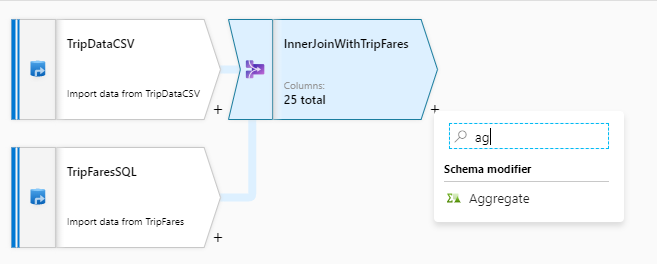
Name your aggregate transformation 'AggregateByPaymentType'. Select
payment_typeas the group by column.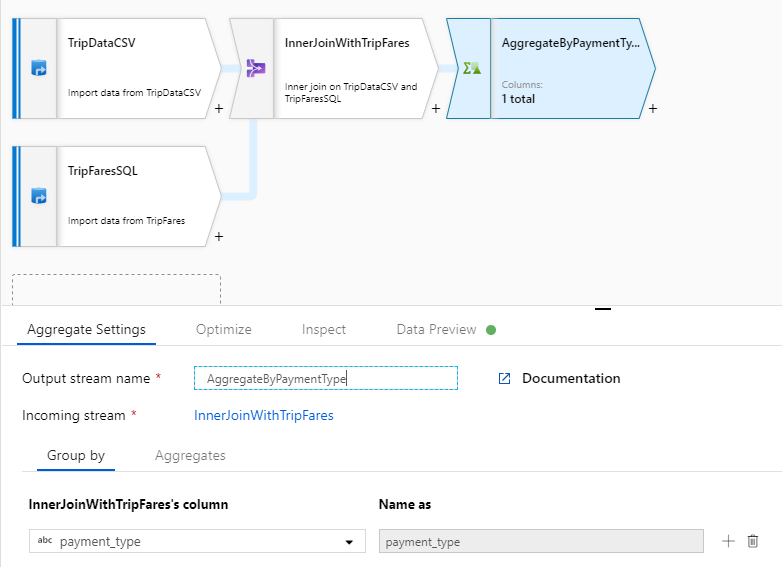
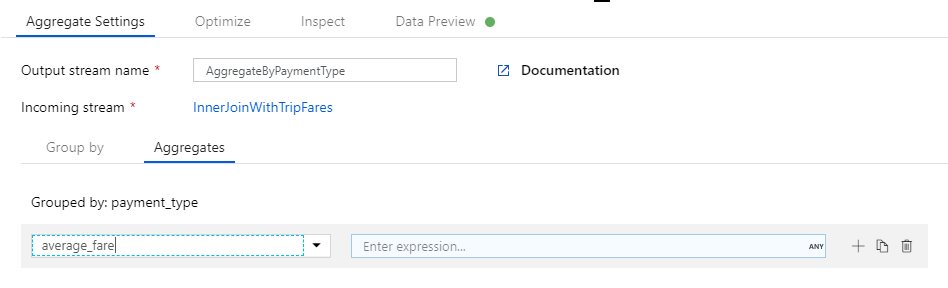
Go to the Aggregates tab. Specify two aggregations:
- The average fare grouped by payment type
- The total trip distance grouped by payment type
First, you'll create the average fare expression. In the text box labeled Add or select a column, enter 'average_fare'.
To enter an aggregation expression, select the blue box labeled Enter expression, which opens up the data flow expression builder, a tool used to visually create data flow expressions using input schema, built-in functions and operations, and user-defined parameters. For more information on the capabilities of the expression builder, see the expression builder documentation.
To get the average fare, use the
avg()aggregation function to aggregate thetotal_amountcolumn cast to an integer withtoInteger(). In the data flow expression language, this is defined asavg(toInteger(total_amount)). Select Save and finish when you're done.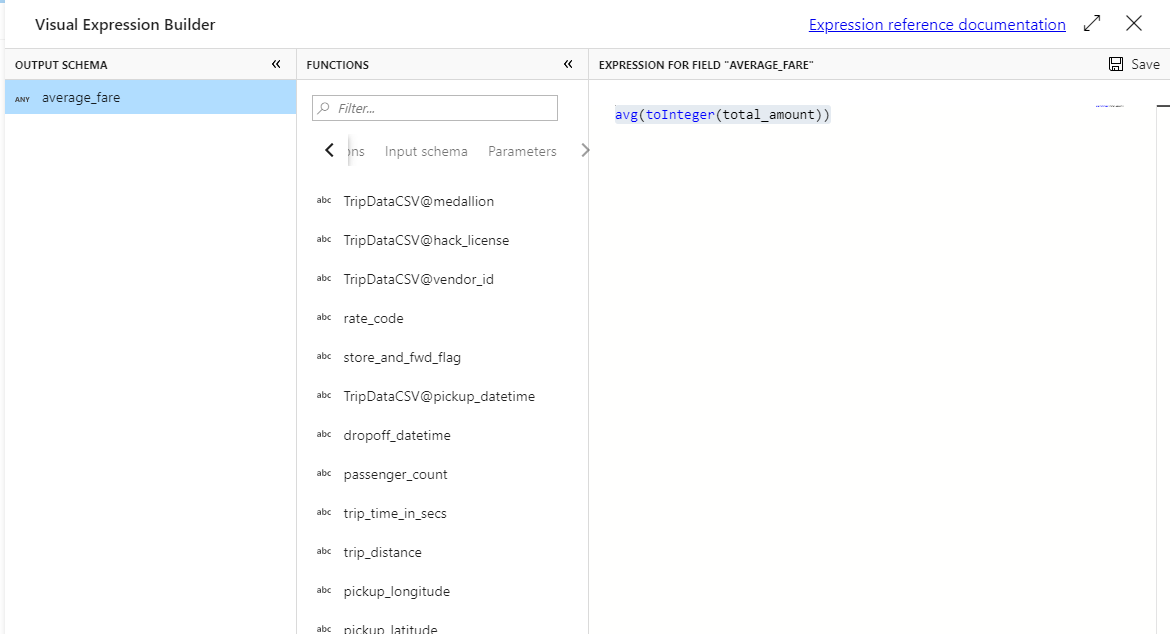
To add an additional aggregation expression, select on the plus icon next to
average_fare. Select Add column.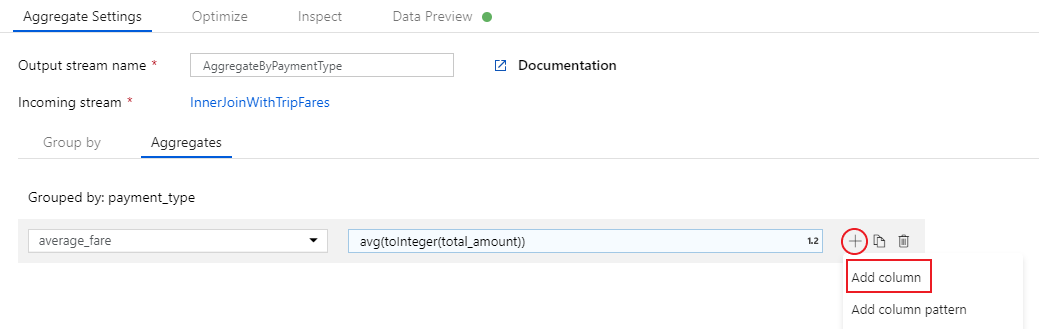
In the text box labeled Add or select a column, enter 'total_trip_distance'. As in the last step, open the expression builder to enter in the expression.
To get the total trip distance, use the
sum()aggregation function to aggregate thetrip_distancecolumn cast to an integer withtoInteger(). In the data flow expression language, this is defined assum(toInteger(trip_distance)). Select Save and finish when you're done.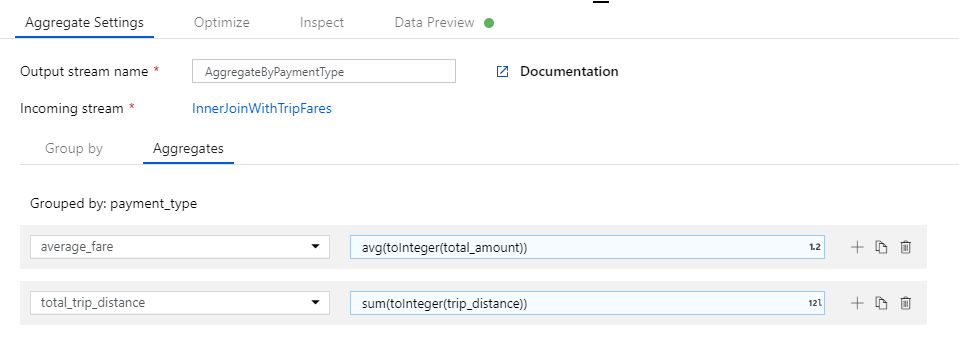
Test your transformation logic in the Data Preview tab. As you can see, there are significantly fewer rows and columns than previously. Only the three groups by and aggregation columns defined in this transformation continue downstream. As there are only five payment type groups in the sample, only five rows are outputted.


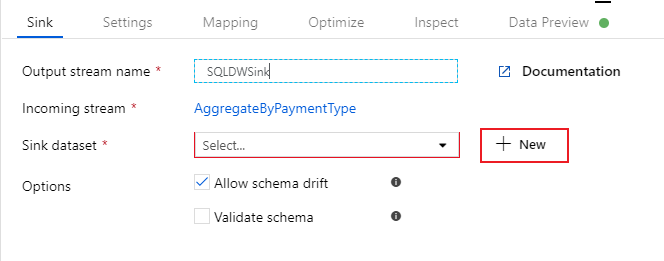
Configure you Azure Synapse Analytics sink
Now that we have finished our transformation logic, we are ready to sink our data in an Azure Synapse Analytics table. Add a sink transformation under the Destination section.
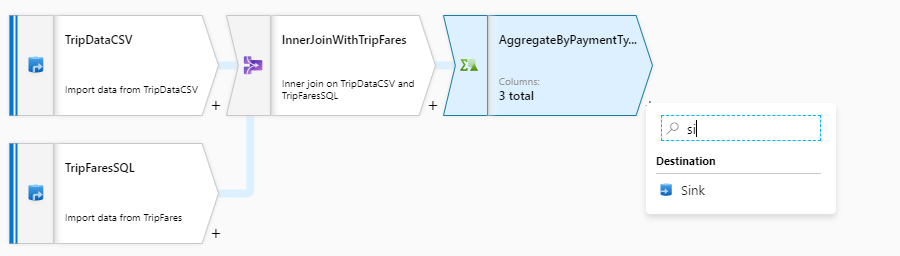
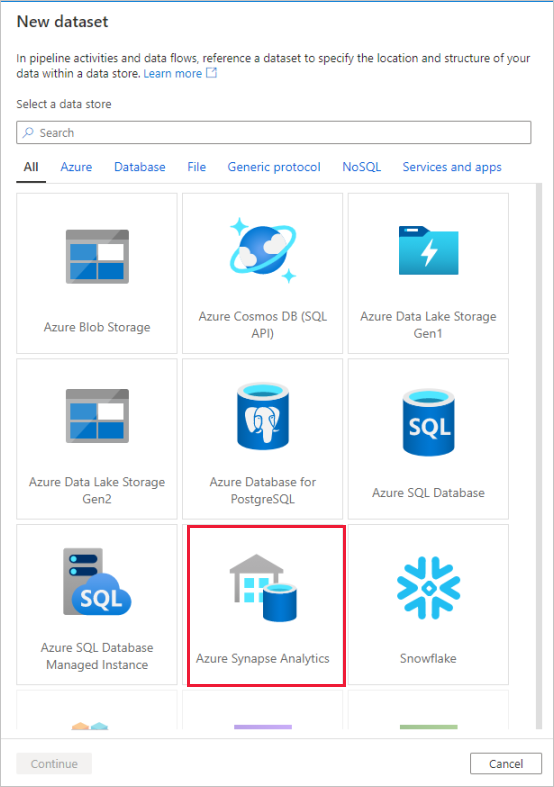
Name your sink 'SQLDWSink'. Select New next to the sink dataset field to create a new Azure Synapse Analytics dataset.
Select the Azure Synapse Analytics tile and select continue.
Call your dataset 'AggregatedTaxiData'. Select 'SQLDW' as your linked service. Select Create new table and name the new table
dbo.AggregateTaxiData. Select OK when finished.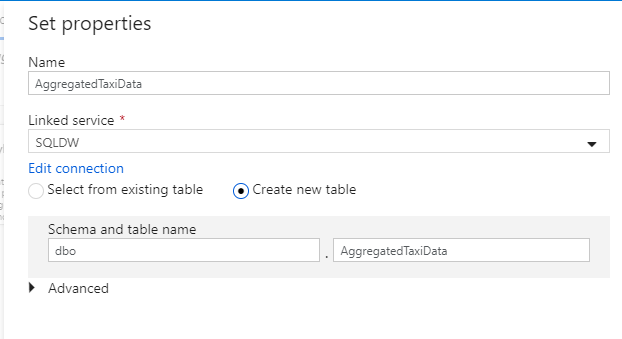
Go to the Settings tab of the sink. Since we are creating a new table, we need to select Recreate table under table action. Unselect Enable staging, which toggles whether we are inserting row-by-row or in batch.


You have successfully created your data flow. Now it's time to run it in a pipeline activity.
Debug your pipeline end-to-end
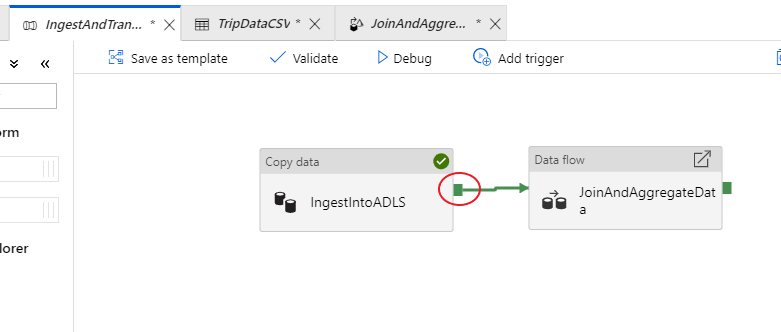
Go back to the tab for the IngestAndTransformData pipeline. Notice the green box on the 'IngestIntoADLS' copy activity. Drag it over to the 'JoinAndAggregateData' data flow activity. This creates an 'on success', which causes the data flow activity to only run if the copy is successful.
As we did for the copy activity, select Debug to execute a debug run. For debug runs, the data flow activity uses the active debug cluster instead of spinning up a new cluster. This pipeline takes a little over a minute to execute.
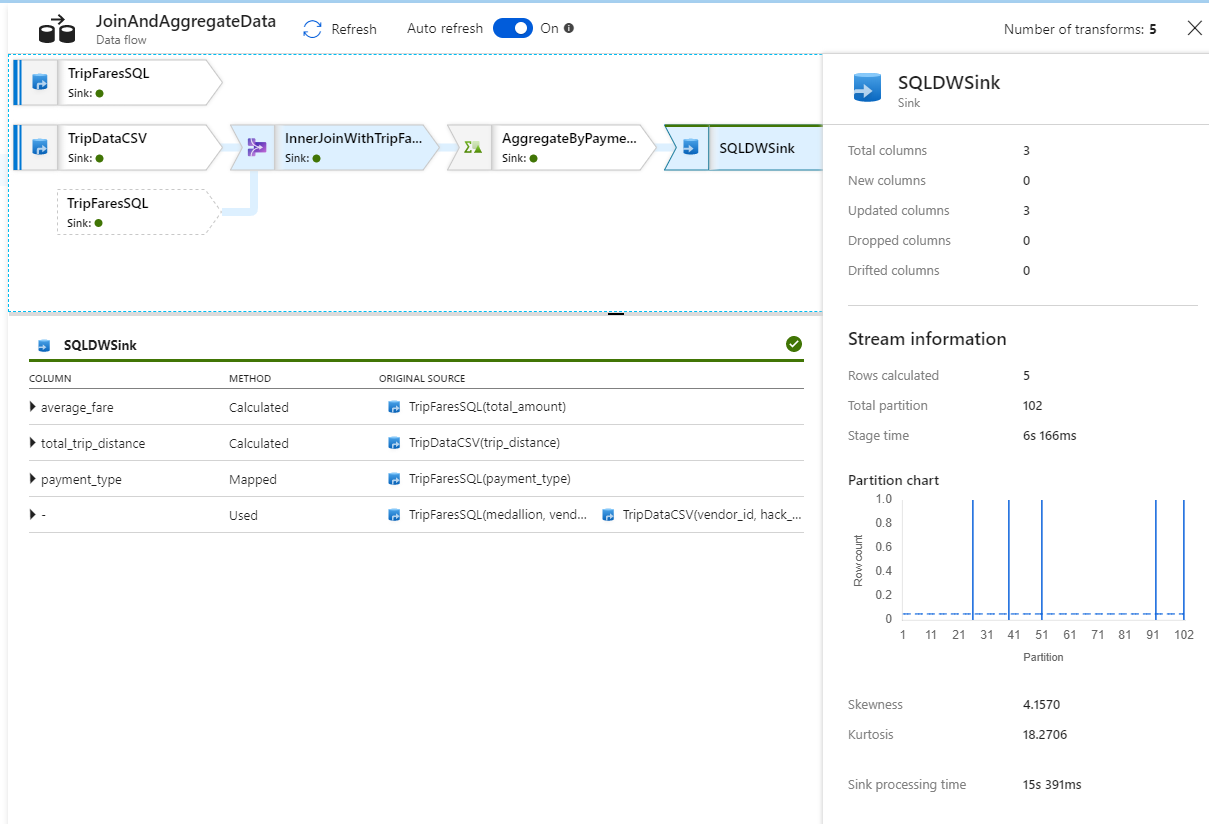
Like the copy activity, the data flow has a special monitoring view accessed by the eyeglasses icon on completion of the activity.

In the monitoring view, you can see a simplified data flow graph along with the execution times and rows at each execution stage. If done correctly, you should have aggregated 49,999 rows into five rows in this activity.

You can select a transformation to get additional details on its execution such as partitioning information and new/updated/dropped columns.


You have now completed the data factory portion of this lab. Publish your resources if you wish to operationalize them with triggers. You successfully ran a pipeline that ingested data from Azure SQL Database to Azure Data Lake Storage using the copy activity and then aggregated that data into an Azure Synapse Analytics. You can verify the data was successfully written by looking at the SQL Server itself.
Share data using Azure Data Share
In this section, you learn how to set up a new data share using the Azure portal. This involves creating a new data share that contains datasets from Azure Data Lake Storage Gen2 and Azure Synapse Analytics. You'll then configure a snapshot schedule, which will give the data consumers an option to automatically refresh the data being shared with them. Then, you'll invite recipients to your data share.
Once you have created a data share, you'll then switch hats and become the data consumer. As the data consumer, you'll walk through the flow of accepting a data share invitation, configuring where you'd like the data to be received and mapping datasets to different storage locations. Then, you'll trigger a snapshot, which will copy the data shared with you into the destination specified.
Share data (Data Provider flow)
Open the Azure portal in either Microsoft Edge or Google Chrome.
Using the search bar at the top of the page, search for Data Shares
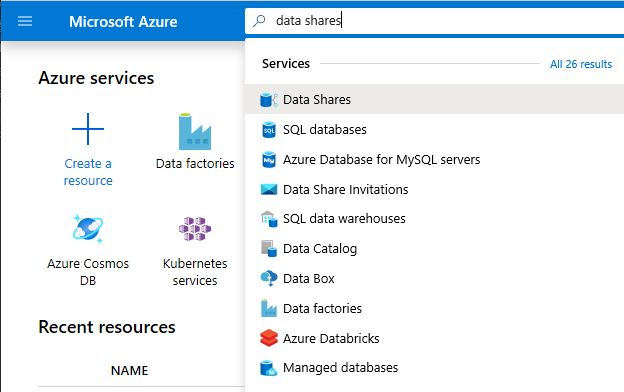
Select the data share account with 'Provider' in the name. For example, DataProvider0102.
Select Start sharing your data

Select +Create to start configuring your new data share.
Under Share name, specify a name of your choice. This is the share name that will be seen by your data consumer, so be sure to give it a descriptive name such as TaxiData.
Under Description, put in a sentence, which describes the contents of the data share. The data share contains world-wide taxi trip data that is stored in a variety of stores, including Azure Synapse Analytics and Azure Data Lake Storage.
Under Terms of use, specify a set of terms that you would like your data consumer to adhere to. Some examples include "Do not distribute this data outside your organization" or "Refer to legal agreement".

Select Continue.
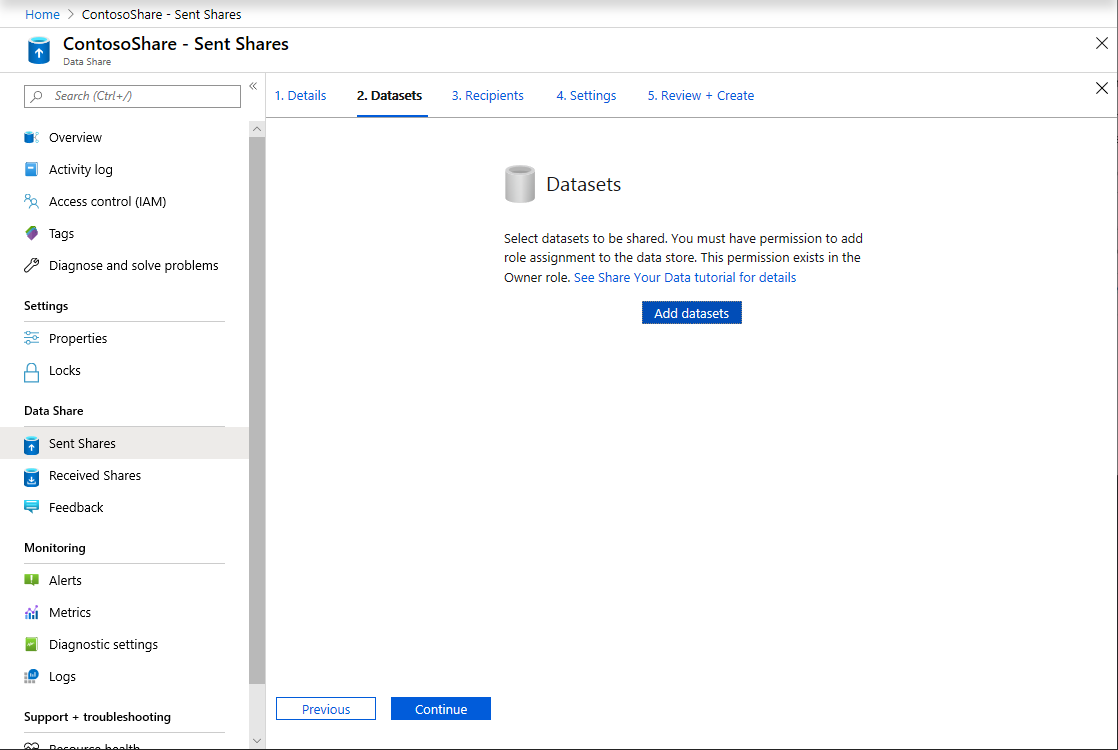
Select Add datasets
Select Azure Synapse Analytics to select a table from Azure Synapse Analytics that your ADF transformations landed in.
You are given a script to run before you can proceed. The script provided creates a user in the SQL database to allow the Azure Data Share MSI to authenticate on its behalf.
Important
Before running the script, you must set yourself as the Active Directory Admin for the logical SQL server of the Azure SQL Database.
Open a new tab and navigate to the Azure portal. Copy the script provided to create a user in the database that you want to share data from. Do this by signing in to the EDW database using the Azure portal Query editor, using Microsoft Entra authentication. You need to modify the user in the following sample script:
CREATE USER [dataprovider-xxxx@contoso.com] FROM EXTERNAL PROVIDER;
ALTER ROLE db_owner ADD MEMBER [wiassaf@microsoft.com];
Switch back to Azure Data Share where you were adding datasets to your data share.
Select EDW, then select AggregatedTaxiData for the table.
Select Add dataset
We now have a SQL table that is part of our dataset. Next, we will add additional datasets from Azure Data Lake Storage.
Select Add dataset and select Azure Data Lake Storage Gen2
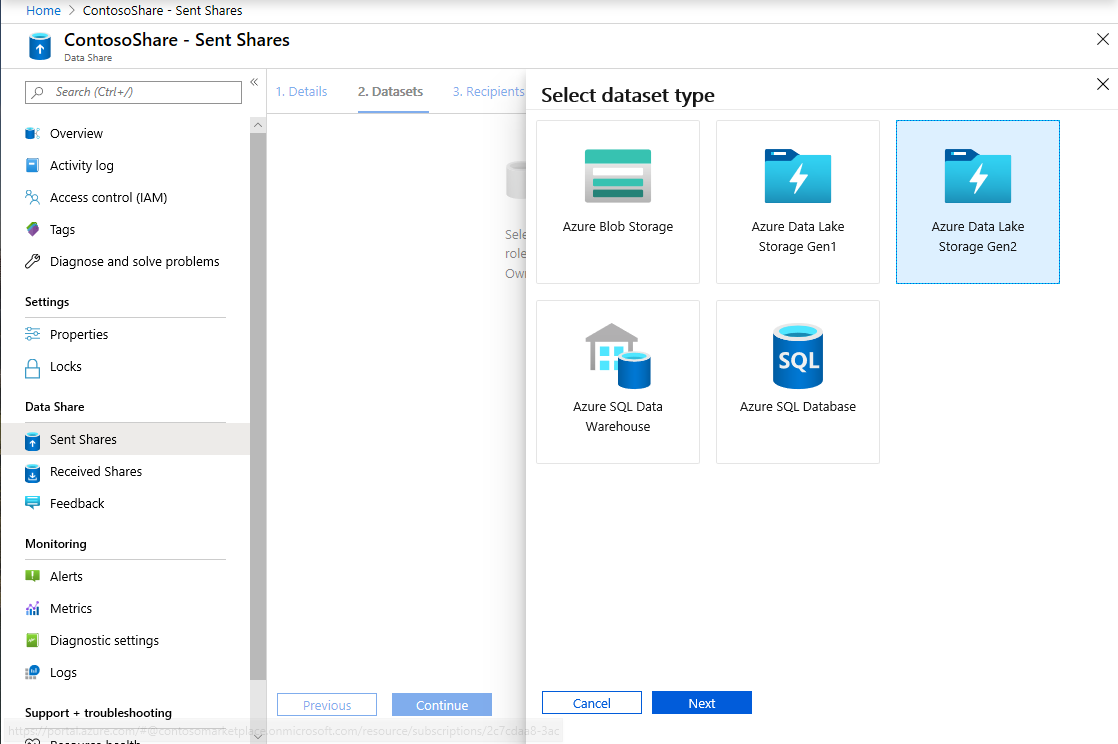
Select Next
Expand wwtaxidata. Expand Boston Taxi Data. You can share down to the file level.
Select the Boston Taxi Data folder to add the entire folder to your data share.
Select Add datasets
Review the datasets that have been added. You should have a SQL table and an ADLS Gen2 folder added to your data share.
Select Continue
In this screen, you can add recipients to your data share. The recipients you add will receive invitations to your data share. For the purpose of this lab, you must add in two e-mail addresses:
The e-mail address of the Azure subscription you're in.
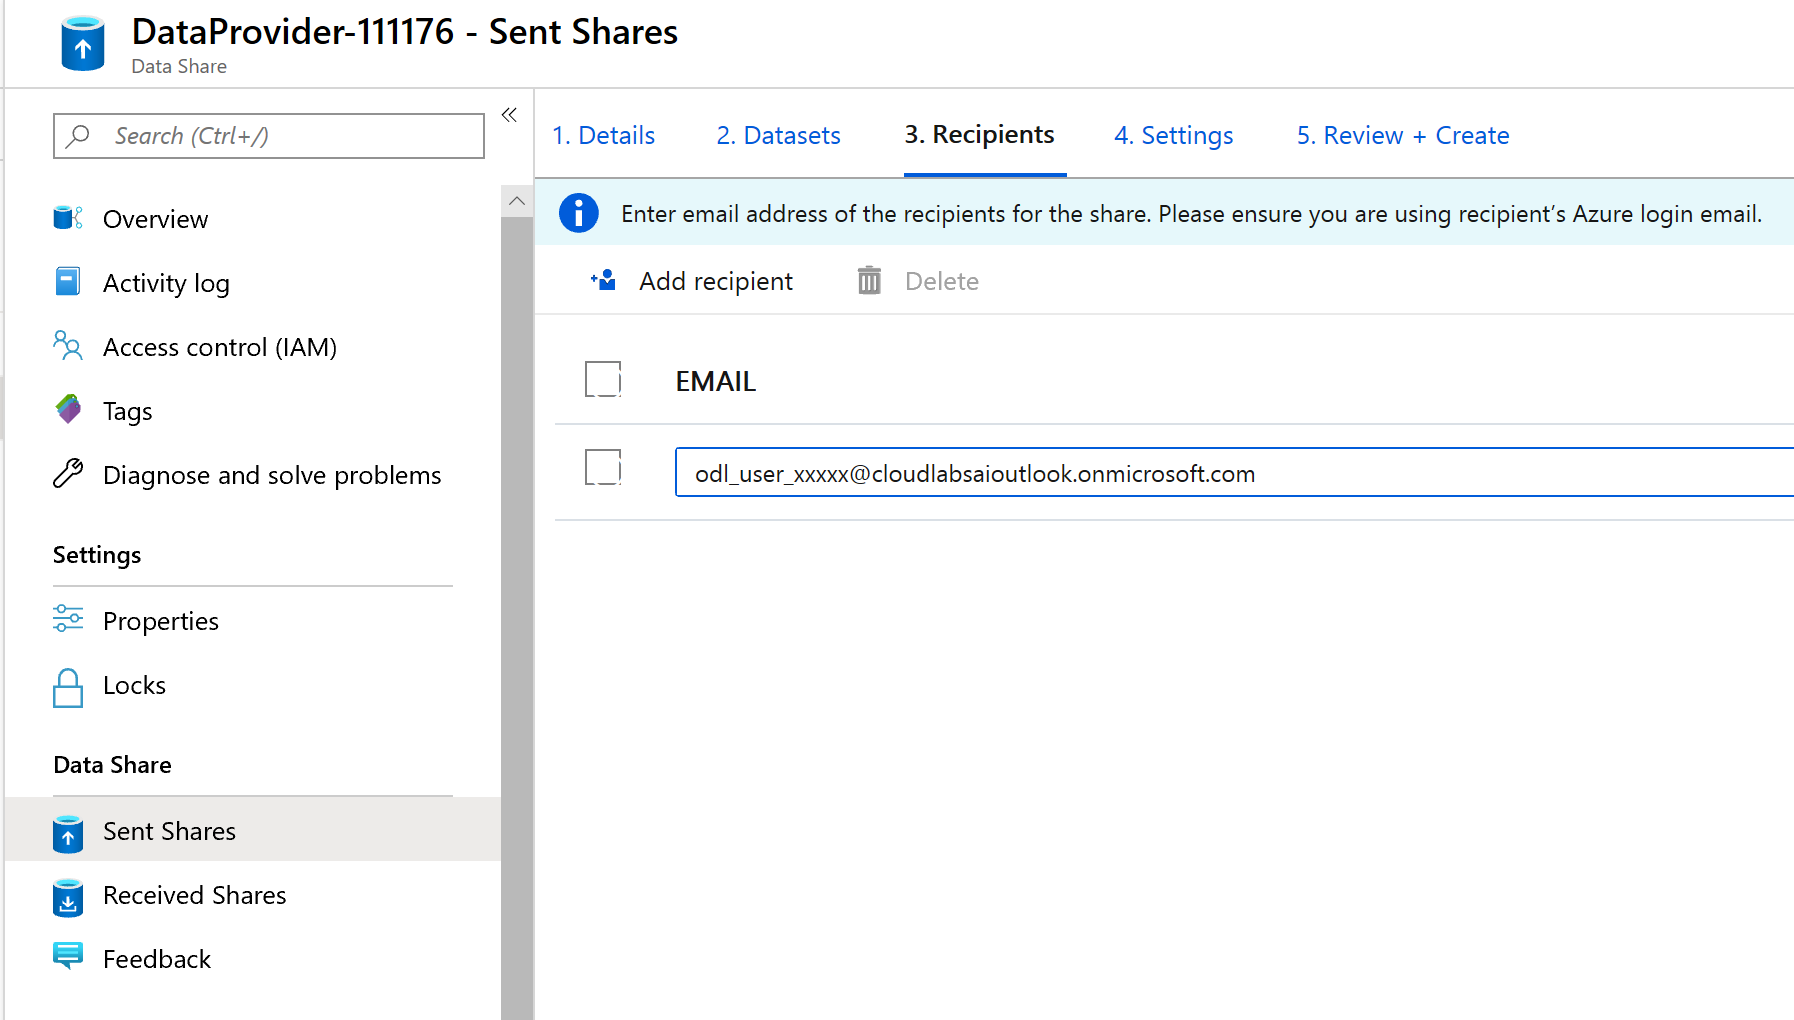
Add in the fictional data consumer named janedoe@fabrikam.com.
In this screen, you can configure a Snapshot Setting for your data consumer. This allows them to receive regular updates of your data at an interval defined by you.
Check Snapshot Schedule and configure an hourly refresh of your data by using the Recurrence dropdown list.
Select Create.
You now have an active data share. Lets review what you can see as a data provider when you create a data share.
Select the data share that you created, titled DataProvider. You can navigate to it by selecting Sent Shares in Data Share.
Select on Snapshot schedule. You can disable the snapshot schedule if you choose.
Next, select the Datasets tab. You can add additional datasets to this data share after it has been created.
Select the Share subscriptions tab. No share subscriptions exist yet because your data consumer hasn't yet accepted your invitation.
Navigate to the Invitations tab. Here, you'll see a list of pending invitation(s).
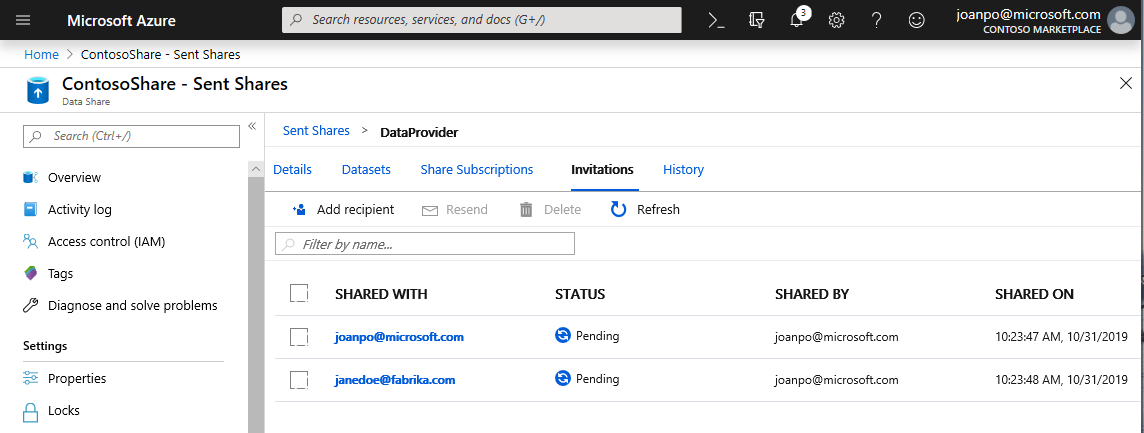
Select the invitation to janedoe@fabrikam.com. Select Delete. If your recipient hasn't yet accepted the invitation, they will no longer be able to do so.
Select the History tab. Nothing is displayed as yet because your data consumer hasn't yet accepted your invitation and triggered a snapshot.


Receive data (Data consumer flow)
Now that we have reviewed our data share, we are ready to switch context and wear our data consumer hat.
You should now have an Azure Data Share invitation in your inbox from Microsoft Azure. Launch Outlook Web Access (outlook.com) and sign in using the credentials supplied for your Azure subscription.
In the e-mail that you should have received, select on "View invitation >". At this point, you're going to be simulating the data consumer experience when accepting a data providers invitation to their data share.

You might be prompted to select a subscription. Make sure you select the subscription you have been working in for this lab.
Select on the invitation titled DataProvider.
In this Invitation screen, notice various details about the data share that you configured earlier as a data provider. Review the details and accept the terms of use if provided.
Select the Subscription and Resource Group that already exists for your lab.
For Data share account, select DataConsumer. You can also create a new data share account.
Next to Received share name, notice the default share name is the name that was specified by the data provider. Give the share a friendly name that describes the data you're about to receive, e.g TaxiDataShare.

You can choose to Accept and configure now or Accept and configure later. If you choose to accept and configure now, specify a storage account where all data should be copied. If you choose to accept and configure later, the datasets in the share will be unmapped and you'll need to manually map them. We will opt for that later.
Select Accept and configure later.
When configuring this option, a share subscription is created but there is nowhere for the data to land since no destination has been mapped.
Next, configure dataset mappings for the data share.
Select the Received Share (the name you specified in step 5).
Trigger snapshot is greyed out but the share is Active.
Select the Datasets tab. Each dataset is Unmapped, which means that it has no destination to copy data to.

Select the Azure Synapse Analytics Table and then select + Map to Target.
On the right-hand side of the screen, select the Target Data Type dropdown list.
You can map the SQL data to a wide range of data stores. In this case, we'll be mapping to an Azure SQL Database.

(Optional) Select Azure Data Lake Storage Gen2 as the target data type.
(Optional) Select the Subscription, Resource Group and Storage account you have been working in.
(Optional) You can choose to receive the data into your data lake in either csv or parquet format.
Next to Target data type, select Azure SQL Database.
Select the Subscription, Resource Group and Storage account you have been working in.
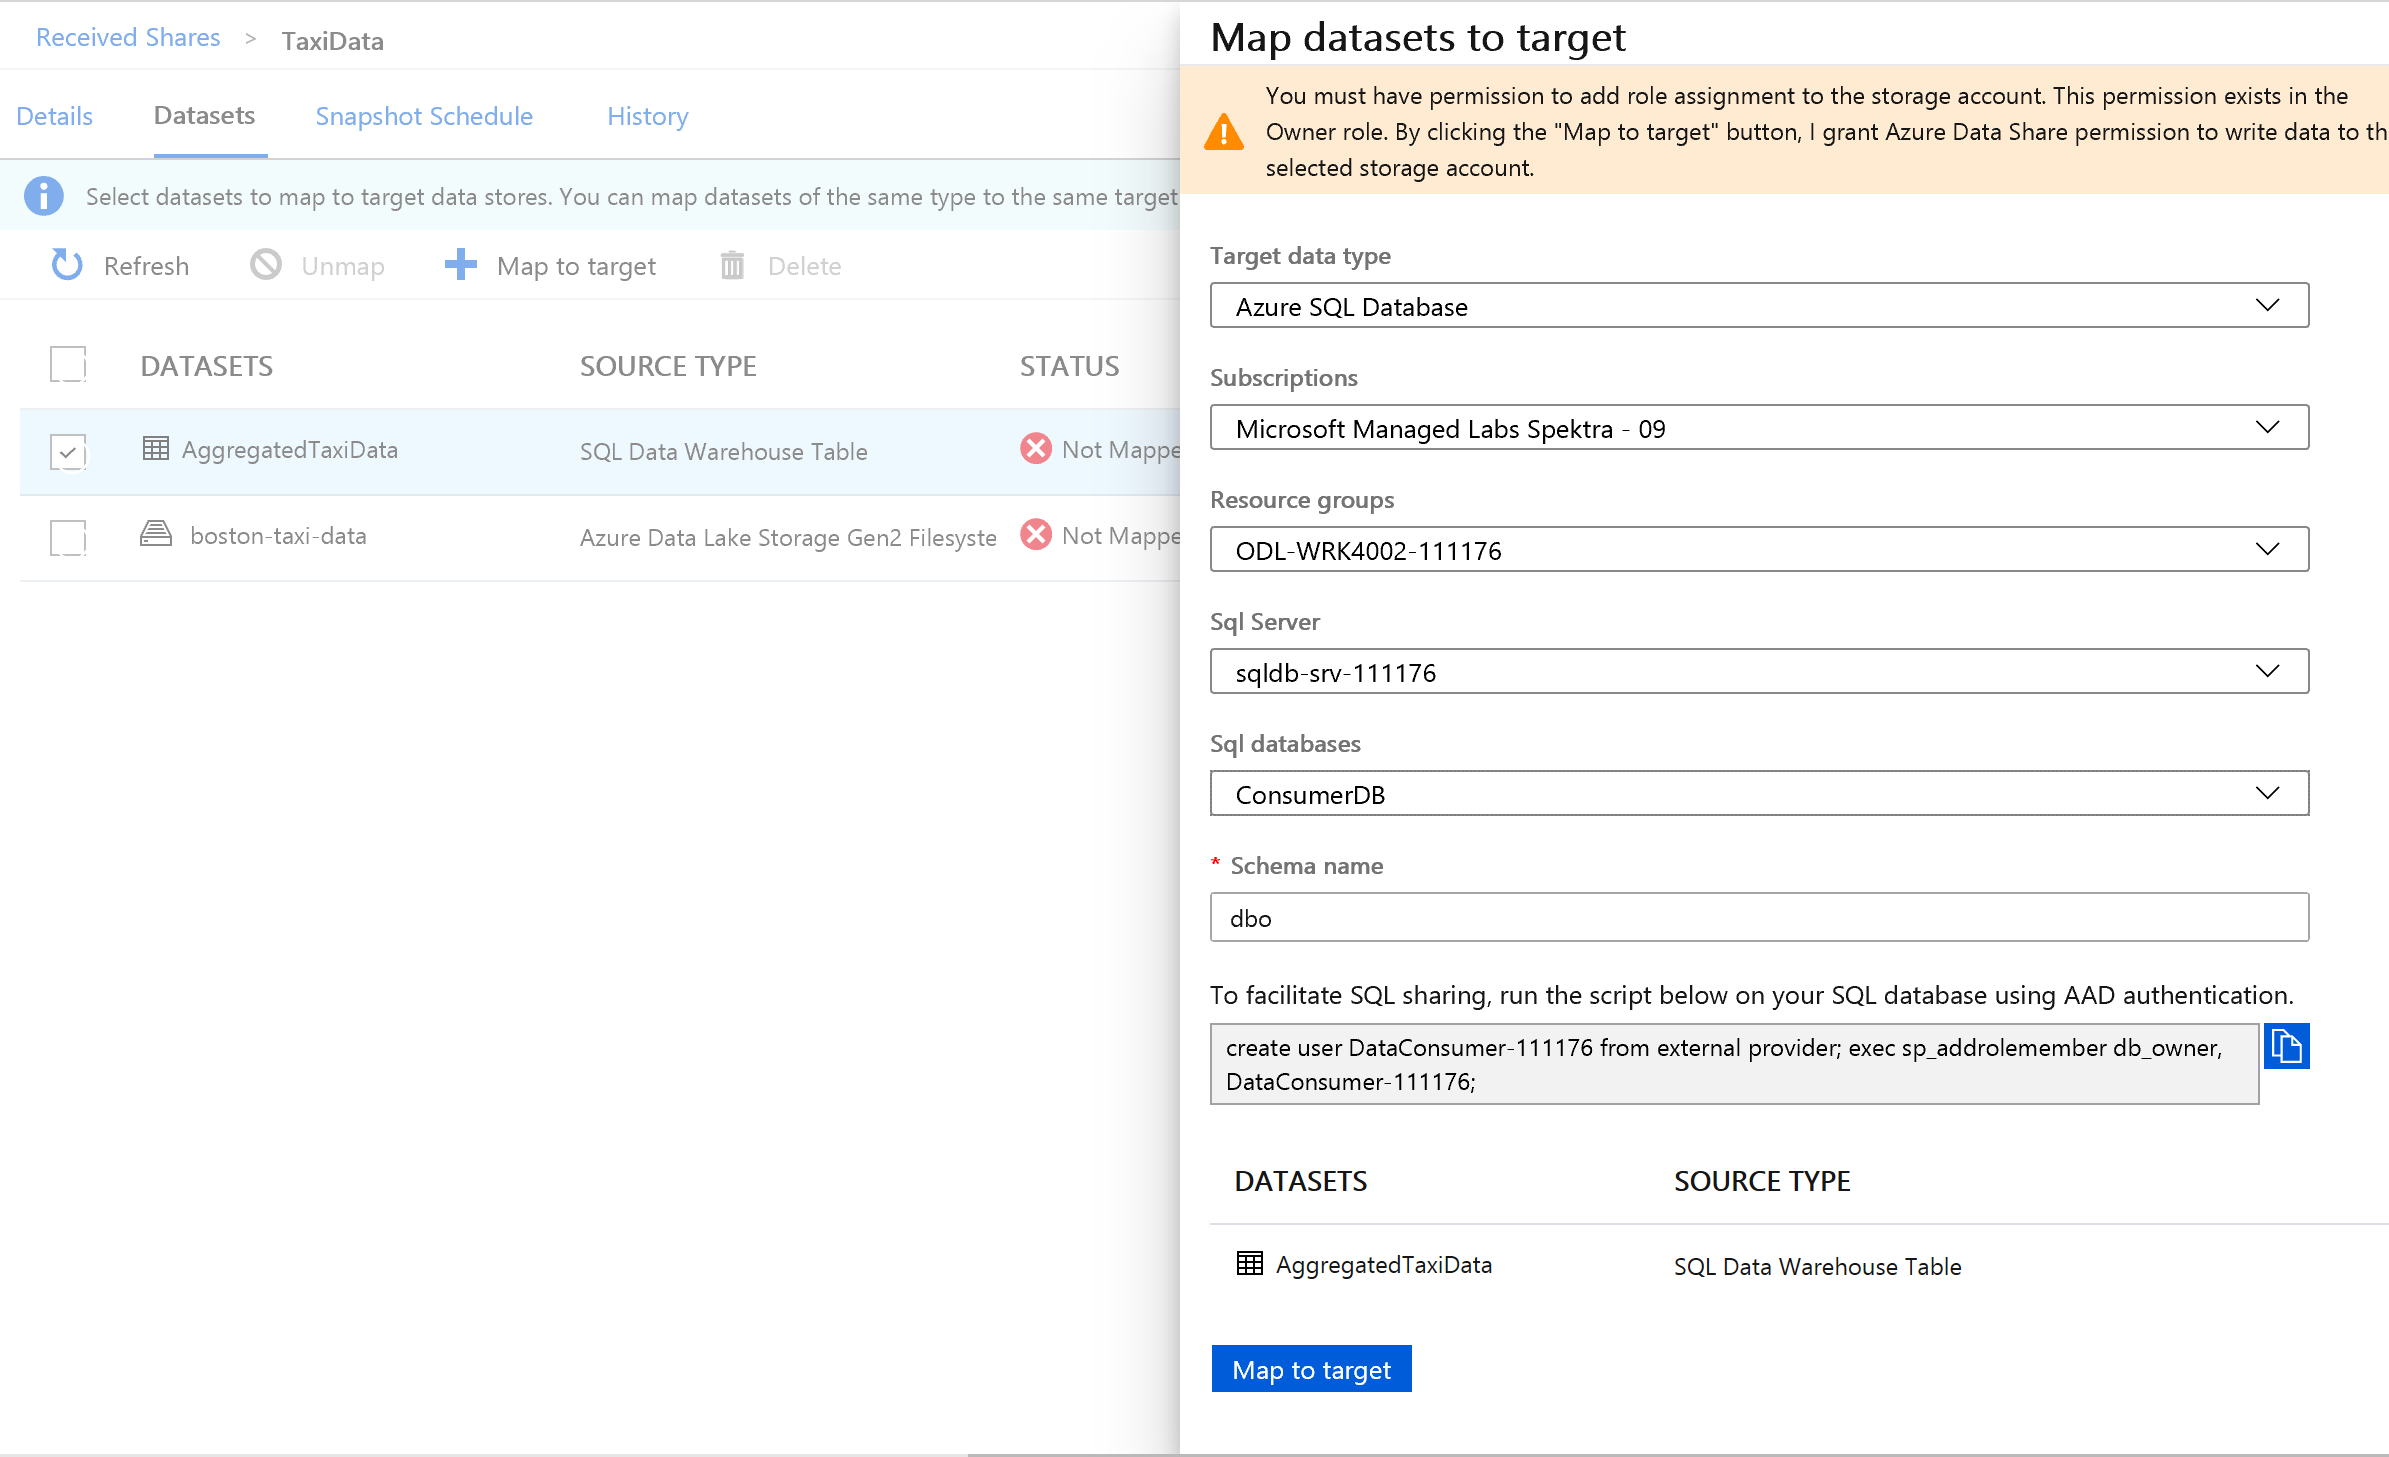
Before you can proceed, you'll need to create a new user in the SQL Server by running the script provided. First, copy the script provided to your clipboard.
Open a new Azure portal tab. Don't close your existing tab as you'll need to come back to it in a moment.
In the new tab you opened, navigate to SQL databases.
Select the SQL database (there should only be one in your subscription). Be careful not to select the data warehouse.
Select Query editor (preview)
Use Microsoft Entra authentication to sign in to the Query editor.
Run the query provided in your data share (copied to clipboard in step 14).
This command allows the Azure Data Share service to use Managed Identities for Azure Services to authenticate to the SQL Server to be able to copy data into it.
Go back to the original tab, and select Map to target.
Next, select the Azure Data Lake Storage Gen2 folder that is part of the dataset and map it to an Azure Blob Storage account.
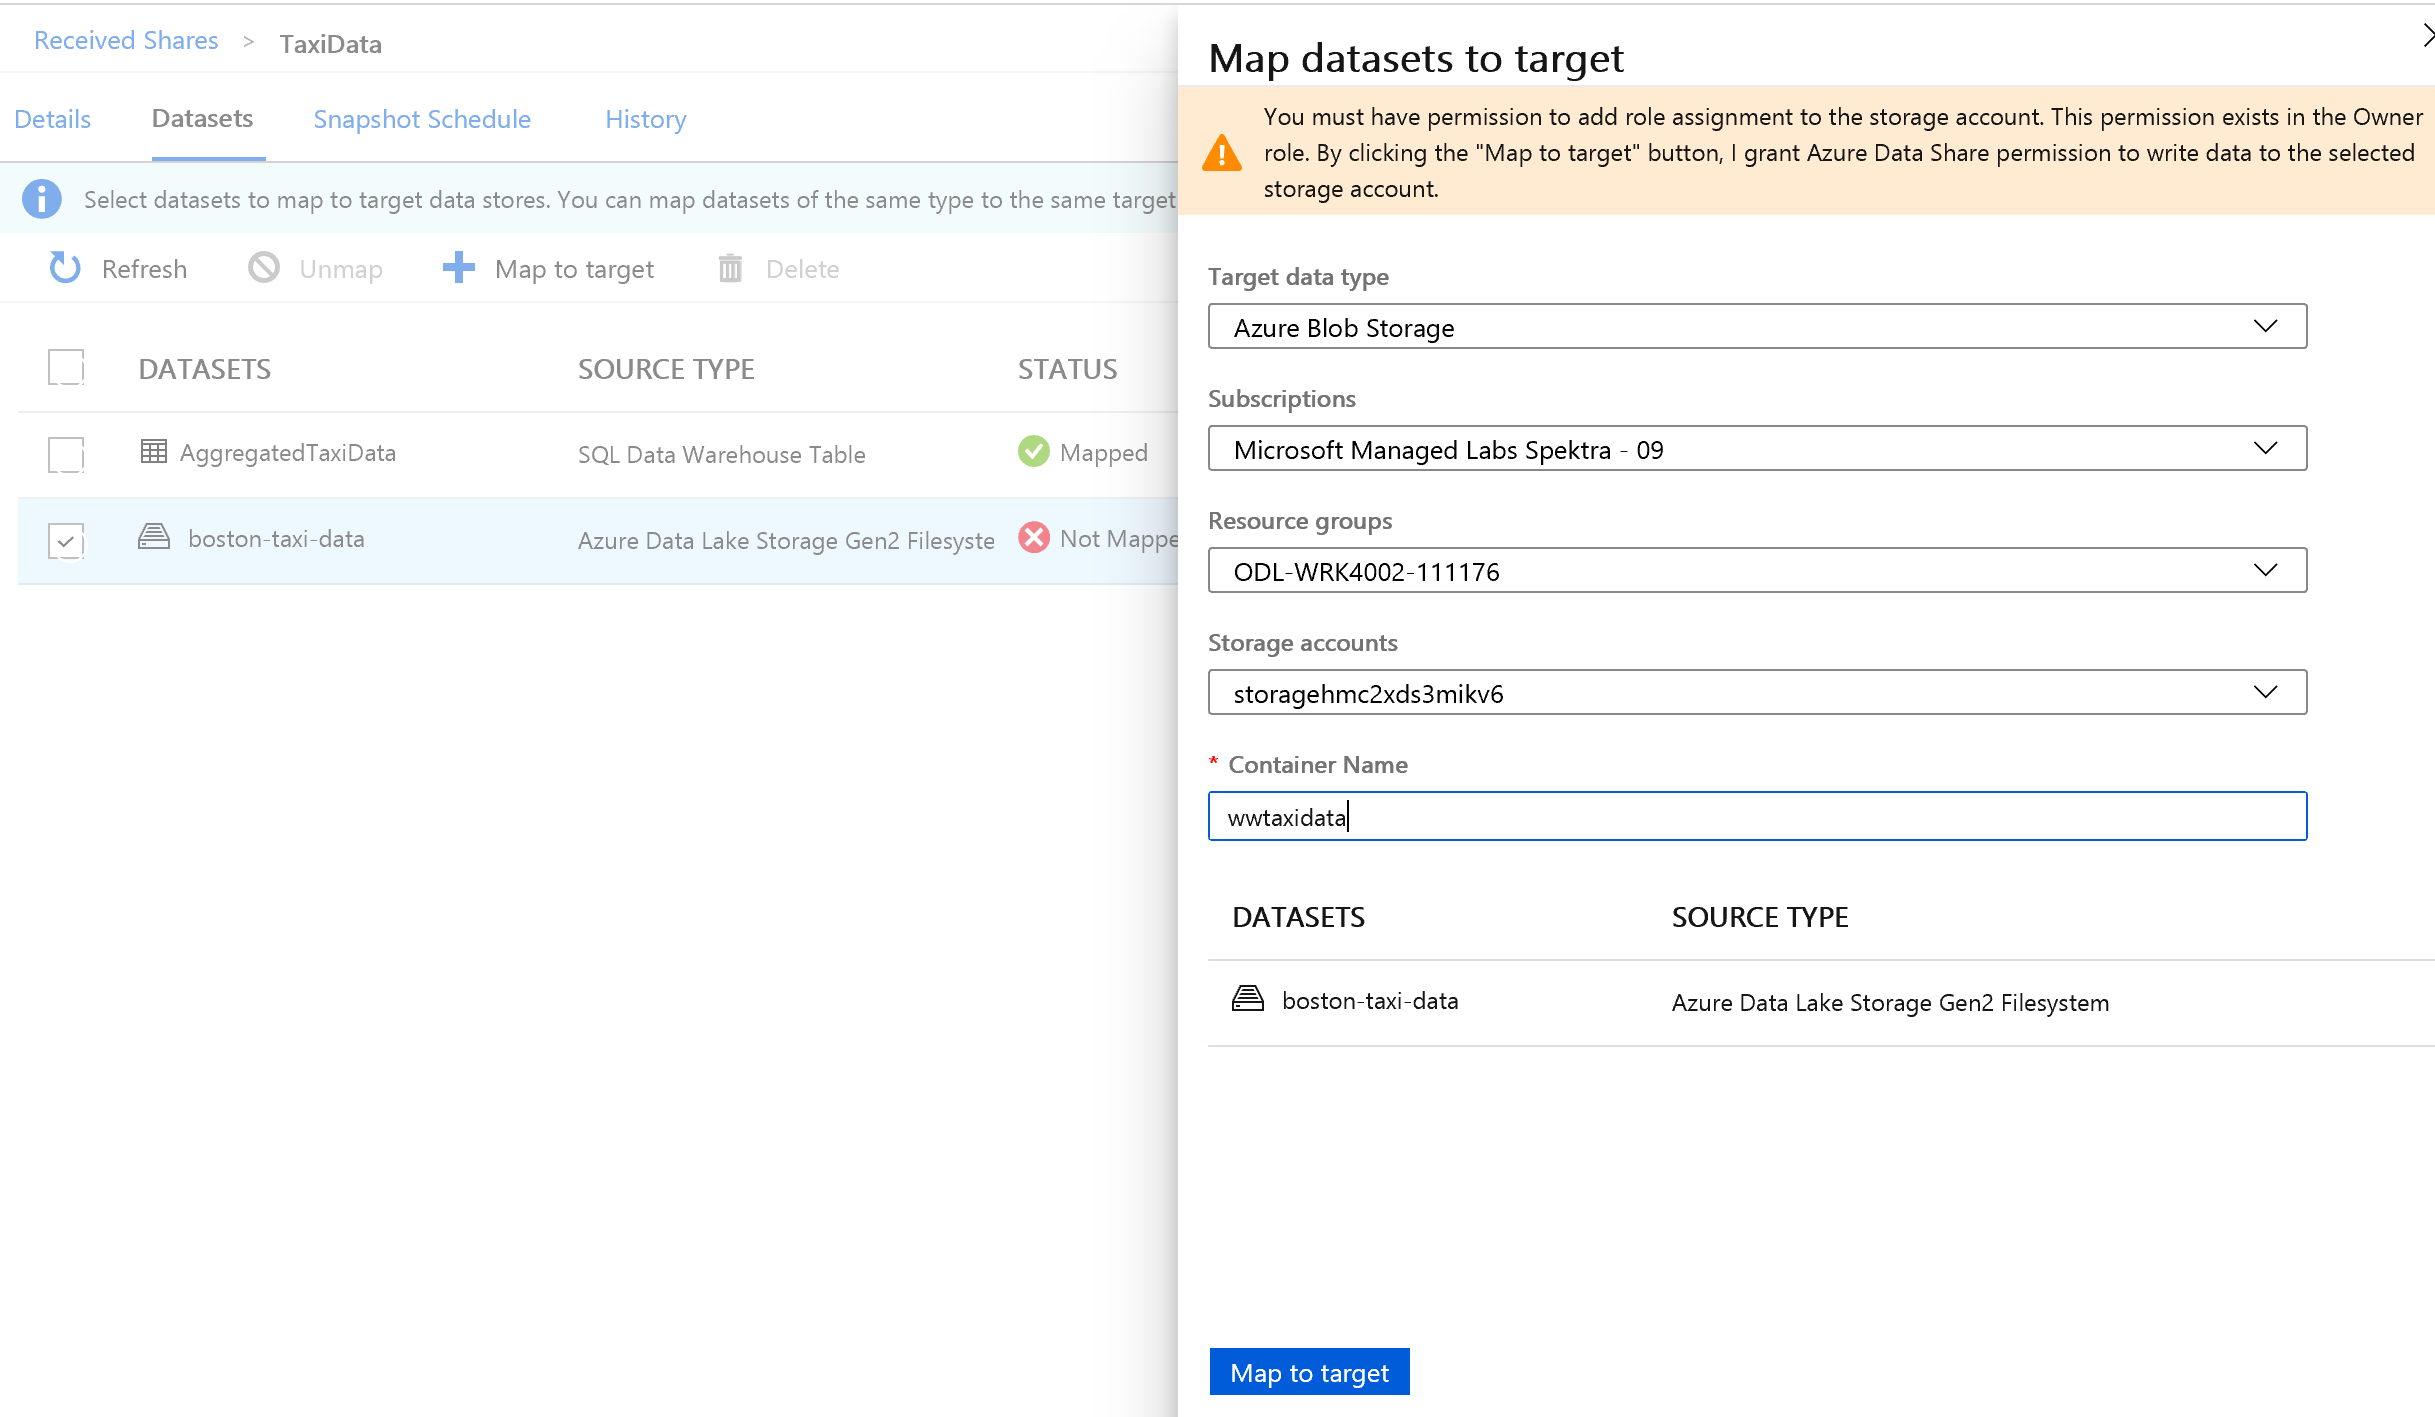
With all datasets mapped, you're now ready to start receiving data from the data provider.

Select Details.
Trigger snapshot is no longer greyed out, since the data share now has destinations to copy into.
Select Trigger snapshot -> Full copy.
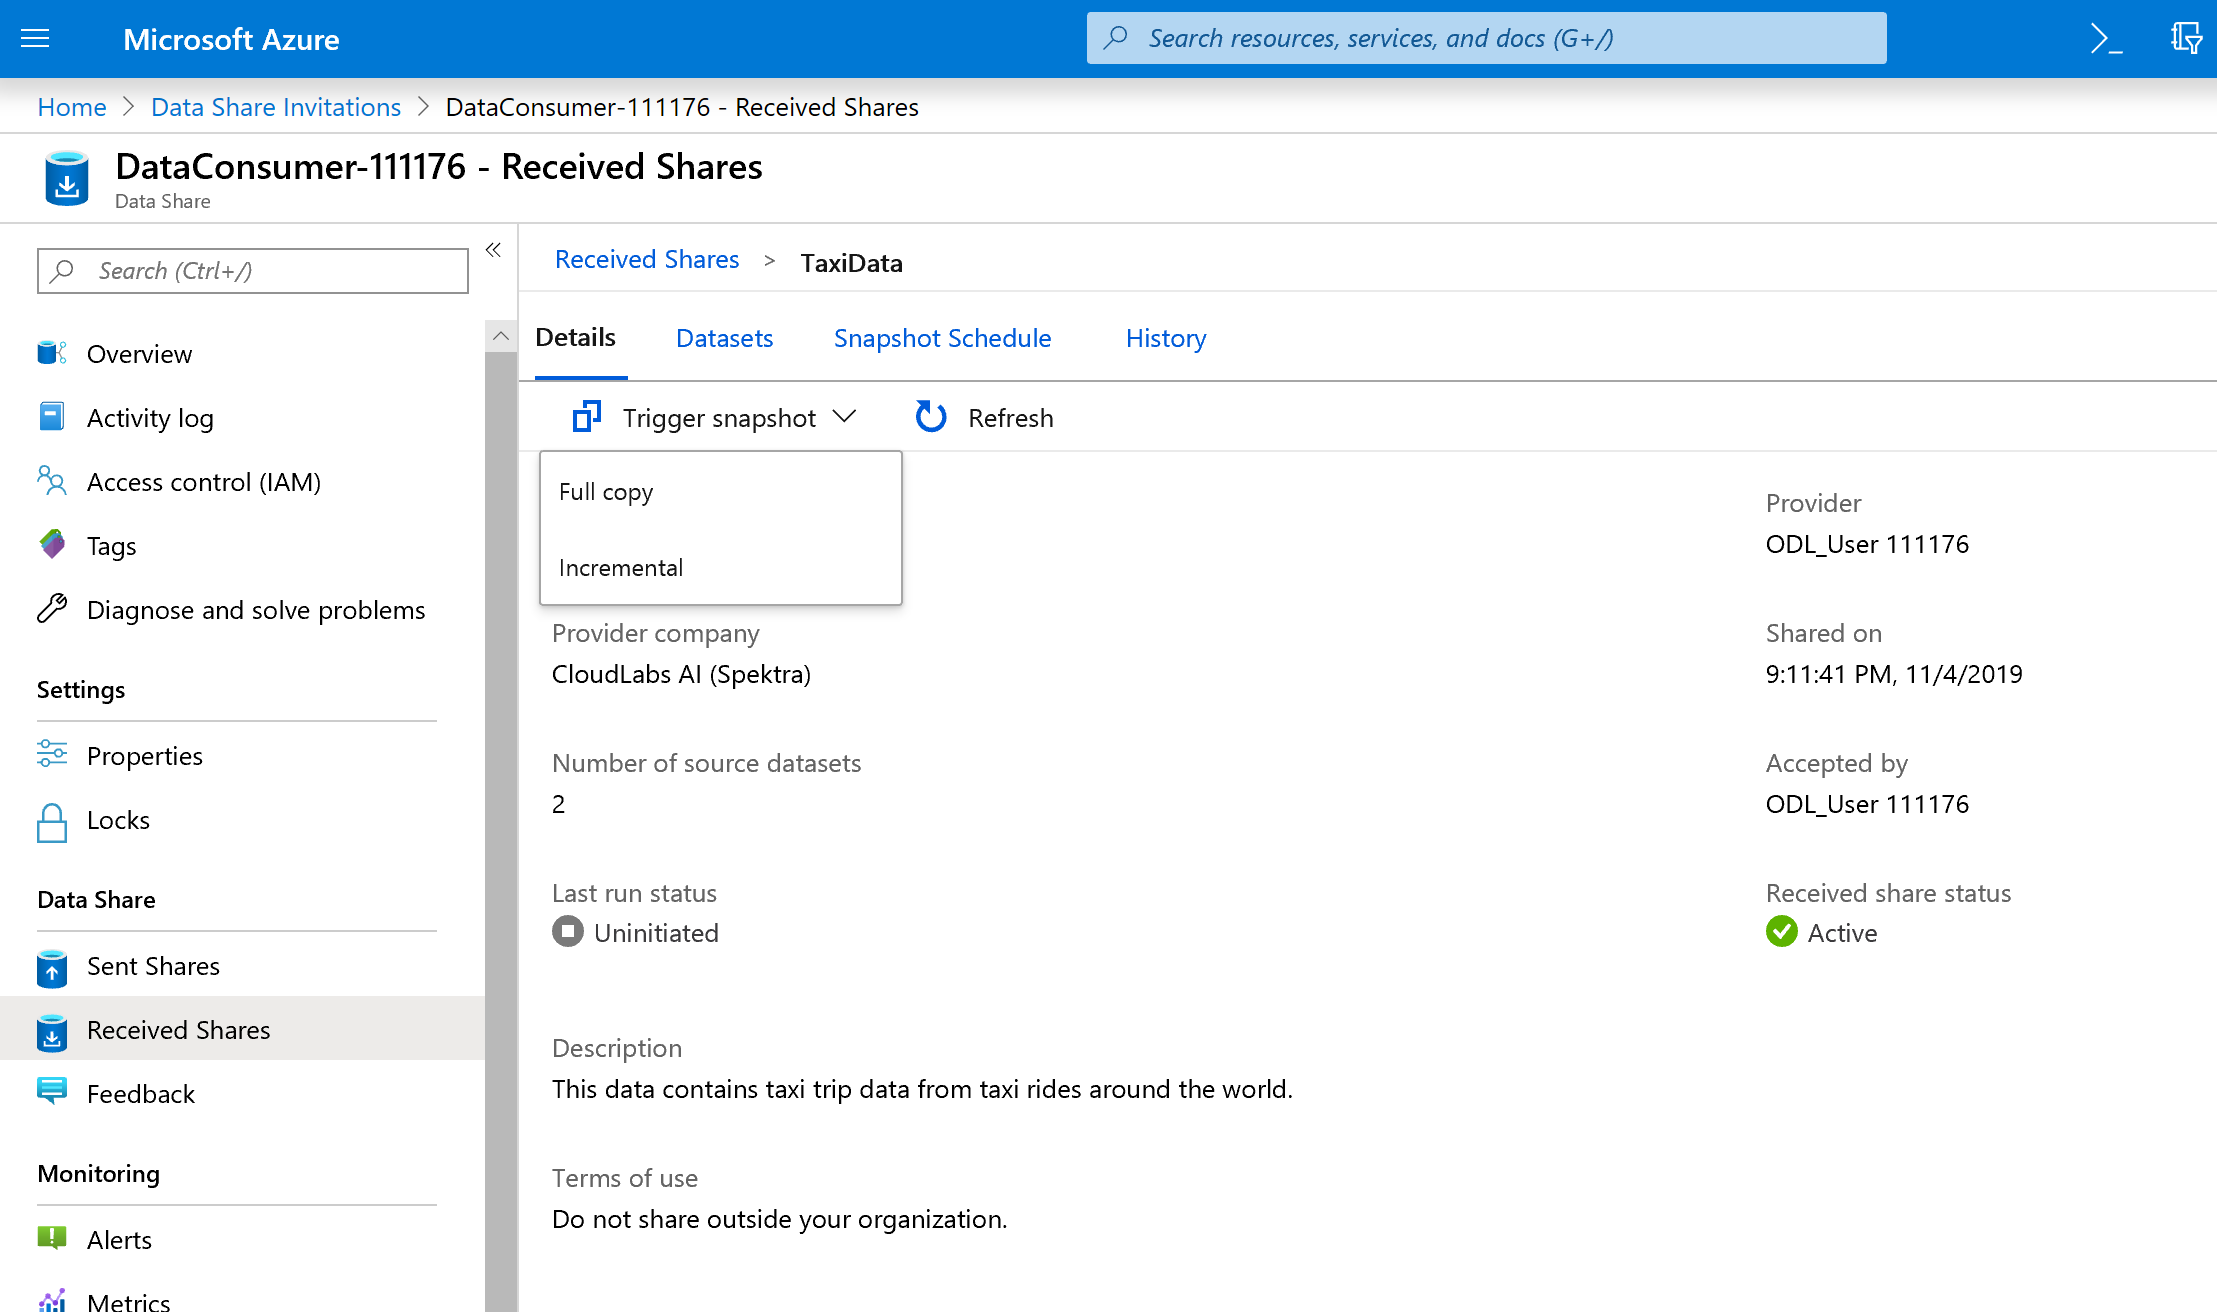
This starts copying data into your new data share account. In a real world scenario, this data would be coming from a third party.
It takes approximately 3-5 minutes for the data to come across. You can monitor progress by selecting on the History tab.
While you wait, navigate to the original data share (DataProvider) and view the status of the Share Subscriptions and History tab. There is now an active subscription, and as a data provider, you can also monitor when the data consumer has started to receive the data shared with them.
Navigate back to the data consumer's data share. Once the status of the trigger is successful, navigate to the destination SQL database and data lake to see that the data has landed in the respective stores.


Congratulations, you have completed the lab!
Related content
Feedback
Coming soon: Throughout 2024 we will be phasing out GitHub Issues as the feedback mechanism for content and replacing it with a new feedback system. For more information see: https://aka.ms/ContentUserFeedback.
Submit and view feedback for