Tutorial: Monitor changes and update a Windows virtual machine in Azure
Applies to: ✔️ Windows VMs ✔️ Flexible scale sets
With Azure Change Tracking and Update Management, you can easily identify changes in your Windows virtual machines in Azure and manage operating system updates for those VMs.
In this tutorial, you learn how to:
- Manage Windows updates.
- Monitor changes and inventory.
Open Azure Cloud Shell
Azure Cloud Shell is a free interactive shell that you can use to run the steps in this article. It has common Azure tools preinstalled and configured to use with your Azure account.
To open any code block in Cloud Shell, just select Try it from the upper-right corner of that code block.
You can also open Cloud Shell in a separate browser tab by going to https://shell.azure.com/powershell. Select Copy to copy code blocks, paste them into the Cloud Shell tab, and select the Enter key to run the code.
Create a virtual machine
To configure Azure monitoring and update management in this tutorial, you need a Windows VM in Azure.
First, set an administrator username and password for the VM with Get-Credential:
$cred = Get-Credential
Next, create the VM with New-AzVM. The following example creates a VM named myVM in the East US location. If they don't already exist, the resource group myResourceGroupMonitor and supporting network resources are created:
New-AzVm `
    -ResourceGroupName "myResourceGroupMonitor" `
    -Name "myVM" `
    -Location "East US" `
    -Credential $cred
It takes a few minutes for the resources and VM to be created.
Manage Windows updates
Update Management helps you manage updates and patches for your Azure Windows VMs. Directly from your VM, you can quickly:
- Assess the status of available updates.
- Schedule installation of required updates.
- Review deployment results to verify updates were successfully applied to the VM.
For pricing information, see Automation pricing for Update management.
Enable Update Management
To enable Update Management for your VM:
- Navigate to your VM in the Azure portal (search for Virtual machines in the search bar, then choose a VM from the list).
- Select Updates under Operations.
- Click on Go to Updates using automation.
- The Enable Update Management window opens.
Validation is done to determine if Update Management is enabled for this VM. Validation includes checks for a Log Analytics workspace, for a linked Automation account, and for whether the solution is in the workspace.
You use a Log Analytics workspace to collect data that is generated by features and services such as Update Management. The workspace provides a single location to review and analyze data from multiple sources.
To perform additional actions on VMs that require updates, you can use Azure Automation to run runbooks against VMs. Such actions include downloading or applying updates.
The validation process also checks to see if the VM is provisioned with the Microsoft Monitoring Agent (MMA) and Automation Hybrid Runbook Worker. You use the agent to communicate with the VM and obtain information about the update status.
In the Enable Update Management window, choose the Log Analytics workspace and automation account, and then select Enable. The solution takes up to 15 minutes to become enabled.
Any of the following prerequisites that are missing during onboarding are automatically added:
- Log Analytics workspace
- Automation
- A Hybrid runbook worker, which is enabled on the VM
After the solution is enabled, the Update management window opens. Configure the location, Log Analytics workspace and Automation account to use, and then select Enable. If these options appear dimmed, another automation solution is enabled for the VM, and that solution's workspace and Automation account must be used.
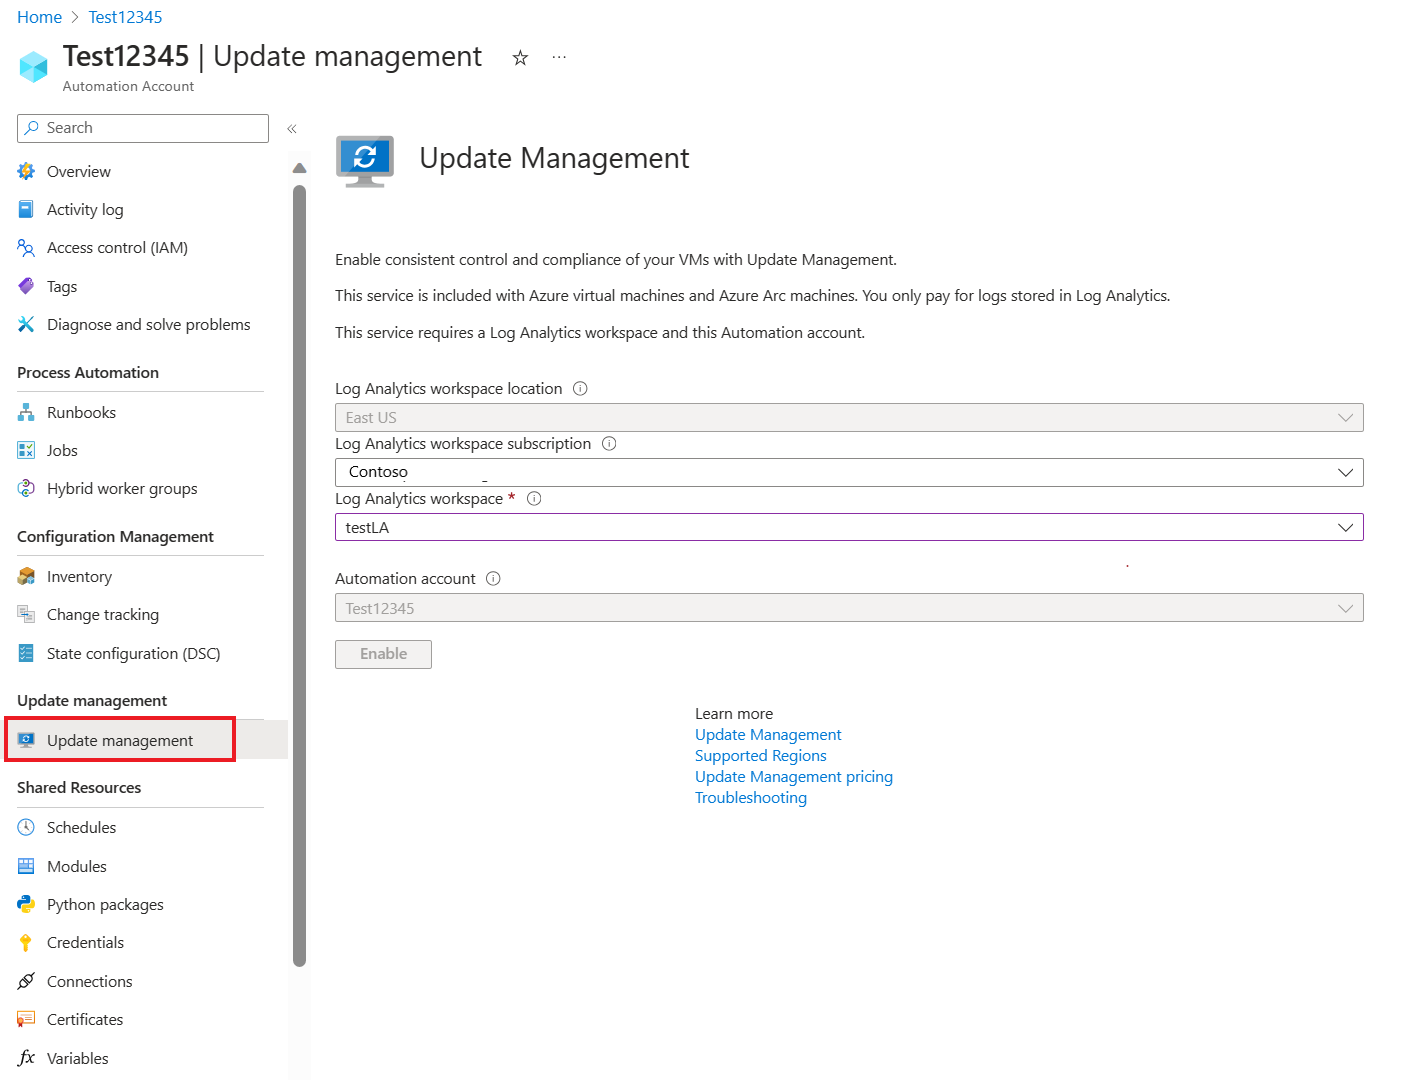
The Update Management solution can take up to 15 minutes to become enabled. During this time, don't close the browser window. After the solution is enabled, information about missing updates on the VM flows to Azure Monitor logs. It can take from 30 minutes to 6 hours for the data to become available for analysis.
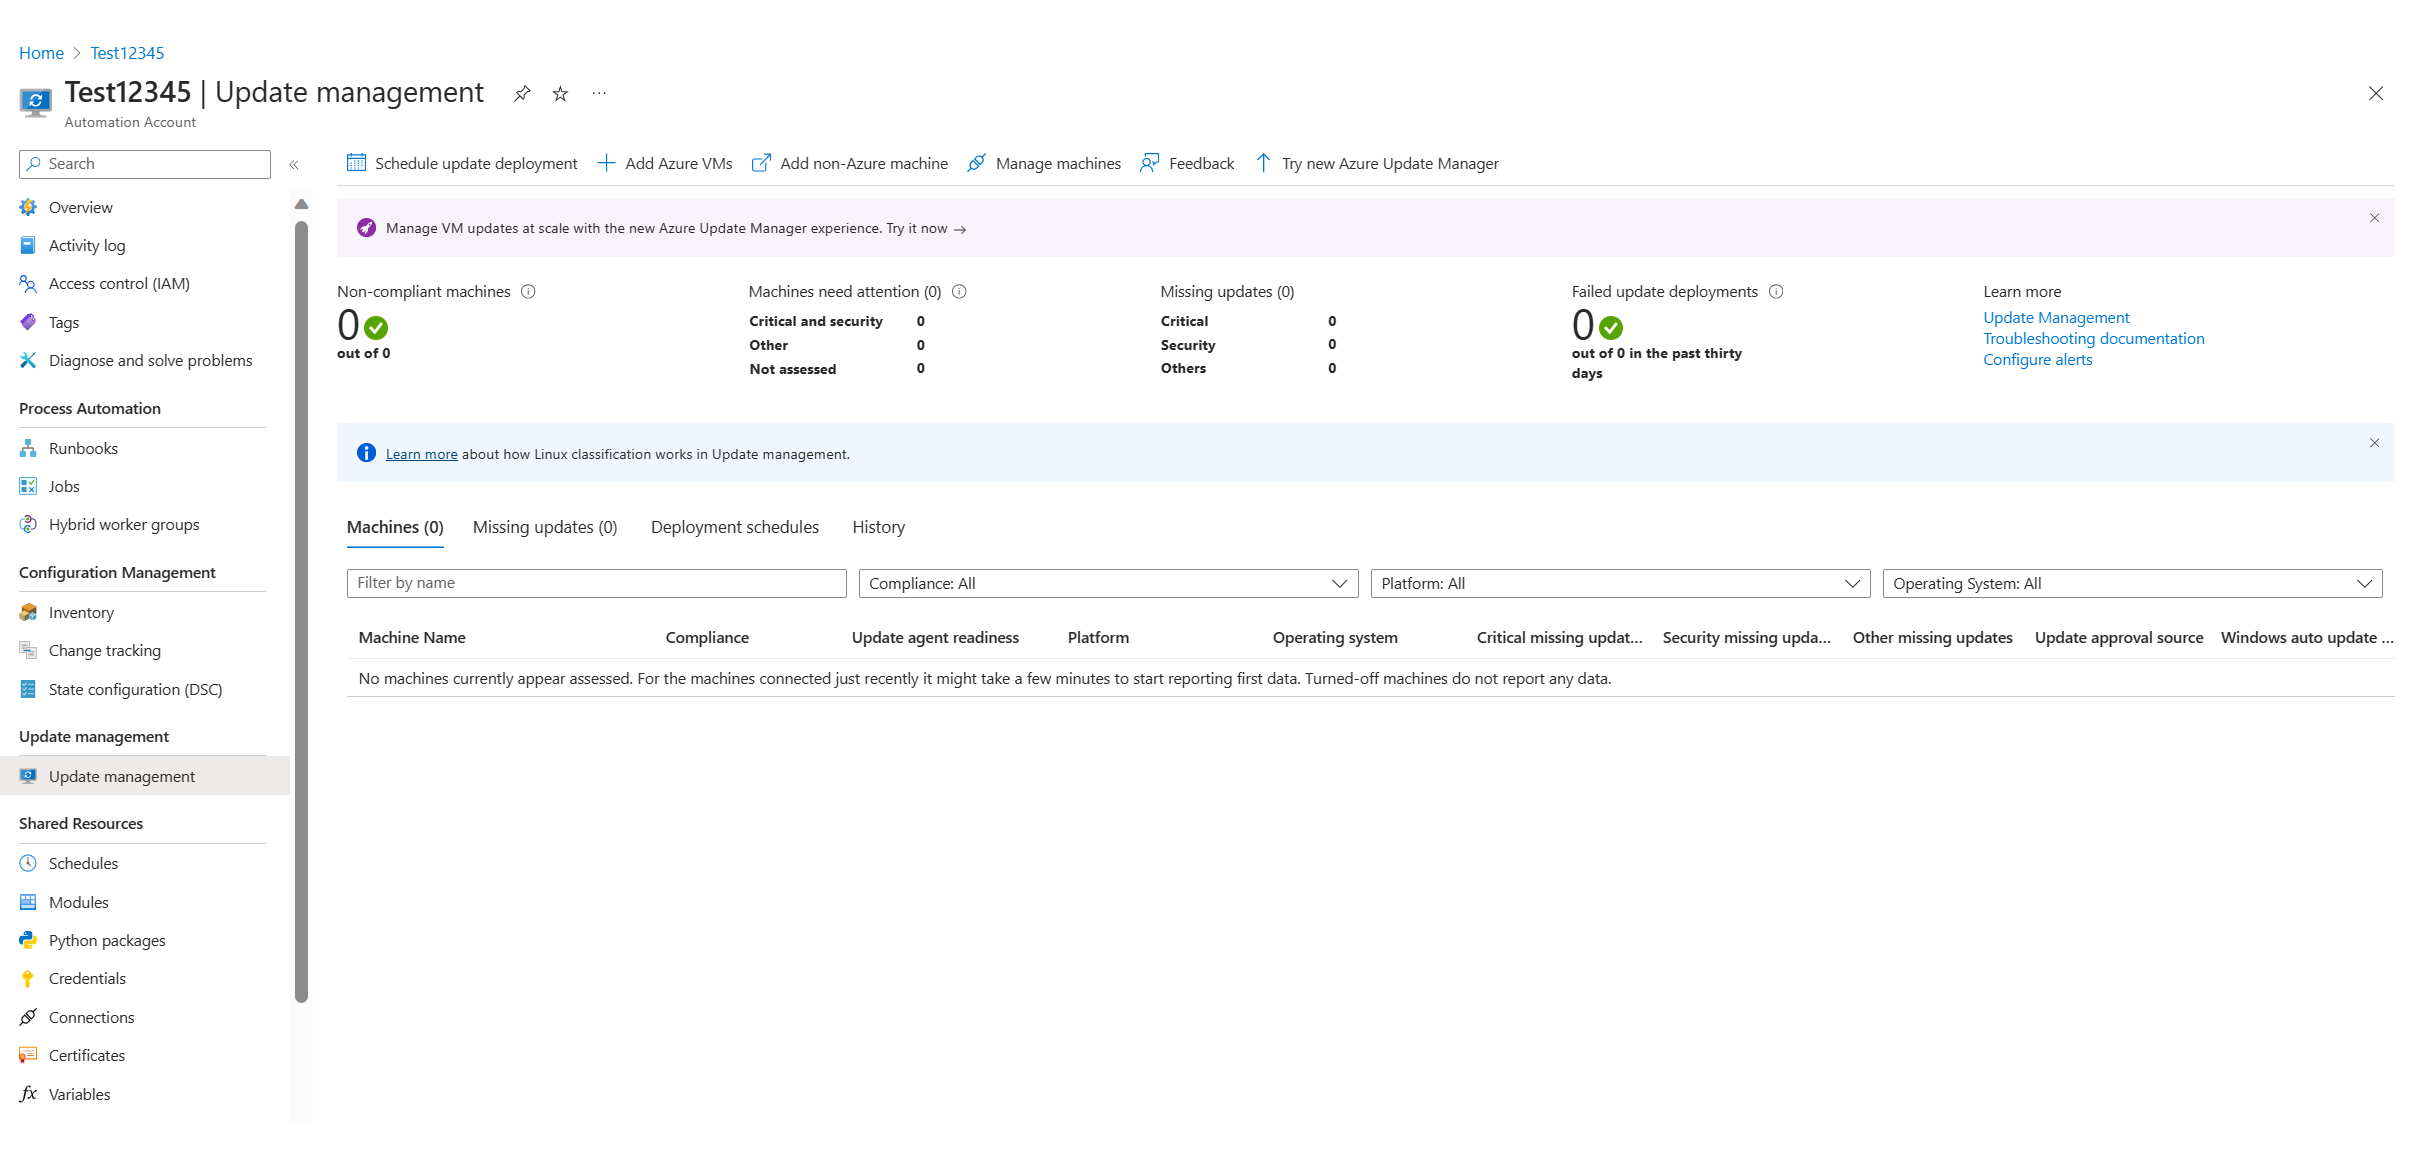
View an update assessment
After Update Management is enabled, the Update management window appears. After the evaluation of updates is finished, you see a list of missing updates on the Missing updates tab.
Schedule an update deployment
To install updates, schedule a deployment that follows your release schedule and service window. You choose which update types to include in the deployment. For example, you can include critical or security updates and exclude update rollups.
To schedule a new update deployment for the VM, select Schedule update deployment at the top of the Update management window. In the New update deployment window, specify the following information:
| Option | Description |
|---|---|
| Name | Enter a unique name to identify the update deployment. |
| Operating system | Select either Linux or Windows. |
| Groups to update | For VMs hosted on Azure, define a query based on a combination of subscription, resource groups, locations, and tags. This query builds a dynamic group of Azure-hosted VMs to include in your deployment. For VMs not hosted on Azure, select an existing saved search. With this search, you can select a group of these VMs to include in the deployment. To learn more, see Dynamic Groups. |
| Machines to update | Select Saved search, Imported group, or Machines. If you select Machines, you can choose individual machines from the drop-down list. The readiness of each machine is shown in the UPDATE AGENT READINESS column of the table. To learn about the different methods of creating computer groups in Azure Monitor logs, see Computer groups in Azure Monitor logs |
| Update classifications | Choose all necessary update classifications. |
| Include/exclude updates | Select this option to open the Include/Exclude pane. Updates to be included and those to be excluded are on separate tabs. For more information on how inclusion is handled, see Schedule an Update Deployment. |
| Schedule settings | Choose the time to start, and select either Once or Recurring. |
| Pre-scripts + Post-scripts | Choose the scripts to run before and after your deployment. |
| Maintenance window | Enter the number of minutes set for updates. Valid values range from 30 to 360 minutes. |
| Reboot control | Select how reboots are handled. Available selections are:
|
After you have finished configuring the schedule, click Create to return to the status dashboard. The Scheduled table shows the deployment schedule you created.
You can also create update deployments programmatically. To learn how to create an update deployment with the REST API, see Software Update Configurations - Create. There's also a sample runbook that you can use to create a weekly update deployment.
View results of an update deployment
After the scheduled deployment starts, you can see the deployment status in the Update deployments tab of the Update management window.
If the deployment is currently running, its status shows as "In progress." After successful completion, the status changes to "Succeeded." But if any updates in the deployment fail, the status is "Partially failed."
Select the completed update deployment to see the dashboard for that deployment.
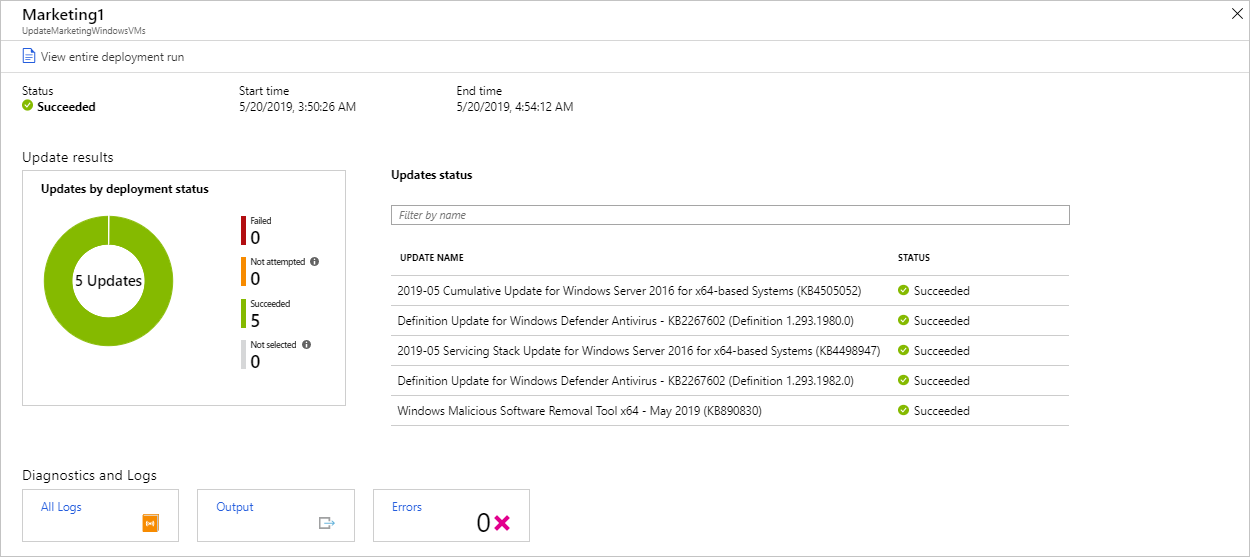
The Update results tile shows a summary of the total number of updates and deployment results on the VM. The table to the right shows a detailed breakdown of each update and the installation results. Each result has one of the following values:
- Not attempted: The update isn't installed. There wasn't enough time available based on the defined maintenance-window duration.
- Succeeded: The update succeeded.
- Failed: The update failed.
Select All logs to see all log entries that the deployment created.
Select the Output tile to see the job stream of the runbook responsible for managing the update deployment on the target VM.
Select Errors to see detailed information about any deployment errors.
Monitor changes and inventory
You can collect and view an inventory of the software, files, Linux daemons, Windows services, and Windows registry keys on your computers. Tracking the configurations of your machines helps you pinpoint operational issues across your environment and better understand the state of your machines.
Enable change and inventory management
To enable change and inventory management for your VM:
- On the leftmost side of the window, select Virtual machines.
- Choose a VM from the list.
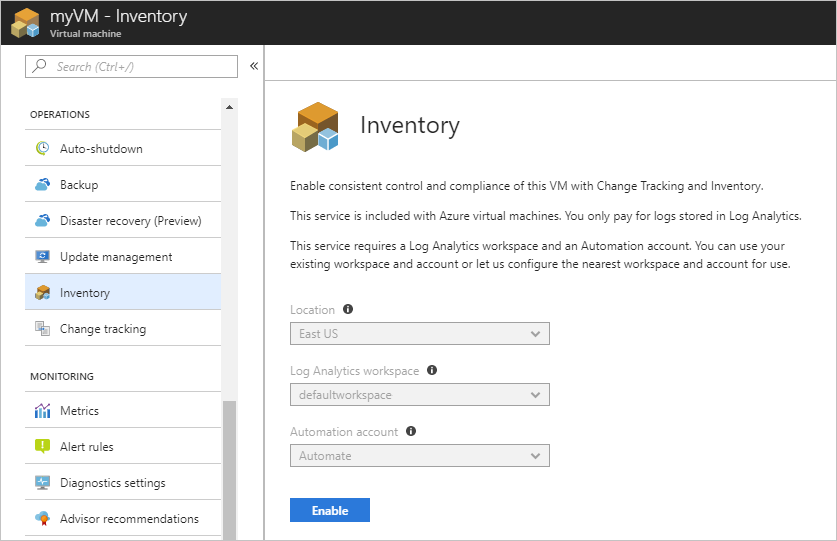
- Under Operations in the VM window, select either Inventory or Change tracking.
- The Enable Change Tracking and Inventory pane opens.
Configure the location, Log Analytics workspace, and Automation account to use, and then select Enable. If the options appear dimmed, an automation solution is already enabled for the VM. In that case, the already enabled workspace and Automation account must be used.
Even though the solutions appear separately in the menu, they're the same solution. Enabling one enables both for your VM.
After the solution has been enabled, it might take some time for inventory to be collected on the VM before data appears.
Track changes
On your VM under OPERATIONS, select Change Tracking and then select Edit Settings. The Change Tracking pane opens. Select the type of setting you want to track and then select + Add to configure the settings.
The available settings options for Windows are:
- Windows Registry
- Windows Files
For detailed information on Change Tracking, see Troubleshoot changes on a VM.
View inventory
On your VM select Inventory under OPERATIONS. On the Software tab, there's a table that shows the software that had been found. The high-level details for each software record appear in the table. These details include the software name, version, publisher, and last refreshed time.

Monitor activity logs and changes
From the Change tracking window on your VM, select Manage Activity Log Connection to open the Azure Activity log pane. Select Connect to connect Change Tracking to the Azure activity log for your VM.
After Change Tracking is enabled, go to the Overview pane for your VM and select Stop to stop your VM. When prompted, select Yes to stop the VM. After the VM is deallocated, select Start to restart your VM.
Stopping and restarting a VM logs an event in its activity log. Go back to the Change tracking pane and select the Events tab at the bottom of the pane. After a while, the events appear in the chart and the table. You can select each event to view detailed information for that event.
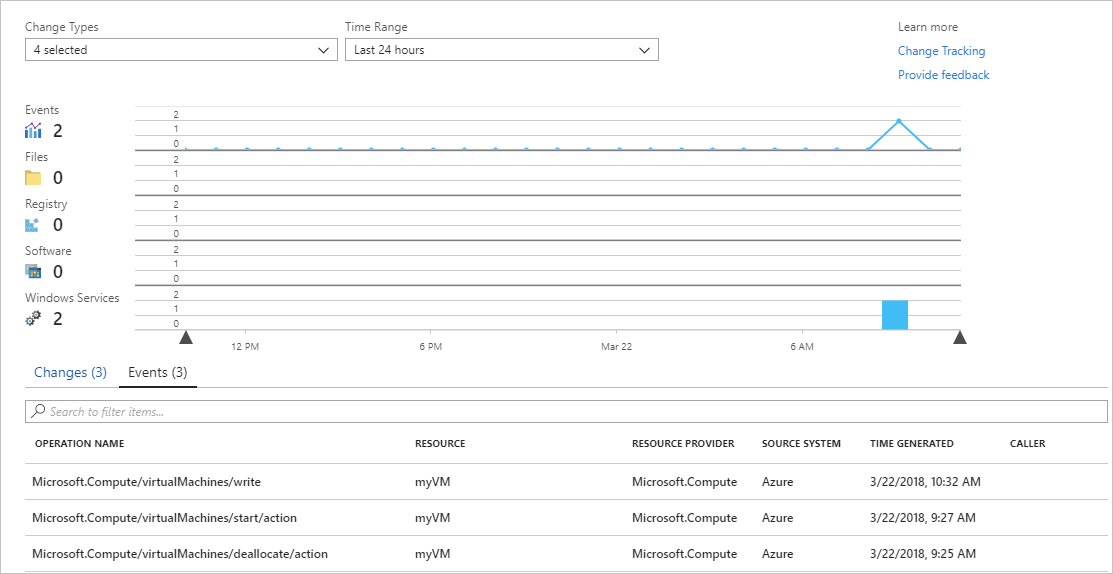
The previous chart shows changes that have occurred over time. After you add an Azure Activity Log connection, the line graph at the top displays Azure Activity Log events.
Each row of bar graphs represents a different trackable change type. These types are Linux daemons, files, Windows registry keys, software, and Windows services. The Change tab shows the change details. Changes appear in the order of when each occurred, with the most recent change shown first.
Next steps
In this tutorial, you configured and reviewed Change Tracking and Update Management for your VM. You learned how to:
- Create a resource group and VM.
- Manage Windows updates.
- Monitor changes and inventory.
Go to the next tutorial to learn about monitoring your VM.
Feedback
Coming soon: Throughout 2024 we will be phasing out GitHub Issues as the feedback mechanism for content and replacing it with a new feedback system. For more information see: https://aka.ms/ContentUserFeedback.
Submit and view feedback for