Configuration options: Azure Monitor Application Insights for Java
This article shows you how to configure Azure Monitor Application Insights for Java.
Connection string and role name
Connection string and role name are the most common settings you need to get started:
{
  "connectionString": "...",
  "role": {
    "name": "my cloud role name"
  }
}
Connection string is required. Role name is important anytime you're sending data from different applications to the same Application Insights resource.
More information and configuration options are provided in the following sections.
Configuration file path
By default, Application Insights Java 3.x expects the configuration file to be named applicationinsights.json, and to be located in the same directory as applicationinsights-agent-3.5.2.jar.
You can specify your own configuration file path by using one of these two options:
APPLICATIONINSIGHTS_CONFIGURATION_FILEenvironment variableapplicationinsights.configuration.fileJava system property
If you specify a relative path, it resolves relative to the directory where applicationinsights-agent-3.5.2.jar is located.
Alternatively, instead of using a configuration file, you can specify the entire content of the JSON configuration via the environment variable APPLICATIONINSIGHTS_CONFIGURATION_CONTENT.
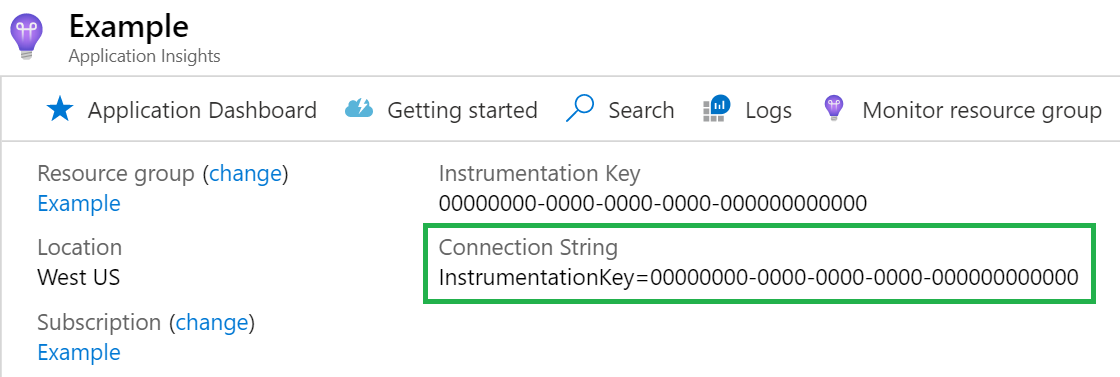
Connection string
Connection string is required. You can find your connection string in your Application Insights resource.
{
  "connectionString": "..."
}
You can also set the connection string by using the environment variable APPLICATIONINSIGHTS_CONNECTION_STRING. It then takes precedence over the connection string specified in the JSON configuration.
Or you can set the connection string by using the Java system property applicationinsights.connection.string. It also takes precedence over the connection string specified in the JSON configuration.
You can also set the connection string by specifying a file to load the connection string from.
If you specify a relative path, it resolves relative to the directory where applicationinsights-agent-3.5.2.jar is located.
{
  "connectionString": "${file:connection-string-file.txt}"
}
The file should contain only the connection string and nothing else.
Not setting the connection string disables the Java agent.
If you have multiple applications deployed in the same Java Virtual Machine (JVM) and want them to send telemetry to different connection strings, see Connection string overrides (preview).
Cloud role name
The cloud role name is used to label the component on the application map.
If you want to set the cloud role name:
{
  "role": {
    "name": "my cloud role name"
  }
}
If the cloud role name isn't set, the Application Insights resource's name is used to label the component on the application map.
You can also set the cloud role name by using the environment variable APPLICATIONINSIGHTS_ROLE_NAME. It then takes precedence over the cloud role name specified in the JSON configuration.
Or you can set the cloud role name by using the Java system property applicationinsights.role.name. It also takes precedence over the cloud role name specified in the JSON configuration.
If you have multiple applications deployed in the same JVM and want them to send telemetry to different cloud role names, see Cloud role name overrides (preview).
Cloud role instance
The cloud role instance defaults to the machine name.
If you want to set the cloud role instance to something different rather than the machine name:
{
  "role": {
    "name": "my cloud role name",
    "instance": "my cloud role instance"
  }
}
You can also set the cloud role instance by using the environment variable APPLICATIONINSIGHTS_ROLE_INSTANCE. It then takes precedence over the cloud role instance specified in the JSON configuration.
Or you can set the cloud role instance by using the Java system property applicationinsights.role.instance.
It also takes precedence over the cloud role instance specified in the JSON configuration.
Sampling
Note
Sampling can be a great way to reduce the cost of Application Insights. Make sure to set up your sampling configuration appropriately for your use case.
Sampling is based on request, which means that if a request is captured (sampled), so are its dependencies, logs, and exceptions.
Sampling is also based on trace ID to help ensure consistent sampling decisions across different services.
Sampling only applies to logs inside of a request. Logs that aren't inside of a request (for example, startup logs) are always collected by default. If you want to sample those logs, you can use Sampling overrides.
Rate-limited sampling
Starting from 3.4.0, rate-limited sampling is available and is now the default.
If no sampling is configured, the default is now rate-limited sampling configured to capture at most (approximately) five requests per second, along with all the dependencies and logs on those requests.
This configuration replaces the prior default, which was to capture all requests. If you still want to capture all requests, use fixed-percentage sampling and set the sampling percentage to 100.
Note
The rate-limited sampling is approximate because internally it must adapt a "fixed" sampling percentage over time to emit accurate item counts on each telemetry record. Internally, the rate-limited sampling is tuned to adapt quickly (0.1 seconds) to new application loads. For this reason, you shouldn't see it exceed the configured rate by much, or for very long.
This example shows how to set the sampling to capture at most (approximately) one request per second:
{
  "sampling": {
    "requestsPerSecond": 1.0
  }
}
The requestsPerSecond can be a decimal, so you can configure it to capture less than one request per second if you want. For example, a value of 0.5 means capture at most one request every 2 seconds.
You can also set the sampling percentage by using the environment variable APPLICATIONINSIGHTS_SAMPLING_REQUESTS_PER_SECOND. It then takes precedence over the rate limit specified in the JSON configuration.
Fixed-percentage sampling
This example shows how to set the sampling to capture approximately a third of all requests:
{
  "sampling": {
    "percentage": 33.333
  }
}
You can also set the sampling percentage by using the environment variable APPLICATIONINSIGHTS_SAMPLING_PERCENTAGE. It then takes precedence over the sampling percentage specified in the JSON configuration.
Note
For the sampling percentage, choose a percentage that's close to 100/N, where N is an integer. Currently, sampling doesn't support other values.
Sampling overrides
Sampling overrides allow you to override the default sampling percentage. For example, you can:
- Set the sampling percentage to 0, or some small value, for noisy health checks.
- Set the sampling percentage to 0, or some small value, for noisy dependency calls.
- Set the sampling percentage to 100 for an important request type. For example, you can use
/logineven though you have the default sampling configured to something lower.
For more information, see the Sampling overrides documentation.
Java Management Extensions metrics
If you want to collect some other Java Management Extensions (JMX) metrics:
{
  "jmxMetrics": [
    {
      "name": "JVM uptime (millis)",
      "objectName": "java.lang:type=Runtime",
      "attribute": "Uptime"
    },
    {
      "name": "MetaSpace Used",
      "objectName": "java.lang:type=MemoryPool,name=Metaspace",
      "attribute": "Usage.used"
    }
  ]
}
In the preceding configuration example:
nameis the metric name that is assigned to this JMX metric (can be anything).objectNameis the Object Name of theJMX MBeanthat you want to collect. Wildcard character asterisk (*) is supported.attributeis the attribute name inside of theJMX MBeanthat you want to collect.
Numeric and Boolean JMX metric values are supported. Boolean JMX metrics are mapped to 0 for false and 1 for true.
For more information, see the JMX metrics documentation.
Custom dimensions
If you want to add custom dimensions to all your telemetry:
{
  "customDimensions": {
    "mytag": "my value",
    "anothertag": "${ANOTHER_VALUE}"
  }
}
You can use ${...} to read the value from the specified environment variable at startup.
Note
Starting from version 3.0.2, if you add a custom dimension named service.version, the value is stored in the application_Version column in the Application Insights Logs table instead of as a custom dimension.
Inherited attribute (preview)
Starting with version 3.2.0, you can set a custom dimension programmatically on your request telemetry. It ensures inheritance by dependency and log telemetry. All are captured in the context of that request.
{
  "preview": {
    "inheritedAttributes": [
      {
        "key": "mycustomer",
        "type": "string"
      }
    ]
  }
}
And then at the beginning of each request, call:
Span.current().setAttribute("mycustomer", "xyz");
Also see: Add a custom property to a Span.
Connection string overrides (preview)
This feature is in preview, starting from 3.4.0.
Connection string overrides allow you to override the default connection string. For example, you can:
- Set one connection string for one HTTP path prefix
/myapp1. - Set another connection string for another HTTP path prefix
/myapp2/.
{
  "preview": {
    "connectionStringOverrides": [
      {
        "httpPathPrefix": "/myapp1",
        "connectionString": "..."
      },
      {
        "httpPathPrefix": "/myapp2",
        "connectionString": "..."
      }
    ]
  }
}
Cloud role name overrides (preview)
This feature is in preview, starting from 3.3.0.
Cloud role name overrides allow you to override the default cloud role name. For example, you can:
- Set one cloud role name for one HTTP path prefix
/myapp1. - Set another cloud role name for another HTTP path prefix
/myapp2/.
{
  "preview": {
    "roleNameOverrides": [
      {
        "httpPathPrefix": "/myapp1",
        "roleName": "Role A"
      },
      {
        "httpPathPrefix": "/myapp2",
        "roleName": "Role B"
      }
    ]
  }
}
Connection string configured at runtime
Starting from version 3.4.8, if you need the ability to configure the connection string at runtime, add this property to your json configuration:
{
  "connectionStringConfiguredAtRuntime": true
}
Add applicationinsights-core to your application:
<dependency>
  <groupId>com.microsoft.azure</groupId>
  <artifactId>applicationinsights-core</artifactId>
  <version>3.5.2</version>
</dependency>
Use the static configure(String) method in the class
com.microsoft.applicationinsights.connectionstring.ConnectionString.
Note
Any telemetry that is captured prior to configuring the connection string will be dropped, so it is best to configure it as early as possible in your application startup.
Autocollect InProc dependencies (preview)
Starting from version 3.2.0, if you want to capture controller "InProc" dependencies, use the following configuration:
{
  "preview": {
    "captureControllerSpans": true
  }
}
Browser SDK Loader (preview)
This feature automatically injects the Browser SDK Loader into your application's HTML pages, including configuring the appropriate Connection String.
For example, when your java application returns a response like:
<!DOCTYPE html>
<html lang="en">
  <head>
    <title>Title</title>
  </head>
  <body>
  </body>
</html>
It automatically modifies to return:
<!DOCTYPE html>
<html lang="en">
  <head>
    <script type="text/javascript">
    !function(v,y,T){var S=v.location,k="script"
    <!-- Removed for brevity -->
    connectionString: "YOUR_CONNECTION_STRING"
    <!-- Removed for brevity --> }});
    </script>
    <title>Title</title>
  </head>
  <body>
  </body>
</html>
The script is aiming at helping customers to track the web user data, and sent the collecting server-side telemetry back to users' Azure portal. Details can be found at ApplicationInsights-JS.
If you want to enable this feature, add the below configuration option:
{
  "preview": {
    "browserSdkLoader": {
      "enabled": true
    }
  }
}
Telemetry processors (preview)
You can use telemetry processors to configure rules that are applied to request, dependency, and trace telemetry. For example, you can:
- Mask sensitive data.
- Conditionally add custom dimensions.
- Update the span name, which is used to aggregate similar telemetry in the Azure portal.
- Drop specific span attributes to control ingestion costs.
For more information, see the Telemetry processor documentation.
Note
If you want to drop specific (whole) spans for controlling ingestion cost, see Sampling overrides.
Autocollected logging
Log4j, Logback, JBoss Logging, and java.util.logging are autoinstrumented. Logging performed via these logging frameworks is autocollected.
Logging is only captured if it:
- Meets the configured level for the logging framework.
- Also meets the configured level for Application Insights.
For example, if your logging framework is configured to log WARN (and you configured it as described earlier) from the package com.example,
and Application Insights is configured to capture INFO (and you configured as described), Application Insights only captures WARN (and more severe) from the package com.example.
The default level configured for Application Insights is INFO. If you want to change this level:
{
  "instrumentation": {
    "logging": {
      "level": "WARN"
    }
  }
}
You can also set the level by using the environment variable APPLICATIONINSIGHTS_INSTRUMENTATION_LOGGING_LEVEL. It then takes precedence over the level specified in the JSON configuration.
You can use these valid level values to specify in the applicationinsights.json file. The table shows how they correspond to logging levels in different logging frameworks.
| Level | Log4j | Logback | JBoss | JUL |
|---|---|---|---|---|
| OFF | OFF | OFF | OFF | OFF |
| FATAL | FATAL | ERROR | FATAL | SEVERE |
| ERROR (or SEVERE) | ERROR | ERROR | ERROR | SEVERE |
| WARN (or WARNING) | WARN | WARN | WARN | WARNING |
| INFO | INFO | INFO | INFO | INFO |
| CONFIG | DEBUG | DEBUG | DEBUG | CONFIG |
| DEBUG (or FINE) | DEBUG | DEBUG | DEBUG | FINE |
| FINER | DEBUG | DEBUG | DEBUG | FINER |
| TRACE (or FINEST) | TRACE | TRACE | TRACE | FINEST |
| ALL | ALL | ALL | ALL | ALL |
Note
If an exception object is passed to the logger, the log message (and exception object details) will show up in the Azure portal under the exceptions table instead of the traces table. If you want to see the log messages across both the traces and exceptions tables, you can write a Logs (Kusto) query to union across them. For example:
union traces, (exceptions | extend message = outerMessage)
| project timestamp, message, itemType
Log markers (preview)
Starting from 3.4.2, you can capture the log markers for Logback and Log4j 2:
{
  "preview": {
    "captureLogbackMarker":  true,
    "captureLog4jMarker":  true
  }
}
Other log attributes for Logback (preview)
Starting from 3.4.3, you can capture FileName, ClassName, MethodName, and LineNumber, for Logback:
{
  "preview": {
    "captureLogbackCodeAttributes": true
  }
}
Warning
Capturing code attributes might add a performance overhead.
Logging level as a custom dimension
Starting from version 3.3.0, LoggingLevel isn't captured by default as part of the Traces custom dimension because that data is already captured in the SeverityLevel field.
If needed, you can temporarily re-enable the previous behavior:
{
  "preview": {
    "captureLoggingLevelAsCustomDimension": true
  }
}
Autocollected Micrometer metrics (including Spring Boot Actuator metrics)
If your application uses Micrometer, metrics that are sent to the Micrometer global registry are autocollected.
Also, if your application uses Spring Boot Actuator, metrics configured by Spring Boot Actuator are also autocollected.
To send custom metrics using micrometer:
Add Micrometer to your application as shown in the following example.
<dependency>
  <groupId>io.micrometer</groupId>
  <artifactId>micrometer-core</artifactId>
  <version>1.6.1</version>
</dependency>
Use the Micrometer global registry to create a meter as shown in the following example.
static final Counter counter = Metrics.counter("test.counter");Use the counter to record metrics by using the following command.
counter.increment();The metrics are ingested into the customMetrics table, with tags captured in the
customDimensionscolumn. You can also view the metrics in the metrics explorer under theLog-based metricsmetric namespace.Note
Application Insights Java replaces all non-alphanumeric characters (except dashes) in the Micrometer metric name with underscores. As a result, the preceding
test.countermetric will show up astest_counter.
To disable autocollection of Micrometer metrics and Spring Boot Actuator metrics:
Note
Custom metrics are billed separately and might generate extra costs. Make sure to check the Pricing information. To disable the Micrometer and Spring Boot Actuator metrics, add the following configuration to your config file.
{
  "instrumentation": {
    "micrometer": {
      "enabled": false
    }
  }
}
Java Database Connectivity query masking
Literal values in Java Database Connectivity (JDBC) queries are masked by default to avoid accidentally capturing sensitive data.
Starting from 3.4.0, this behavior can be disabled. For example:
{
  "instrumentation": {
    "jdbc": {
      "masking": {
        "enabled": false
      }
    }
  }
}
Mongo query masking
Literal values in Mongo queries are masked by default to avoid accidentally capturing sensitive data.
Starting from 3.4.0, this behavior can be disabled. For example:
{
  "instrumentation": {
    "mongo": {
      "masking": {
        "enabled": false
      }
    }
  }
}
HTTP headers
Starting from version 3.3.0, you can capture request and response headers on your server (request) telemetry:
{
  "preview": {
    "captureHttpServerHeaders": {
      "requestHeaders": [
        "My-Header-A"
      ],
      "responseHeaders": [
        "My-Header-B"
      ]
    }
  }
}
The header names are case insensitive.
The preceding examples are captured under the property names http.request.header.my_header_a and
http.response.header.my_header_b.
Similarly, you can capture request and response headers on your client (dependency) telemetry:
{
  "preview": {
    "captureHttpClientHeaders": {
      "requestHeaders": [
        "My-Header-C"
      ],
      "responseHeaders": [
        "My-Header-D"
      ]
    }
  }
}
Again, the header names are case insensitive. The preceding examples are captured under the property names
http.request.header.my_header_c and http.response.header.my_header_d.
HTTP server 4xx response codes
By default, HTTP server requests that result in 4xx response codes are captured as errors.
Starting from version 3.3.0, you can change this behavior to capture them as success:
{
  "preview": {
    "captureHttpServer4xxAsError": false
  }
}
Suppress specific autocollected telemetry
Starting from version 3.0.3, specific autocollected telemetry can be suppressed by using these configuration options:
{
  "instrumentation": {
    "azureSdk": {
      "enabled": false
    },
    "cassandra": {
      "enabled": false
    },
    "jdbc": {
      "enabled": false
    },
    "jms": {
      "enabled": false
    },
    "kafka": {
      "enabled": false
    },
    "micrometer": {
      "enabled": false
    },
    "mongo": {
      "enabled": false
    },
    "quartz": {
      "enabled": false
    },
    "rabbitmq": {
      "enabled": false
    },
    "redis": {
      "enabled": false
    },
    "springScheduling": {
      "enabled": false
    }
  }
}
You can also suppress these instrumentations by setting these environment variables to false:
APPLICATIONINSIGHTS_INSTRUMENTATION_AZURE_SDK_ENABLEDAPPLICATIONINSIGHTS_INSTRUMENTATION_CASSANDRA_ENABLEDAPPLICATIONINSIGHTS_INSTRUMENTATION_JDBC_ENABLEDAPPLICATIONINSIGHTS_INSTRUMENTATION_JMS_ENABLEDAPPLICATIONINSIGHTS_INSTRUMENTATION_KAFKA_ENABLEDAPPLICATIONINSIGHTS_INSTRUMENTATION_MICROMETER_ENABLEDAPPLICATIONINSIGHTS_INSTRUMENTATION_MONGO_ENABLEDAPPLICATIONINSIGHTS_INSTRUMENTATION_RABBITMQ_ENABLEDAPPLICATIONINSIGHTS_INSTRUMENTATION_REDIS_ENABLEDAPPLICATIONINSIGHTS_INSTRUMENTATION_SPRING_SCHEDULING_ENABLED
These variables then take precedence over the enabled variables specified in the JSON configuration.
Note
If you're looking for more fine-grained control, for example, to suppress some redis calls but not all redis calls, see Sampling overrides.
Preview instrumentations
Starting from version 3.2.0, you can enable the following preview instrumentations:
{
  "preview": {
    "instrumentation": {
      "akka": {
        "enabled": true
      },
      "apacheCamel": {
        "enabled": true
      },
      "grizzly": {
        "enabled": true
      },
      "ktor": {
        "enabled": true
      },
      "play": {
        "enabled": true
      },
      "r2dbc": {
        "enabled": true
      },
      "springIntegration": {
        "enabled": true
      },
      "vertx": {
        "enabled": true
      }
    }
  }
}
Note
Akka instrumentation is available starting from version 3.2.2. Vertx HTTP Library instrumentation is available starting from version 3.3.0.
Metric interval
By default, metrics are captured every 60 seconds.
Starting from version 3.0.3, you can change this interval:
{
  "metricIntervalSeconds": 300
}
Starting from 3.4.9 GA, you can also set the metricIntervalSeconds by using the environment variable APPLICATIONINSIGHTS_METRIC_INTERVAL_SECONDS. It then takes precedence over the metricIntervalSeconds specified in the JSON configuration.
The setting applies to the following metrics:
- Default performance counters: For example, CPU and memory
- Default custom metrics: For example, garbage collection timing
- Configured JMX metrics: See the JMX metric section
- Micrometer metrics: See the Autocollected Micrometer metrics section
Heartbeat
By default, Application Insights Java 3.x sends a heartbeat metric once every 15 minutes. If you're using the heartbeat metric to trigger alerts, you can increase the frequency of this heartbeat:
{
  "heartbeat": {
    "intervalSeconds": 60
  }
}
Note
You can't increase the interval to longer than 15 minutes because the heartbeat data is also used to track Application Insights usage.
Authentication
Note
The authentication feature is GA since version 3.4.17.
You can use authentication to configure the agent to generate token credentials that are required for Microsoft Entra authentication. For more information, see the Authentication documentation.
HTTP proxy
If your application is behind a firewall and can't connect directly to Application Insights, refer to IP addresses used by Application Insights.
To work around this issue, you can configure Application Insights Java 3.x to use an HTTP proxy.
{
  "proxy": {
    "host": "myproxy",
    "port": 8080
  }
}
You can also set the http proxy using the environment variable APPLICATIONINSIGHTS_PROXY, which takes the format https://<host>:<port>. It then takes precedence over the proxy specified in the JSON configuration.
Application Insights Java 3.x also respects the global https.proxyHost and https.proxyPort system properties if they're set, and http.nonProxyHosts, if needed.
Recovery from ingestion failures
When sending telemetry to the Application Insights service fails, Application Insights Java 3.x stores the telemetry to disk and continues retrying from disk.
The default limit for disk persistence is 50 Mb. If you have high telemetry volume or need to be able to recover from longer network or ingestion service outages, you can increase this limit starting from version 3.3.0:
{
  "preview": {
    "diskPersistenceMaxSizeMb": 50
  }
}
Self-diagnostics
"Self-diagnostics" refers to internal logging from Application Insights Java 3.x. This functionality can be helpful for spotting and diagnosing issues with Application Insights itself.
By default, Application Insights Java 3.x logs at level INFO to both the file applicationinsights.log
and the console, corresponding to this configuration:
{
  "selfDiagnostics": {
    "destination": "file+console",
    "level": "INFO",
    "file": {
      "path": "applicationinsights.log",
      "maxSizeMb": 5,
      "maxHistory": 1
    }
  }
}
In the preceding configuration example:
levelcan be one ofOFF,ERROR,WARN,INFO,DEBUG, orTRACE.pathcan be an absolute or relative path. Relative paths are resolved against the directory whereapplicationinsights-agent-3.5.2.jaris located.
Starting from version 3.0.2, you can also set the self-diagnostics level by using the environment variable
APPLICATIONINSIGHTS_SELF_DIAGNOSTICS_LEVEL. It then takes precedence over the self-diagnostics level specified in the JSON configuration.
Starting from version 3.0.3, you can also set the self-diagnostics file location by using the environment variable APPLICATIONINSIGHTS_SELF_DIAGNOSTICS_FILE_PATH. It then takes precedence over the self-diagnostics file path specified in the JSON configuration.
An example
This example shows what a configuration file looks like with multiple components. Configure specific options based on your needs.
{
  "connectionString": "...",
  "role": {
    "name": "my cloud role name"
  },
  "sampling": {
    "percentage": 100
  },
  "jmxMetrics": [
  ],
  "customDimensions": {
  },
  "instrumentation": {
    "logging": {
      "level": "INFO"
    },
    "micrometer": {
      "enabled": true
    }
  },
  "proxy": {
  },
  "preview": {
    "processors": [
    ]
  },
  "selfDiagnostics": {
    "destination": "file+console",
    "level": "INFO",
    "file": {
      "path": "applicationinsights.log",
      "maxSizeMb": 5,
      "maxHistory": 1
    }
  }
}
Feedback
Coming soon: Throughout 2024 we will be phasing out GitHub Issues as the feedback mechanism for content and replacing it with a new feedback system. For more information see: https://aka.ms/ContentUserFeedback.
Submit and view feedback for