How-to: Onboard your metric data to Metrics Advisor
Important
Starting on the 20th of September, 2023 you won’t be able to create new Metrics Advisor resources. The Metrics Advisor service is being retired on the 1st of October, 2026.
Use this article to learn about onboarding your data to Metrics Advisor.
Data schema requirements and configuration
Azure AI Metrics Advisor is a service for time series anomaly detection, diagnostics, and analysis. As an AI-powered service, it uses your data to train the model used. The service accepts tables of aggregated data with the following columns:
- Measure (required): A measure is a fundamental or unit-specific term and a quantifiable value of the metric. It means one or more columns containing numeric values.
- Timestamp (optional): Zero or one column, with type of
DateTimeorString. When this column isn't set, the timestamp is set as the start time of each ingestion period. Format the timestamp as follows:yyyy-MM-ddTHH:mm:ssZ. - Dimension (optional): A dimension is one or more categorical values. The combination of those values identifies a particular univariate time series (for example, country/region, language, and tenant). The dimension columns can be of any data type. Be cautious when working with large volumes of columns and values, to prevent excessive numbers of dimensions from being processed.
If you're using data sources such as Azure Data Lake Storage or Azure Blob Storage, you can aggregate your data to align with your expected metrics schema. This is because these data sources use a file as metrics input.
If you're using data sources such as Azure SQL or Azure Data Explorer, you can use aggregation functions to aggregate data into your expected schema. This is because these data sources support running a query to get metrics data from sources.
If you are not sure about some of the terms, refer to Glossary.
Avoid loading partial data
Partial data is caused by inconsistencies between the data stored in Metrics Advisor and the data source. This can happen when the data source is updated after Metrics Advisor has finished pulling data. Metrics Advisor only pulls data from a given data source once.
For example, if a metric has been onboarded to Metrics Advisor for monitoring. Metrics Advisor successfully grabs metric data at timestamp A and performs anomaly detection on it. However, if the metric data of that particular timestamp A has been refreshed after the data has been ingested. New data value won't be retrieved.
You can try to backfill historical data (described later) to mitigate inconsistencies but this won't trigger new anomaly alerts, if alerts for those time points have already been triggered. This process may add additional workload to the system, and is not automatic.
To avoid loading partial data, we recommend two approaches:
Generate data in one transaction:
Ensure the metric values for all dimension combinations at the same timestamp are stored to the data source in one transaction. In the above example, wait until data from all data sources is ready, and then load it into Metrics Advisor in one transaction. Metrics Advisor can poll the data feed regularly until data is successfully (or partially) retrieved.
Delay data ingestion by setting a proper value for the Ingestion time offset parameter:
Set the Ingestion time offset parameter for your data feed to delay the ingestion until the data is fully prepared. This can be useful for some data sources which don't support transactions such as Azure Table Storage. See advanced settings for details.
Start by adding a data feed
After signing into your Metrics Advisor portal and choosing your workspace, click Get started. Then, on the main page of the workspace, click Add data feed from the left menu.
Add connection settings
1. Basic settings
Next you'll input a set of parameters to connect your time-series data source.
- Source Type: The type of data source where your time series data is stored.
- Granularity: The interval between consecutive data points in your time series data. Currently Metrics Advisor supports: Yearly, Monthly, Weekly, Daily, Hourly, per minute, and Custom. The lowest interval the customization option supports is 60 seconds.
- Seconds: The number of seconds when granularityName is set to Customize.
- Ingest data since (UTC): The baseline start time for data ingestion.
startOffsetInSecondsis often used to add an offset to help with data consistency.
2. Specify connection string
Next, you'll need to specify the connection information for the data source. For details on the other fields and connecting different types of data sources, see How-to: Connect different data sources.
3. Specify query for a single timestamp
For details of different types of data sources, see How-to: Connect different data sources.
Load data
After the connection string and query string are inputted, select Load data. Within this operation, Metrics Advisor will check connection and permission to load data, check necessary parameters (@IntervalStart and @IntervalEnd) which need to be used in query, and check the column name from data source.
If there's an error at this step:
- First check if the connection string is valid.
- Then check if there's sufficient permissions and that the ingestion worker IP address is granted access.
- Then check if required parameters (@IntervalStart and @IntervalEnd) are used in your query.
Schema configuration
Once the data schema is loaded, select the appropriate fields.
If the timestamp of a data point is omitted, Metrics Advisor will use the timestamp when the data point is ingested instead. For each data feed, you can specify at most one column as a timestamp. If you get a message that a column cannot be specified as a timestamp, check your query or data source, and whether there are multiple timestamps in the query result - not only in the preview data. When performing data ingestion, Metrics Advisor can only consume one chunk (for example one day, one hour - according to the granularity) of time-series data from the given source each time.
| Selection | Description | Notes |
|---|---|---|
| Display Name | Name to be displayed in your workspace instead of the original column name. | Optional. |
| Timestamp | The timestamp of a data point. If omitted, Metrics Advisor will use the timestamp when the data point is ingested instead. For each data feed, you can specify at most one column as timestamp. | Optional. Should be specified with at most one column. If you get a column cannot be specified as Timestamp error, check your query or data source for duplicate timestamps. |
| Measure | The numeric values in the data feed. For each data feed, you can specify multiple measures but at least one column should be selected as measure. | Should be specified with at least one column. |
| Dimension | Categorical values. A combination of different values identifies a particular single-dimension time series, for example: country/region, language, tenant. You can select zero or more columns as dimensions. Note: be cautious when selecting a non-string column as a dimension. | Optional. |
| Ignore | Ignore the selected column. | Optional. For data sources support using a query to get data, there is no 'Ignore' option. |
If you want to ignore columns, we recommend updating your query or data source to exclude those columns. You can also ignore columns using Ignore columns and then Ignore on the specific columns. If a column should be a dimension and is mistakenly set as Ignored, Metrics Advisor may end up ingesting partial data. For example, assume the data from your query is as below:
| Row ID | Timestamp | Country/Region | Language | Income |
|---|---|---|---|---|
| 1 | 2019/11/10 | China | ZH-CN | 10000 |
| 2 | 2019/11/10 | China | EN-US | 1000 |
| 3 | 2019/11/10 | US | ZH-CN | 12000 |
| 4 | 2019/11/11 | US | EN-US | 23000 |
| ... | ... | ... | ... | ... |
If Country is a dimension and Language is set as Ignored, then the first and second rows will have the same dimensions for a timestamp. Metrics Advisor will arbitrarily use one value from the two rows. Metrics Advisor will not aggregate the rows in this case.
After configuring the schema, select Verify schema. Within this operation, Metrics Advisor will perform following checks:
- Whether timestamp of queried data falls into one single interval.
- Whether there's duplicate values returned for the same dimension combination within one metric interval.
Automatic roll up settings
Important
If you'd like to enable root cause analysis and other diagnostic capabilities, the Automatic roll up settings need to be configured. Once enabled, the automatic roll-up settings cannot be changed.
Metrics Advisor can automatically perform aggregation(for example SUM, MAX, MIN) on each dimension during ingestion, then builds a hierarchy which will be used in root case analysis and other diagnostic features.
Consider the following scenarios:
"I do not need to include the roll-up analysis for my data."
You do not need to use the Metrics Advisor roll-up.
"My data has already rolled up and the dimension value is represented by: NULL or Empty (Default), NULL only, Others."
This option means Metrics Advisor doesn't need to roll up the data because the rows are already summed. For example, if you select NULL only, then the second data row in the below example will be seen as an aggregation of all countries and language EN-US; the fourth data row which has an empty value for Country however will be seen as an ordinary row which might indicate incomplete data.
Country/Region Language Income China ZH-CN 10000 (NULL) EN-US 999999 US EN-US 12000 EN-US 5000 "I need Metrics Advisor to roll up my data by calculating Sum/Max/Min/Avg/Count and represent it by {some string}."
Some data sources such as Azure Cosmos DB or Azure Blob Storage do not support certain calculations like group by or cube. Metrics Advisor provides the roll up option to automatically generate a data cube during ingestion. This option means you need Metrics Advisor to calculate the roll-up using the algorithm you've selected and use the specified string to represent the roll-up in Metrics Advisor. This won't change any data in your data source. For example, suppose you have a set of time series which stands for Sales metrics with the dimension (Country, Region). For a given timestamp, it might look like the following:
Country Region Sales Canada Alberta 100 Canada British Columbia 500 United States Montana 100 After enabling Auto Roll Up with Sum, Metrics Advisor will calculate the dimension combinations, and sum the metrics during data ingestion. The result might be:
Country Region Sales Canada Alberta 100 NULL Alberta 100 Canada British Columbia 500 NULL British Columbia 500 United States Montana 100 NULL Montana 100 NULL NULL 700 Canada NULL 600 United States NULL 100 (Country=Canada, Region=NULL, Sales=600)means the sum of Sales in Canada (all regions) is 600.The following is the transformation in SQL language.
SELECT
    dimension_1,
    dimension_2,
    ...
    dimension_n,
    sum (metrics_1) AS metrics_1,
    sum (metrics_2) AS metrics_2,
    ...
    sum (metrics_n) AS metrics_n
FROM
    each_timestamp_data
GROUP BY
    CUBE (dimension_1, dimension_2, ..., dimension_n);
Consider the following before using the Auto roll up feature:
- If you want to use SUM to aggregate your data, make sure your metrics are additive in each dimension. Here are some examples of non-additive metrics:
- Fraction-based metrics. This includes ratio, percentage, etc. For example, you should not add the unemployment rate of each state to calculate the unemployment rate of the entire country/region.
- Overlap in dimension. For example, you should not add the number of people in to each sport to calculate the number of people who like sports, because there is an overlap between them, one person can like multiple sports.
- To ensure the health of the whole system, the size of cube is limited. Currently, the limit is 100,000. If your data exceeds that limit, ingestion will fail for that timestamp.
- If you want to use SUM to aggregate your data, make sure your metrics are additive in each dimension. Here are some examples of non-additive metrics:
Advanced settings
There are several advanced settings to enable data ingested in a customized way, such as specifying ingestion offset, or concurrency. For more information, see the advanced settings section in the data feed management article.
Specify a name for the data feed and check the ingestion progress
Give a custom name for the data feed, which will be displayed in your workspace. Then select Submit. In the data feed details page, you can use the ingestion progress bar to view status information.

To check ingestion failure details:
- Select Show Details.
- Select Status then choose Failed or Error.
- Hover over a failed ingestion, and view the details message that appears.
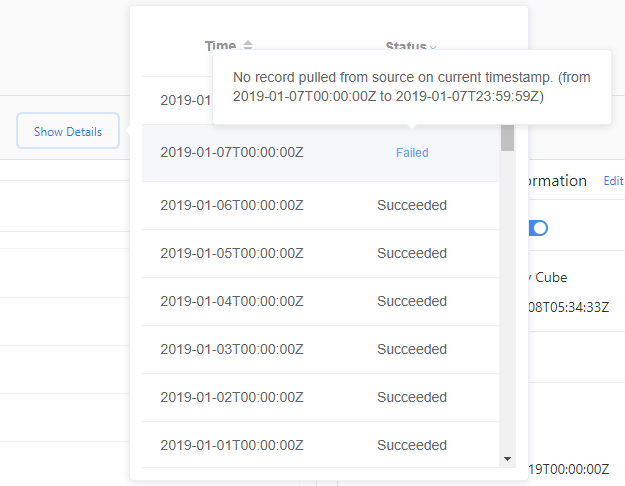
A failed status indicates the ingestion for this data source will be retried later. An Error status indicates Metrics Advisor won't retry for the data source. To reload data, you need to trigger a backfill/reload manually.
You can also reload the progress of an ingestion by clicking Refresh Progress. After data ingestion completes, you're free to click into metrics and check anomaly detection results.