Create a Power BI report filtered by team using a custom Analytics view
Azure DevOps Services | Azure DevOps Server 2022 - Azure DevOps Server 2019
Analytics views support field criteria to filter work items based on teams. However, there's no team-specific field available to support filtering a Power BI report. While each work item is associated with a specific area path, area paths can be associated with more than one team. Because of this one-to-many association, Analytics doesn't provide a team-specific field.
However, you can still filter on a team using the steps provided in this article. The general process introduces a mapping table between the Analytics view and the teams entity.
Note
In a similar manner, limitations exist in determining the board-specific column of a work item within an Analytics view. However, the guidance provided in this article won't work for board locations due to the dependency on the selected historical data in the view.
Prerequisites
- To view Analytics data and query the service, you need to be a member of a project with Basic access or greater. By default, all project members are granted permissions to query Analytics and define Analytics views.
- To learn about other prerequisites regarding service and feature enablement and general data tracking activities, see Permissions and prerequisites to access Analytics.
Add the AreaSK field to your Analytics view
The default fields included within the default Analytics views don't include the fields necessary to create the relationship mapping in Power BI. Use the following steps to introduce the mapping table to your model and build the necessary relationships to support filtering on teams.
- Edit your Analytics view.
- In the Field tab, add the AreaSK field.
- Save the updated view.
- Load the Power BI pbix file associated with your Analytics view in Power BI Desktop.
- Refresh the view and verify that the AreaSK field appears as expected.
Add tables for teams
The next step is to add the Teams entity to the Power BI data model and generate the necessary mapping table to create the relationships in Power BI. This process requires that you add three queries through the Power Query Editor.
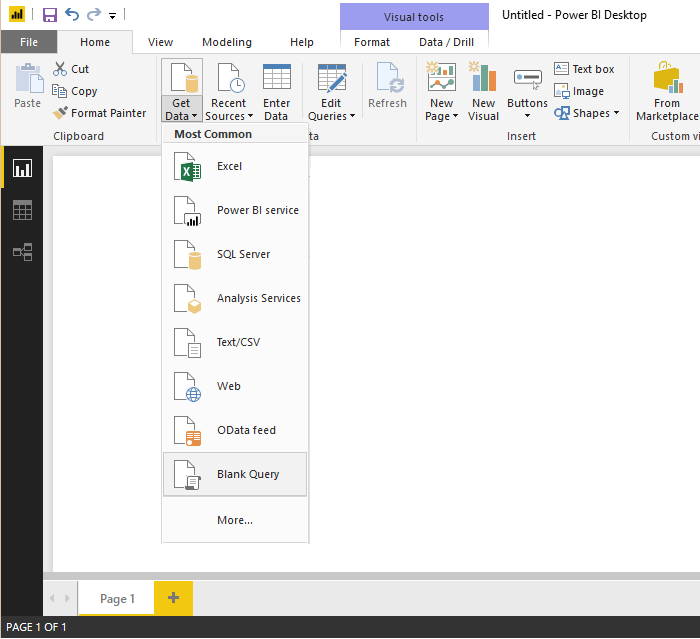
Load the Power BI pbix file associated with your view in Power BI Desktop.
Choose Get Data.
Select the Blank Query option.
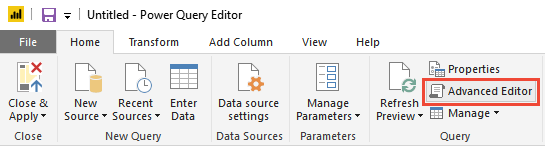
Open Advanced Editor.
Add the following query code, replacing organization information and team names to match your Analytics view.
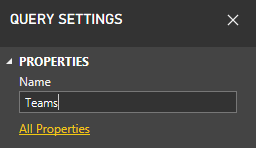
let
    #"Get table" = VSTS.Feed("https://analytics.dev.azure.com/{OrganizationName}/_odata/v2.0/Teams?$select=TeamName,TeamSK&$filter=TeamName eq '{TeamName1}' or TeamName eq '{TeamName2}"),
    #"Select columns" = Table.SelectColumns(#"Get table", {"TeamName", "TeamSK"})
in
    #"Select columns"
Rename the query to Teams.
From the Home tab, choose New Source to add another blank query and rename it to Areas.
Open Advanced Editor and add the following query code, replacing organization information to match your view.
let
    #"Get table" = VSTS.Feed("https://analytics.dev.azure.com/{OrganizationName}/_odata/v2.0/Areas?$select=AreaName,AreaSK"),
    #"Select columns" = Table.SelectColumns(#"Get table", {"AreaName", "AreaSK"})
in
    #"Select columns"
From the Home tab, choose New Source to add another blank query and rename it to AreaToTeam.
Open Advanced Editor and add the following query code, replacing organization information to match your view.
let
    #"Get table" = VSTS.Feed("https://analytics.dev.azure.com/{OrganizationName}/_odata/v2.0/Areas?$select=AreaSK&$expand=Teams($select=TeamSK)"),
    #"Select columns" = Table.SelectColumns(#"Get table", {"AreaSK", "Teams"}),
    #"Expand Teams" = Table.ExpandTableColumn(#"Select columns", "Teams", {"TeamSK"}, {"TeamSK"})
in
    #"Expand Teams"
Important
The process of adding the three queries will only work for Area Paths that map to 1,000 teams or fewer.
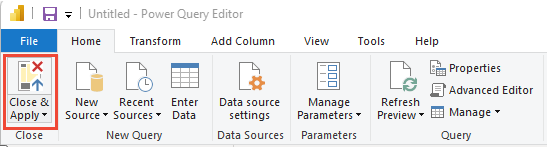
On the Home tab, choose Close & Apply.
Next, choose Refresh to add AreaSK to the view.
Create the Power BI relationship mappings
The last step is to create the necessary relationships in Power BI.
Open the Relationships view.

From the Home tab, open Manage Relationships.

In the Manage Relationships dialog:
a. Delete any relationships that might have been automatically detected.
b. Choose New to create a bidirectional Many to One relationship between your View and Area. To learn more, see Bidirectional cross-filtering using DirectQuery in Power BI Desktop.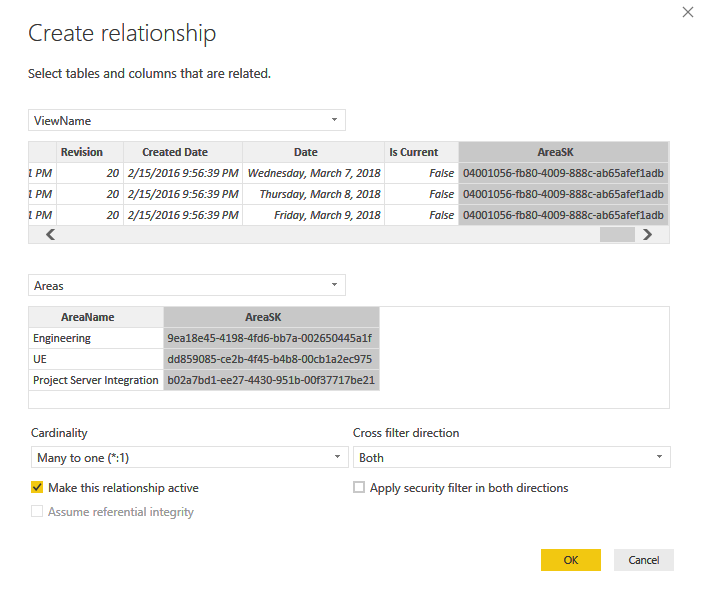
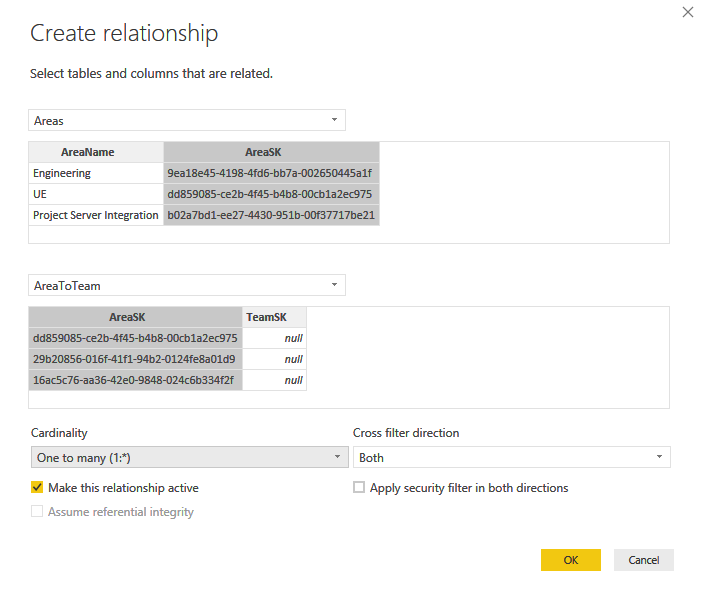
Create a bidirectional One to Many relationship between Areas and AreaToTeam.
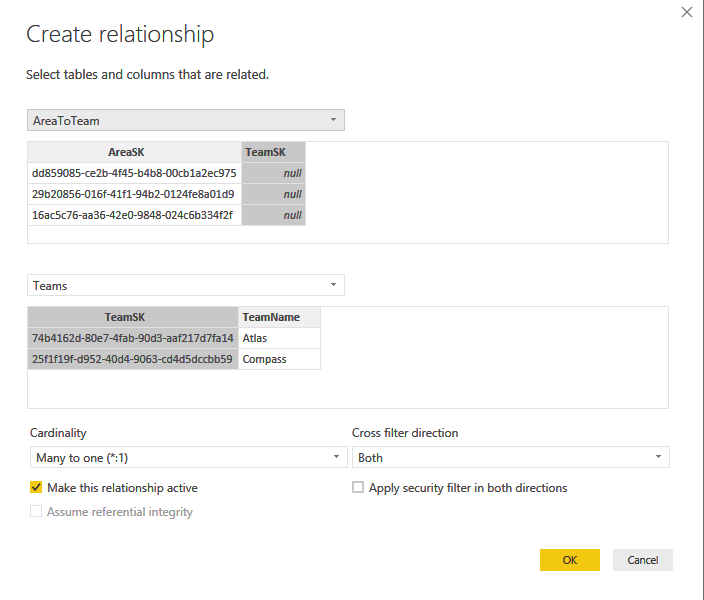
Create a bidirectional Many to One relationship between AreaToTeam and Teams.
Return to the Report view, and open the context menu for TeamName and TeamSK fields and choose the Hide option.
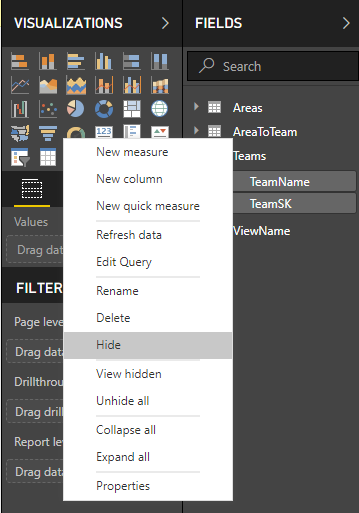
Hide corresponding SKs in your View and Team tables.
Filter a report view on teams
Now that you have the mappings in place, you can filter a report view based on Teams. To begin, start by adding a slicer to your report based on Team Name (remove Blank if needed).
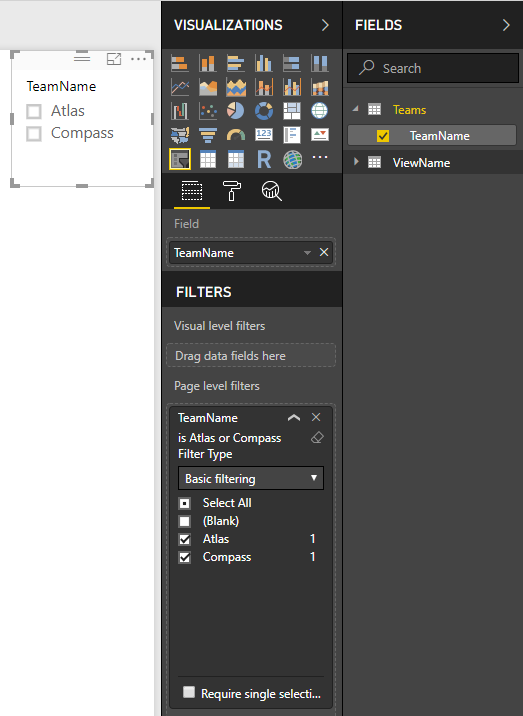
Now you can filter all visualization on a report using a slicer or any other supported filtering functionality in Power BI.

Related articles
Feedback
Coming soon: Throughout 2024 we will be phasing out GitHub Issues as the feedback mechanism for content and replacing it with a new feedback system. For more information see: https://aka.ms/ContentUserFeedback.
Submit and view feedback for