Real-time monitoring in Azure Front Door
Azure Front Door is integrated with Azure Monitor. You can use metrics in real time to measure traffic to your application, and to track, troubleshoot, and debug issues.
You can also configure alerts for each metric such as a threshold for 4XXErrorRate or 5XXErrorRate. When the error rate exceeds the threshold, it triggers an alert as configured. For more information, see Create, view, and manage metric alerts using Azure Monitor.
Access metrics in the Azure portal
Sign in to the Azure portal and navigate to your Azure Front Door Standard/Premium profile.
Under Monitoring, select Metrics.
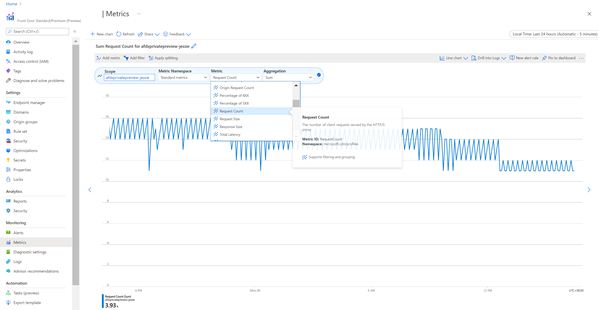
In Metrics, select the metric to add:
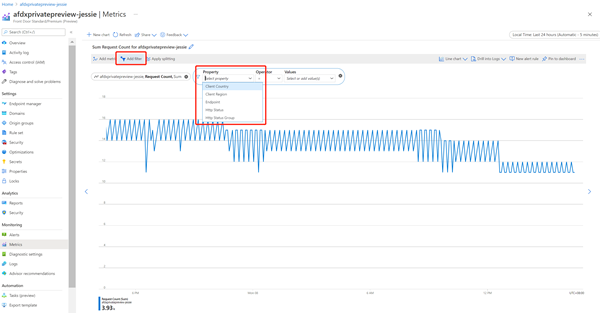
Select Add filter to add a filter:
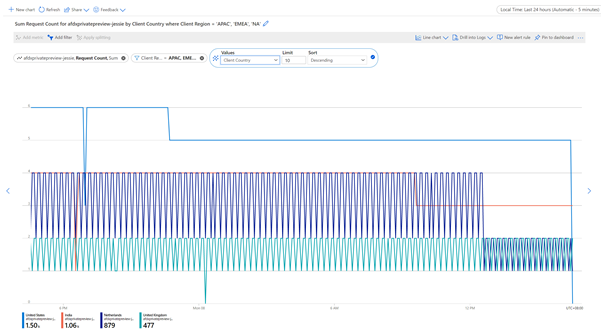
Select Apply splitting to split data by different dimensions:
Select New chart to add a new chart:


Configure alerts in the Azure portal
Sign in to the Azure portal and navigate to your Azure Front Door Standard/Premium profile.
Under Monitoring, select Alerts.
Select New alert rule for metrics listed in Metrics section.
Alert is charged based on Azure Monitor. For more information about alerts, see Azure Monitor alerts.
Next steps
- Learn about Azure Front Door reports.
- Learn about Azure Front Door logs.
Feedback
Coming soon: Throughout 2024 we will be phasing out GitHub Issues as the feedback mechanism for content and replacing it with a new feedback system. For more information see: https://aka.ms/ContentUserFeedback.
Submit and view feedback for