Azure Front Door reports
Azure Front Door analytics reports provide a built-in, all-around view of how your Azure Front Door profile behaves, along with associated web application firewall (WAF) metrics. You can also take advantage of Azure Front Door's logs to do further troubleshooting and debugging.
The built-in reports include information about your traffic and your application's security. Azure Front Door provides traffic reports and security reports.
| Traffic report | Details |
|---|---|
| Key metrics in all reports | Shows overall data that were sent from Azure Front Door edge points of presence (PoPs) to clients, including:
|
| Traffic by domain | Provides an overview of all the domains within your Azure Front Door profile:
|
| Traffic by location |
|
| Usage |
|
| Caching |
|
| Top URL |
|
| Top referrer |
|
| Top user agent |
|
| Security report | Details |
|---|---|
| Overview of key metrics |
|
| Metrics by dimensions |
|
Note
Security reports are only available when you use the Azure Front Door premium tier.
Reports are free of charge. Most reports are based on access log data, but you don't need to enable access logs or make any configuration changes to use the reports.
How to access reports
Reports are accessible through the Azure portal and through the Azure Resource Manager API. You can also download reports as comma-separated values (CSV) files.
Reports support any selected date range from the previous 90 days. With data points of every 5 mins, every hour, or every day based on the date range selected. Normally, you can view data with delay of within an hour and occasionally with delay of up to a few hours.
Access reports by using the Azure portal
Sign in to the Azure portal and select your Azure Front Door Standard/Premium profile.
In the navigation pane, select Reports or Security under Analytics.
Select the report you want to view.
- Traffic by domain
- Usage
- Traffic by location
- Cache
- Top url
- Top referrer
- Top user agent
After choosing the report, you can select different filters.
Show data for: Select the date range for which you want to view traffic by domain. Available ranges are:
- Last 24 hours
- Last 7 days
- Last 30 days
- Last 90 days
- This month
- Last month
- Custom date
By default, data is shown for the last seven days. For reports with line charts, the data granularity goes with the date ranges you selected as the default behavior.
- 5 minutes - one data point every 5 minutes for date ranges less than or equal to 24 hours. This granularity level can be used for date ranges that are 14 days or shorter.
- By hour – one data point every hour for date ranges between 24 hours and 30 days.
- By day – one data point per day for date ranges longer than 30 days.
Select Aggregation to change the default aggregation granularity.
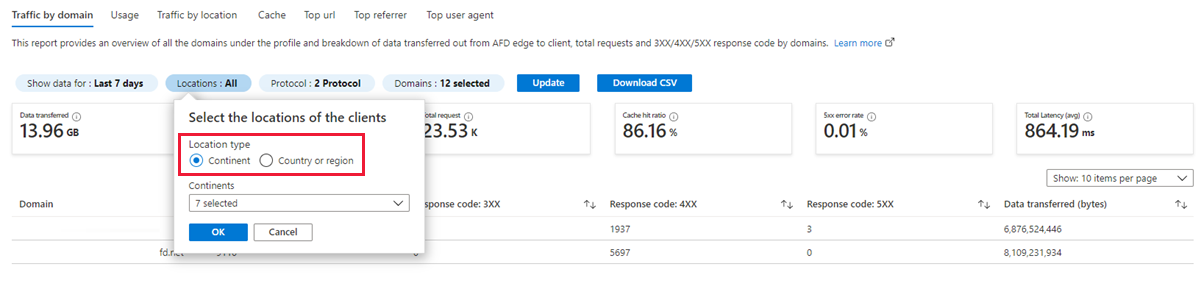
Location: Select one or more countries/regions to filter by the client locations. Countries/regions are grouped into six regions: North America, Asia, Europe, Africa, Oceania, and South America. Refer to countries/regions mapping. By default, all countries are selected.
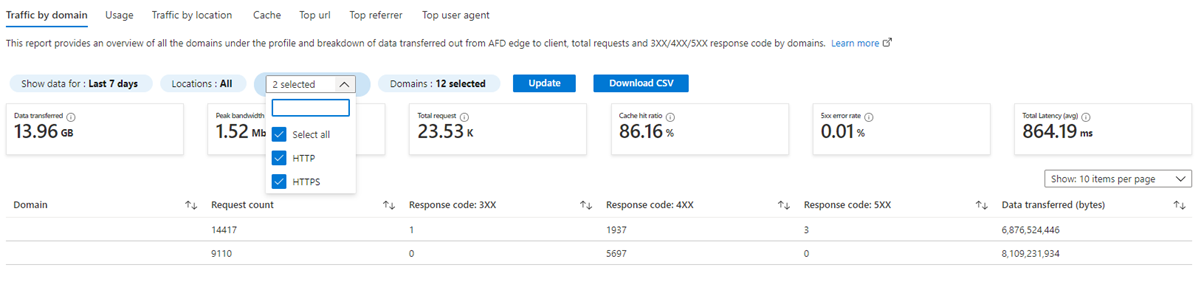
Protocol: Select either HTTP or HTTPS to view traffic data for the selected protocol.
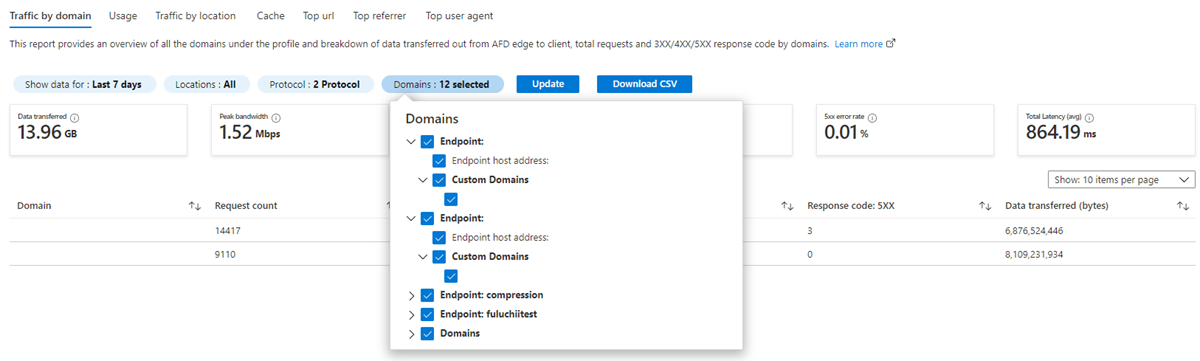
Domains - Select one or more endpoints or custom domains. By default, all endpoints and custom domains are selected.
- If you delete an endpoint or a custom domain in one profile and then recreate the same endpoint or domain in another profile, the report counts the new endpoint as a different endpoint.
- If you delete a custom domain and bind it to a different endpoint, the behavior depends on how you view the report. If you view the report by custom domains, then they're treated as one custom domain. If you view the report by endpoint, they're treated as separate items.
If you want to export the data to a CSV file, select the Download CSV link on the selected tab.
Export reports in CSV format
You can download any of the Azure Front Door reports as a CSV file. Every CSV report includes some general information and the information is available in all CSV files:
| Value | Description |
|---|---|
| Report | The name of the report. |
| Domains | The list of the endpoints or custom domains for the report. |
| StartDateUTC | The start of the date range for which you generated the report, in Coordinated Universal Time (UTC). |
| EndDateUTC | The end of the date range for which you generated the report, in Coordinated Universal Time (UTC). |
| GeneratedTimeUTC | The date and time when you generated the report, in Coordinated Universal Time (UTC). |
| Location | The list of the countries/regions where the client requests originated. The value is All by default. Not applicable to the Security report. |
| Protocol | The protocol of the request, which is either HTTP or HTTPS. Not applicable to Top URL, Traffic by user agent, and Security reports. |
| Aggregation | The granularity of data aggregation in each row, every 5 minutes, every hour, and every day. Not applicable to Traffic by domain, Top URL, Traffic by user agent reports, and Security reports. |
Each report also includes its own variables. Select a report to view the variables that the report includes.
The Traffic by domain report includes these fields:
- Domain
- Total Request
- Cache Hit Ratio
- 3XX Requests
- 4XX Requests
- 5XX Requests
- ByteTransferredFromEdgeToClient
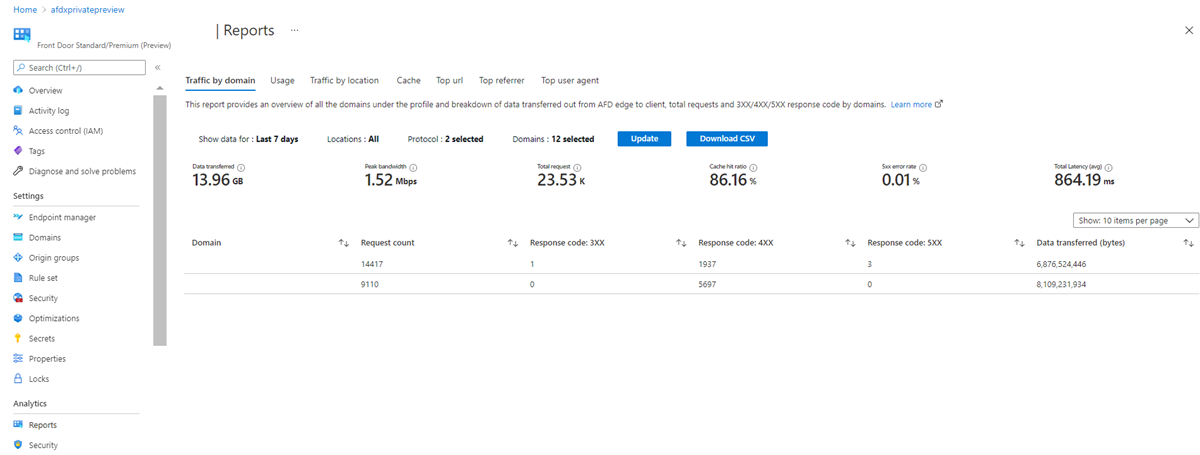
Key metrics included in all reports
The following metrics are used within the reports.
| Metric | Description |
|---|---|
| Data Transferred | Shows data transferred from Azure Front Door edge PoPs to client for the selected time frame, client locations, domains, and protocols. |
| Peak Bandwidth | Peak bandwidth usage in bits per seconds from Azure Front Door edge PoPs to clients for the selected time frame, client locations, domains, and protocols. |
| Total Requests | The number of requests that Azure Front Door edge PoPs responded to clients for the selected time frame, client locations, domains, and protocols. |
| Cache Hit Ratio | The percentage of all the cacheable requests for which Azure Front Door served the contents from its edge caches for the selected time frame, client locations, domains, and protocols. |
| 5XX Error Rate | The percentage of requests for which the HTTP status code to client was a 5XX for the selected time frame, client locations, domains, and protocols. |
| Total Latency | Average latency of all the requests for the selected time frame, client locations, domains, and protocols. The latency for each request is measured as the total time of when the client request gets received by Azure Front Door until the last response byte sent from Azure Front Door to client. |
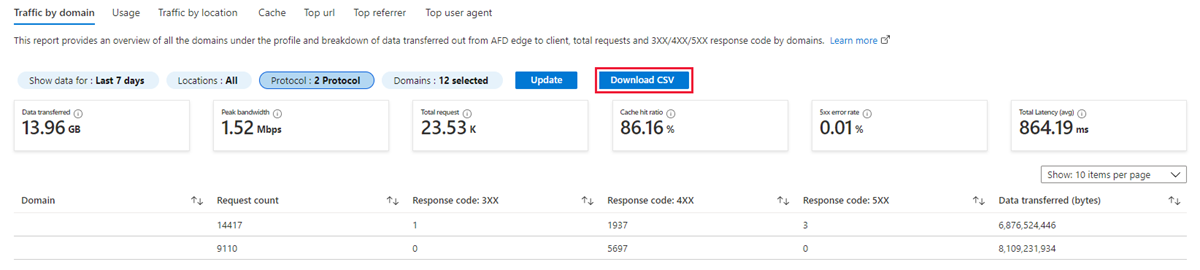
Traffic by domain report
The traffic by domain report provides a grid view of all the domains under this Azure Front Door profile.
In this report, you can view:
- Request counts
- Data transferred out from Azure Front Door to client
- Requests with status code (3XX, 4XX, and 5XX) of each domain
Domains include endpoint domains and custom domains.
You can go to other tabs to investigate further or view access log for more information if you find the metrics below your expectation.
Usage report
The usage report shows the trends of traffic and response status code by various dimensions.

The dimensions included in the usage report are:
- Data transferred from edge to client and from origin to edge, in a line chart.
- Data transferred from edge to client by protocol, in a line chart.
- Number of requests from edge to clients, in a line chart.
- Number of requests from edge to clients by protocol (HTTP and HTTPS), in a line chart.
- Bandwidth from edge to client, in a line chart.
- Total latency, which measures the total time from the client request received by Azure Front Door until the last response byte sent from Azure Front Door to the client, in a line chart.
- Number of requests from edge to clients by HTTP status code, in a line chart. Every request generates an HTTP status code. HTTP status code appears as the HTTPStatusCode in the raw access log. The status code describes how the Azure Front Door edge PoP handled the request. For example, a 2XX status code indicates that the request was successfully served to a client. While a 4XX status code indicates that an error occurred.
- Number of requests from the edge to clients by HTTP status code, in a line chart. The percentage of requests by HTTP status code is shown in a grid.
Traffic by location report
The traffic by location report displays:
- The top 50 countries/regions of visitors that access your assets the most.
- A breakdown of metrics by countries/regions and gives you an overall view of countries/regions where the most traffic gets generated.
- The countries/regions that have higher cache hit ratios, and higher 4XX/5XX error code rates.

The following items are included in the reports:
- A world map view of the top 50 countries/regions by data transferred out or requests of your choice.
- Two line charts showing a trend view of the top five countries/regions by data transferred out and requests of your choice.
- A grid of the top countries or regions with corresponding data transferred out from Azure Front Door to clients, the percentage of data transferred out, the number of requests, the percentage of requests by the country or region, cache hit ratio, 4XX response code counts, and 5XX response code counts.
Caching report
The caching report provides a chart view of cache hits and misses, and the cache hit ratio, based on requests. Understanding how Azure Front Door caches your content helps you to improve your application's performance because cache hits give you the fastest performance. You can optimize data delivery speeds by minimizing cache misses.

The caching report includes:
- Cache hit and miss count trend, in a line chart.
- Cache hit ratio, in a line chart.
Cache hits/misses describe the request number cache hits and cache misses for client requests.
- Hits: client requests that get served directly from Azure Front Door edge PoPs. Refers to those requests whose values for CacheStatus in the raw access logs are HIT, PARTIAL_HIT, or REMOTE_HIT.
- Miss: client requests that get served by Azure Front Door edge POPs fetching contents from origin. Refers to those requests whose values for the field CacheStatus in the raw access raw logs are MISS.
Cache hit ratio describes the percentage of cached requests that are served from edge directly. The formula of the cache hit ratio is: (PARTIAL_HIT +REMOTE_HIT+HIT/ (HIT + MISS + PARTIAL_HIT + REMOTE_HIT)*100%.
Requests that meet the following requirements are included in the calculation:
- The requested content was cached on an Azure Front Door PoP.
- Partial cached contents for object chunking.
It excludes all of the following cases:
- Requests that are denied because of a Rule Set.
- Requests that contain matching Rules Set, which is set to disable the cache.
- Requests that get blocked by the Azure Front Door WAF.
- Requests when the origin response headers indicate that they shouldn't be cached. For example, requests with
Cache-Control: private,Cache-Control: no-cache, orPragma: no-cacheheaders prevent the response from being cached.
Top URL report
The top URL report allow you to view the amount of traffic incurred through a particular endpoint or custom domain. You see data for the most requested 50 assets during any period in the past 90 days.

Popular URLs are displayed with the following values:
- URL, which refers to the full path of the requested asset in the format of
http(s)://contoso.com/index.html/images/example.jpg. URL refers to the value of the RequestUri field in the raw access log. - Request counts.
- Request counts as a percentage of the total requests served by Azure Front Door.
- Data transferred.
- Data transferred percentage.
- Cache hit ratio percentage.
- Requests with response codes of 4XX.
- Requests with response codes of 5XX.
User can sort URLs by request count, request count percentage, data transferred, and data transferred percentage. The system aggregates all metrics by hour, and they might vary based on the selected time frame.
Note
Top URLs might change over time. To get an accurate list of the top 50 URLs, Azure Front Door counts all your URL requests by hour and keep the running total over the course of a day. The URLs at the bottom of the 50 URLs may rise onto or drop off the list over the day, so the total number of these URLs are approximations.
The top 50 URLs may rise and fall in the list, but they rarely disappear from the list, so the numbers for top URLs are usually reliable. When a URL drops off the list and rise up again over a day, the number of request during the period when they are missing from the list is estimated based on the request number of the URL that appear in that period.
Top referrer report
The top referrer report shows you the top 50 referrers to a particular Azure Front Door endpoint or custom domain. You can view data for any period in the past 90 days. A referrer indicates the URL from which a request was generated. Referrer might come from a search engine or other websites. If a user types a URL (for example, https://contoso.com/index.html) directly into the address bar of a browser, the referrer for the requested is Empty.

The top referrer report includes the following values.
- Referrer, which is the value of the Referrer field in the raw access log.
- Request counts.
- Request count as a percentage of total requests served by Azure Front Door in the selected time period.
- Data transferred.
- Data transferred percentage.
- Cache hit ratio percentage.
- Requests with response code as 4XX.
- Requests with response code as 5XX.
You can sort by request count, request %, data transferred and data transferred %. The system aggregates all metrics by hour, and they might vary based on the selected time frame.
Top user agent report
The top user agent report shows graphical and statistics views of the top 50 user agents that were used to request content. The following list shows example user agents:
- Mozilla/5.0 (Windows NT 10.0; WOW64)
- AppleWebKit/537.36 (KHTML, like Gecko)
- Chrome/86.0.4240.75
- Safari/537.36.
A grid displays the request counts, request %, data transferred and data transferred, cache Hit Ratio %, requests with response code as 4XX and requests with response code as 5XX. User Agent refers to the value of UserAgent in access logs.
Note
Top user agents might change over time. To get an accurate list of the top 50 user agents, Azure Front Door counts all your user agent requests by hour and keep the running total over the course of a day. The user agents at the bottom of the 50 user agents may rise onto or drop off the list over the day, so the total number of these user agents are approximations.
The top 50 user agents may rise and fall in the list, but they rarely disappear from the list, so the numbers for top user agents are usually reliable. When a user agent drops off the list and rise up again over a day, the number of request during the period when they are missing from the list is estimated based on the request number of the user agents that appear in that period.
Security report
The security report provides graphical and statistics views of WAF activity.
| Dimensions | Description |
|---|---|
| Overview metrics - Matched WAF rules | Requests that match custom WAF rules, managed WAF rules and bot protection rules. |
| Overview metrics - Blocked Requests | The percentage of requests that gets blocked by WAF rules among all the requests that matched WAF rules. |
| Overview metrics - Matched Managed Rules | Requests that match managed WAF rules. |
| Overview metrics - Matched Custom Rule | Requests that match custom WAF rules. |
| Overview metrics - Matched Bot Rule | Requests that match bot protection rules. |
| WAF request trend by action | Four line-charts trend for requests by action. Actions are Block, Log, Allow, and Redirect. |
| Events by Rule Type | Doughnut chart of the WAF requests distribution by rule type. Rule types include bot protection rules, custom rules, and managed rules. |
| Events by Rule Group | Doughnut chart of the WAF requests distribution by rule group. |
| Requests by actions | A table of requests by actions, in descending order. |
| Requests by top Rule IDs | A table of requests by top 50 rule IDs, in descending order. |
| Requests by top countries/regions | A table of requests by top 50 countries/regions, in descending order. |
| Requests by top client IPs | A table of requests by top 50 IPs, in descending order. |
| Requests by top Request URL | A table of requests by top 50 URLs, in descending order. |
| Request by top Hostnames | A table of requests by top 50 hostname, in descending order. |
| Requests by top user agents | A table of requests by top 50 user agents, in descending order. |
Next steps
Learn about Azure Front Door real time monitoring metrics.
Feedback
Coming soon: Throughout 2024 we will be phasing out GitHub Issues as the feedback mechanism for content and replacing it with a new feedback system. For more information see: https://aka.ms/ContentUserFeedback.
Submit and view feedback for