Log Analytics migration guide for Azure HDInsight clusters
Azure HDInsight is an enterprise-ready, managed-cluster service. This service runs open-source analytics frameworks like Apache Spark, Hadoop, HBase, and Kafka on Azure. Azure HDInsight has integrated with other Azure services to enable customers to better manage their big data analytics applications.
Log Analytics provides a tool in the Azure portal to edit and run log queries. The queries come from data collected by Azure Monitor Logs and interactively analyze their results. Customers can use Log Analytics queries to retrieve records that match specific criteria. They can also use queries to identify trends, analyze patterns, and provide insights into their data.
Azure HDInsight enabled integration with Log Analytics in 2017. HDInsight customers quickly adopted this feature to monitor their HDInsight clusters and query the logs in the clusters. While adoption of this feature has increased, customers have provided feedback about the integration:
- Customers can't decide which logs to store, and storing all the logs can become expensive.
- Current HDInsight schemas logs aren't following consistent naming conventions and some tables are repetitive.
- Customers want an out-of-box dashboard to easily monitor the KPI of their HDInsight clusters.
- Customers must jump to Log Analytics to run simple queries.
Solution overview
Considering customer feedback, the Azure HDInsight team invested in integration with Azure Monitor. This integration enables:
- A new set of tables in customers' Log Analytics workspace. The new tables are delivered through a new Log Analytics pipeline.
- Higher reliability
- Faster log delivery
- Resource-based table grouping and default queries
Note
New Azure Montitor integration is in Public Preview across all regions where HDInsight is available.
Benefits of the new Azure Monitor integration
This document outlines the changes to the Azure Monitor integration and provides best-practices for using the new tables.
Redesigned schemas: The schema formatting for the new Azure Monitor integration is better organized and easy to understand. There are two-thirds fewer schemas to remove as much ambiguity in the legacy schemas as possible.
Selective Logging: There are logs and metrics available through Log Analytics. To help you save on monitoring costs, we'll be releasing a new selective logging feature. Use this feature to turn on and off different logs and metric sources. With this feature, you'll only have to pay for what you use. For more details see Selective Logging
Logs cluster portal integration: The Logs pane is new to the HDInsight Cluster portal. Anyone with access to the cluster can go to this pane to query any table that the cluster resource sends records to. Users don't need access to the Log Analytics workspace anymore to see the records for a specific cluster resource.
Insights cluster portal integration: The Insights pane is also new to the HDInsight Cluster portal. After enabling the new Azure Monitor integration, you can select the Insights pane and an out-of-box logs and metrics dashboard specific to the cluster's type will automatically populate for you. These dashboards have been revamped from our previous Azure solutions. They give you deep insights into your cluster's performance and health.
Customer scenarios
The following sections describe how customers can use the new Azure Monitor integration in different scenarios. The Activate a new Azure Monitor integration section outlines how to activate and use the new Azure Monitor integration. The Migrating from Azure Monitor Classic to the new Azure Monitor Integration section includes additional information for users that depend on the old Azure Monitor integration.
Note
Only clusters created in late-September 2020 and after are eligible for the new Azure Monitoring integration.
Activate a new Azure Monitor integration
Note
You must have a Log Analytics workspace created in a subscription you have access to before doing enabling the new integration. For more information about how to create a Log Analytics workspace, see Create a Log Analytics workspace in the Azure portal.
Activate the new integration by going to your cluster's portal page and scrolling down the menu on the left until you reach the Monitoring section. In the Monitoring section, select Monitor integration. Then, select Enable and you can choose the Log Analytics workspace that you want your logs to be sent to. Select Save once you have chosen your workspace.
Access the new tables
There are two ways you can access the new tables.
Approach 1:
The first way to access the new tables is through the Log Analytics workspace.
- Go to the Log Analytics workspace that you selected when you enabled the integration.
- Scroll down in the menu on the left side of the screen and select Logs. A Logs query editor will pop up with a list of all the tables in the workspace.
- If the tables are grouped by Solution, the new HDI tables are under the Logs Management section.
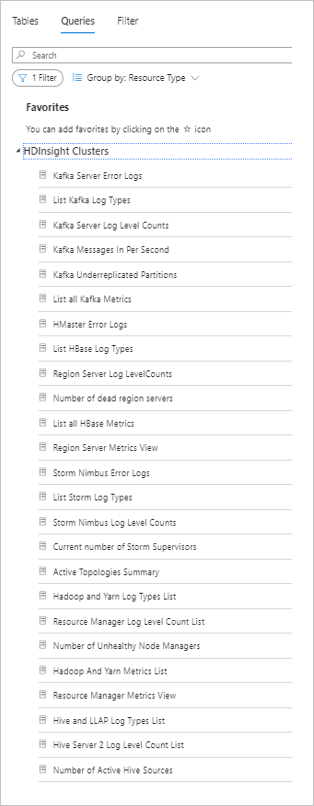
- If you group the tables by Resource Type, the tables are under the HDInsight Clusters section as shown in the image below.
Note
This process describes how the logs were accessed in the old integration. This requires the user to have access to the workspace.
Approach 2:
The second way to access the new tables is through Cluster portal access.
- Navigate to your Cluster's portal page and scroll down the menu on the left side until you see the Monitoring section. In this section, you'll see the Logs pane.
- Select Logs and a Logs query editor appears. The editor contains all logs that are associated with the cluster resource. You sent the logs to the Log Analytics workspace when you enabled integration. These logs provide resource-based access (RBAC). With RBAC, users who have access to the cluster but not to the workspace can see the logs that are associated with the cluster.
For comparison, the following screenshots show the legacy integration workspace view and the new integration workspace view:
Legacy integration workspace view

New integration workspace view

Use the new tables
These integrations can help you use the new tables:
Default queries to use with new tables
In your Logs query editor, set the toggle to Queries above the tables list. Make sure that you group the queries by Resource Type and that there's no filter set for a resource type other than HDInsight Clusters. The following image shows how the results look when grouped by Resource Type and filtered for HDInsight Clusters. Just select one and it appears in the Logs query editor. Be sure to read the comments included in the queries, as some require you to enter some information, like your cluster name, for the query to run successfully.
Create your own queries
You can enter your own queries in the Logs query editor. Queries used on the old tables won't be valid on the new tables as many of the new tables have new, refined schemas. The default queries are great references for shaping queries on the new tables.
Insights
Insights are cluster-specific visualization dashboards made using Azure Workbooks. These dashboards give you detailed graphs and visualizations of how your cluster is running. The dashboards have sections for each cluster type, YARN, system metrics, and component logs. You can access your cluster's dashboard by visiting your cluster's page in the portal, scrolling down to the Monitoring section, and selecting the Insights pane. The dashboard loads automatically if you've enabled the new integration. Allow a few seconds for the graphs to load as they query the logs.

Custom Azure workbooks
You can create your own Azure workbooks with custom graphs and visualizations. In your cluster's portal page, scroll down to the Monitoring section and select the Workbooks pane in the menu on the left. You can either start using a blank template or use one of the templates under the HDInsight Clusters section. There's a template for each cluster type. Templates are useful if you want to save specific customizations that the default HDInsight Insights don't provide. Feel free to send in requests for new features in the HDInsight Insights if you feel they're lacking something.
Alerts
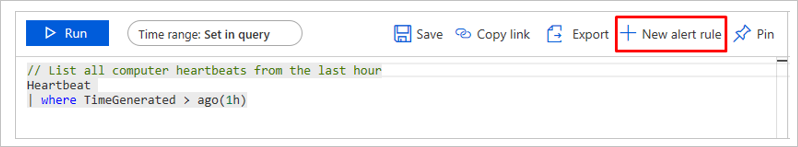
You can add custom alerts to your clusters and workspaces in the Log query editor. Go to the Logs query editor by selecting the Logs pane from either your cluster or workspace portal. Run a query and then select New Alert Rule as shown in the following screenshot. For more information, read about configuring alerts.
Migrate to the new Azure Monitor Integration
If you're using the classic Azure Monitor integration, you need to make some adjustments to the new table formats after you switch to the new Azure Monitor integration.
To enable the new Azure Monitor integration, follow the steps outlined in the Activate a new Azure Monitor integration section.
Run queries in Log Analytics
Since the new table format is different from the previous one, your queries need to be reworked so you can use our new tables. Once you enable the new Azure Monitor integration, you can browse the tables and schemas to identify the fields that are used in your old queries.
We provide a mapping table between the old table to the new table to help you quickly find the new fields you need to use to migrate your dashboards and queries.
Default queries: We created default queries that show how to use the new tables for common situations. The default queries also show what information is available in each table. You can access the default queries by following the instructions in the Default queries to use with new tables section in this article.
Update dashboards for HDInsight clusters
If you have built multiple dashboards to monitor your HDInsight clusters, you need to adjust the query behind the table once you enable the new Azure Monitor integration. The table name or the field name might change in the new integration, but all the information you have in old integration is included.
Refer to the mapping table between the old table/schema to the new table/schema to update the query behind the dashboards.
Out-of-box dashboards
We also improved the out-of-box dashboards both at the cluster-level. There's a button on the top right of every graph that allows you to see the underlying query that produces the information. The graph is a great way to familiarize yourself with how the new tables can be queried effectively.
Enable both integrations to accelerate the migration
You can activate both the classic and the new Azure Monitor integrations at the same time on a cluster that is eligible for both integrations to migrate to the new Azure Monitor integration quickly. The new integration is available for all clusters created after mid-September 2020.
In this way, you can easily do a side-by-side comparison for the queries you're using.
Enabling the classic integration
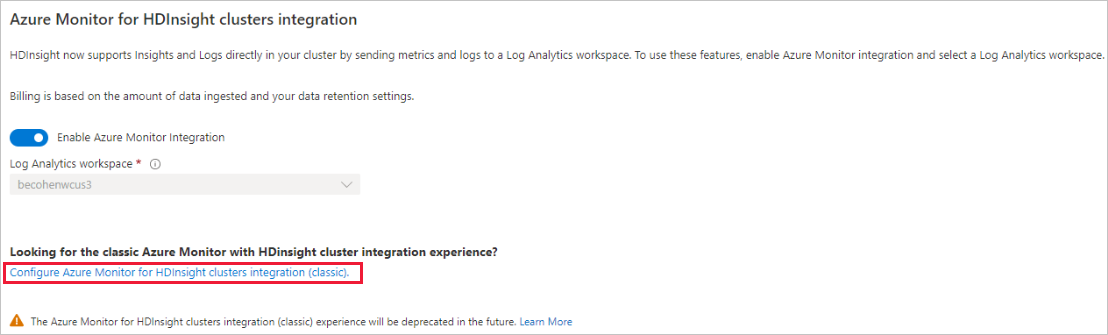
If you're using a cluster created after mid-September 2020, you'll see the new portal experience in your cluster's portal. To enable the new pipeline, you can follow the steps outlined in the Activate a new Azure Monitor integration section. To activate the classic integration on this cluster, go to your cluster's portal page. Select the Monitor integration pane in the Monitoring section of the menu on the left side of your cluster portal page. Select Configure Azure Monitor for HDInsight clusters integration (classic). A side context appears with a toggle you can use to enable and disable the classic Azure Monitoring integration.
Note
You won't see any logs or metrics from the classic integration through your Cluster portal's logs and Insights page. Only the new integrations logs and metrics will be present in those locations.
Creating new clusters with classic Azure Monitor integration is not available after Jan 1, 2023.
Release and support timeline
- Classic Azure Monitoring integration will be unavailable after October 15, 2021. You can't enable classic Azure Monitoring integration after that date.
- Existing classic Azure monitoring integrations will continue to work. There will be limited support for the classic Azure Monitoring integration.
- Issues will be investigated once customers submit the support ticket.
- If solution requires image change, customers should move to the new integration.
- We won't patch the classic Azure Monitoring integration clusters except for critical security issues.
Appendix: Table mapping
For the log table mappings from the classic Azure Monitor integration to the new one, see Log table mapping.
Related content
Feedback
Coming soon: Throughout 2024 we will be phasing out GitHub Issues as the feedback mechanism for content and replacing it with a new feedback system. For more information see: https://aka.ms/ContentUserFeedback.
Submit and view feedback for